PERMANYER www.permanyer.com
ORIGINAL ARTICLE Rev Inves Clin. 2015;67:240-9
Carotid Intima-Media Thickness,
Ankle-Arm Index, and Inflammation
Profile in Mexican Patients with Early
and Late Onset Type 2 Diabetes
Alicia Contreras-Rodríguez
1, Rita A. Gómez-Díaz
2*, Janet Tanus-Hajj
3, Juan O. Talavera
2,
Rafael Mondragón-González
2and Niels H. Wacher
21Radiodiagnostic Service, UMAE Hospital de Cardiología, Centro Médico Nacional Siglo XXI; 2Medical Research Unit in
Clinical Epidemiology, UMAE Hospital de Especialidades, Centro Médico Nacional Siglo XXI; 3Radiodiagnostic Service,
UMAE Hospital de Especialidades, Centro Médico Nacional Siglo XXI, Instituto Mexicano del Seguro Social (IMSS), México, D.F., México
Corresponding author:
*Rita Angélica Gómez-Díaz Centro Médico Nacional Siglo XXI,
Av. Cuauhtémoc, 330, Col. Doctores, Del. Cuauhtémoc, C.P. 06720, México, D.F., México
E-mail: [email protected] Received for publication: 14-05-2015 Accepted for publication: 13-06-2015
ABSTRACT
Background: Type 2 diabetes is strongly linked to an increased incidence of cardiovascular outcomes. Carotid artery intima-media
thickness and ankle-arm index are non-invasive complementary measures as subclinical markers of atherosclerosis. Objective:
To evaluate the association of carotid intima-media thickness, ankle-arm index, and inflammation profile in Mexican patients with early- and late-onset type 2 diabetes mellitus. Material and Methods: We included 145 subjects at an academic medical
center: 77 patients with early-onset (< 40 years of age) and 33 patients with late-onset (≥ 40 years) type 2 diabetes mellitus, and 35 healthy volunteers. Clinical history, anthropometrics, blood chemistry, lipids profile, glycosylated hemoglobin A1c, cytokines, and high-sensitivity C-reactive protein were determined; carotid and lower limb ultrasound were taken. Groups were compared with ANOVA or Kruskal-Wallis, Student’s t or Mann-Whitney U. Spearman or Pearson correlation and logistic regression analysis were used. Results: There were anthropometric and biochemical differences between the three groups. Concentrations of
interleukin-1β, -4 and -6 were significantly higher in patients with late versus early onset diabetes. There were differences in
carotid intima-media thickness and ankle-arm index between early and late onset. Age, body mass index, high-density lipoprotein cholesterol, high-sensitivity C-reactive protein, waist circumference, and glycosylated hemoglobin A1c showed direct correlation with carotid intima-media thickness, while ankle-arm index showed inverse correlation with blood pressure, glycosylated hemo-globin A1c, time with disease, age at onset, triglycerides, and fibrinogen. Multivariate analysis showed an association between carotid intima-media thickness and disease duration; ankle-arm index with disease duration and high-sensitivity C-reactive protein; while only body mass index associated with end diastolic flow velocity. Conclusions: Our findings suggest that carotid
intima-media thickness and ankle-arm index are associated with inflammation markers and could be included in the evaluation of type 2 diabetes mellitus patients, according to disease onset and duration. There are important differences in interleukin concentrations between early- and late-onset type 2 diabetes mellitus. Additionally, measurement of high-sensitivity C-reactive protein is suggested in patients with abnormal ankle-arm index. (REV INVES CLIN. 2015;67:240-9)
Key words: Type 2 diabetes. cIMT. Ankle-arm index. Inflammation marker. Early onset.
.r
e
hsi
l
b
u
p
e
ht
f
o
n
ois
si
mr
e
p
ne
tti
r
w r
oir
p
e
ht
t
u
o
hti
w
g
ni
y
p
oc
ot
o
h
p r
o
de
c
u
d
or
pe
r
e
b
ya
m
n
oit
aci
l
b
u
p s
i
ht
f
o t
ra
p
o
N
INTRODUCTION
Type 2 diabetes mellitus (T2DM) is a chronic disease with long-term morbidity and high mortality as a result of atherosclerosis1. In the last few years, the clinical
spectrum of diabetes in Mexico has expanded to af-fect people under 40 years of age. Between 1993 and 2006, the overall prevalence of T2DM doubled, associ-ated with obesity and a clinical profile of metabolic syn-drome. It appears that early-onset T2DM is becoming more common and may increase future hospitalizations due to diabetes with a corresponding increment in as-sociated healthcare costs2. In fact, the 2012 National
Health and Nutrition Survey in Mexico (Encuesta Na-cional de Salud y Nutrición, ENSANUT) estimated that 9.17% of Mexicans have been diagnosed with diabetes3.
The decrease in the age of onset of T2DM is related with an increase in obesity in the young, including chil-dren and adolescents4. There is an inverse relationship
between the degree of obesity and the age of T2DM onset, even in young adults5.
Early-onset T2DM is a complex metabolic disorder with multifactorial and polygenic pathology that is characterized by hyperglycemia secondary to an im-portant gradual deficit in the secretion of insulin by pancreatic β-cells in a shorter time, compared with late-onset T2DM, and which also includes the pres-ence of insulin resistance6.
Cardiovascular disorders in the population with diabetes are 2-3 times more frequent than in the non-diabetic population7.The inflammatory process in diabetic
pa-tients is essential for the development and progress of atherogenesis, ending in the formation of athero-sclerotic plaques, which, during their development, may fissure or erode, causing the formation of thrombi. Various systemic inflammation markers have been studied to evaluate this process, including ultrasensitive C-reac-tive protein (hs-CRP), interleukin 1 (IL-1), interleukin 6 (IL-6), interleukin 8 (IL-8), and tissue necrosis fac-tor alpha (TNF-α)8,9. Today, the rise in these markers is thought to be related to a greater expression of IL-6 or TNF-α in intraabdominal adipose tissue, with increase in leptin concentrations and decrease of adiponectin (an anti-inflammatory and anti-atherogenic protein)10.
To evaluate anomalies in carotid intima-media thick-ness (cIMT), readings should be compared with the
population of reference. The cIMT measured by B-mode echography in real time is directly related with different phases of atherosclerosis development11. At
the same time, it has been reported that flow velocity relates with vessel distensibility and diameter, consti-tuting a homodynamic measure of vessel function12.
Although in general a cIMT is considered abnormal when it is > 0.908 mm, any point in the cohort above the 80th percentile of the study population is consid-ered pathological13. The presence of plaque during the
study is considered an equivalent of high cardiovas-cular risk, and allows the reclassification of an individ-ual from the intermediate-risk category to a high-risk, thus supporting the need for intervention. It has been demonstrated that an increase in cIMT in patients with T2DM (≥ 60 years old) without a history of coro-nary or cerebrovascular disease progresses to disease 10-times faster than in matched subjects without dia-betes. Independent predictors of progression were: baseline cIMT (p < 0.001), glycosylated hemoglobin A1c (HbA1c) (p < 0.001), and age (p = 0.001)14.
The Bogulasa Heart Study correlated cIMT with classic cardiovascular risk factors in young populations where systolic blood pressure, race, age, low-density lipopro-tein cholesterol (LDL-C) and high-density lipoprolipopro-tein cholesterol (HDL-C) explained 17% of the variability of cIMT15. In Mexico, there are few studies that evaluate
cIMT in patients with type 2 diabetes. Cantú-Brito, et al. studied the prevalence of atherosclerotic lesions in 145 Mexicans over 55 years of age; in 44.1%, the cIMT was > 1 mm (normal value < 1 mm), with a sensitivity of 91.3% and a specificity of 92.7%16.
Twenty-percent of patients with diabetes have asymp-tomatic peripheral arterial illness (PAI), which may be sub-clinical and only detected through vascular imag-ing techniques17.A low ankle-arm index (AAI)has
in-dicated a risk of mortality from cerebrovascular and coronary disease of 5.9-fold and 6.6-fold, respective-ly18.In Mexico, PAI affects 19.8% of the population.
Its prevalence increases with age and it is more fre-quent in men than in women before the age of 40. An AAI ≤ 0.90 defines PAI, with a sensitivity of 95% and a specificity of 99%, compared with arteriography (current gold standard), and is associated with an increased risk of cardiovascular morbidity and mortality19. The
in-crease in the presence of an AAI ≤ 0.9 and its correlation with a greater number of atheromatous lesions in ca-rotid echography and greater cIMT has been analyzed20.
.r
e
hsi
l
b
u
p
e
ht
f
o
n
ois
si
mr
e
p
ne
tti
r
w r
oir
p
e
ht
t
u
o
hti
w
g
ni
y
p
oc
ot
o
h
p r
o
de
c
u
d
or
pe
r
e
b
ya
m
n
oit
aci
l
b
u
p s
i
ht
f
o t
ra
p
o
N
Guidelines for initiating cardio-protective treatment in patients with early-onset diabetes have not been es-tablished, unlike in late-onset diabetes patients. There-fore, this study aimed to evaluate the association of cIMT, AAI, and inflammation profile in Mexican pa-tients with early- and late-onset type 2 diabetes. This study may serve as a basis for generating new evi-dence concerning the atherogenicity of early-onset diabetes in the Mexican population. The usefulness of noninvasive complementary measurements, such as cIMT and AAI, as subclinical markers of atherosclerosis should be explored further.
MATERIAL AND METHODS
An analytical, cross-sectional study was designed. The study was approved by the Ethics Committee of the Mexican Social Security Institute (IMSS). From the pa-tients with type 2 diabetes who attended scheduled visits at the Unidad de Investigación en Epidemiología Clínica, UMAE Hospital de Especialidades Centro Médi-co Nacional Siglo XXI of IMSS, 353 were invited to participate. Inclusion criteria were: ≥ 20 years of age, either sex, with type 2 diabetes, and free of chronic or acute inflammatory disease. Exclusion criteria were: dia-betic ketoacidosis, hyperosmolar coma, secondary cause of diabetes, alcoholism or tobacco use, primary hyper-lipidemia (homozygote or heterozygote hypercholes-terolemia), chronic renal failure, acquired or non-ac-quired immunodeficiency, rheumatic or immunological disease, under topical or systemic steroids or immuno-regulators, arrhythmia or conduction disorders (second or third degree blockage, auricular fibrillation), presence of known valvulopathy or myocardiopathy, diagnosed ischemic cardiopathy, any kind of neoplasia, and failure to agree to participate or to sign an informed consent.
Patients who fulfilled the inclusion criteria were con-tacted by telephone, and those who accepted par-ticipation were evaluated for inclusion in the study. A total of 110 patients and 35 healthy IMSS workers, who volunteered to participate as controls, signed the informed consent.
Inclusion criteria for healthy controls were: fasting plas-ma glucose < 100 mg/dl, systolic blood pressure < 130 mmHg, diastolic blood pressure < 85 mmHg, total cho-lesterol < 200 mg/dl and triglycerides < 150 mg/dl. Group I included the 35 healthy volunteers (21 women
and 14 men). Group II included 77 patients that had early-onset T2DM (< 40 years of age). Group III pa-tients had late-onset T2DM (≥ 40 years of age).
In all subjects, a medical history was recorded and anthropometric measurements were taken according to the Lohman technique21; blood pressure was
re-corded and laboratory studies performed. A carotid ultrasound (US) was performed, along with US of the lower limbs. Laboratory tests included blood chemis-try, lipids profile, HbA1c, cytokines (IL-1β, IL-4, IL-6), and hs-CRP. Blood chemistry and the lipids profile were de-termined by commercial methods (Beckman); HbA1c was estimated using high-resolution liquid chroma-tography (Bio-Rad, Hercules, CA); cytokines (IL-1β, IL-4, and IL-6) were determined by the ELISA method with PeproTech (Rock Hill, NJ). The hs-CRP was mea-sured using high-sensitivity human CRP ELISA kit (Al-pha Diagnostic International, San Antonio, TX).
Ultrasound was used for automatic measurements of cIMT and was performed by a single experienced ra-diologist, who was blinded to subject group assign-ment, in the Radiodiagnostic Service of Hospital de Especialidades CMN Siglo XXI.
Both flow velocities (peak systolic velocity and end diastolic velocity) were measured. The segment of the common carotid artery, the bifurcation (carotid bulb), and internal carotid artery were the same in each survey. All exams were performed according to a pre-determined and standardized protocol with right and left sides averaged for the three angles22.
High-reso-lution US equipment (Philips HDI 5000) was used with specific software for carotid arteries and a wide-band lineal transducer (7-12-MHz). All images were photo-graphed and stored. Images were analyzed by the same radiologist with the Philips’s QLAB 4.2.1 Ad-vanced Ultrasound Quantification Program. The pe-ripheral vascular US was performed using a wide-band linear transducer of 8 MHz and calibrated sphygmo-manometer. The patient was placed in dorsal decubi-tus with at least five minutes of repose. Systolic blood pressure (SBP) was measured in the posterior tibia artery of both lower extremities and the higher value was used as the numerator for blood pressure. Like-wise, SBP was taken at the brachial artery of both upper extremities and the higher value used as de-nominator. The blood pressure value for each of the lower extremities is the result of dividing SBP of each
.r
e
hsi
l
b
u
p
e
ht
f
o
n
ois
si
mr
e
p
ne
tti
r
w r
oir
p
e
ht
t
u
o
hti
w
g
ni
y
p
oc
ot
o
h
p r
o
de
c
u
d
or
pe
r
e
b
ya
m
n
oit
aci
l
b
u
p s
i
ht
f
o t
ra
p
o
N
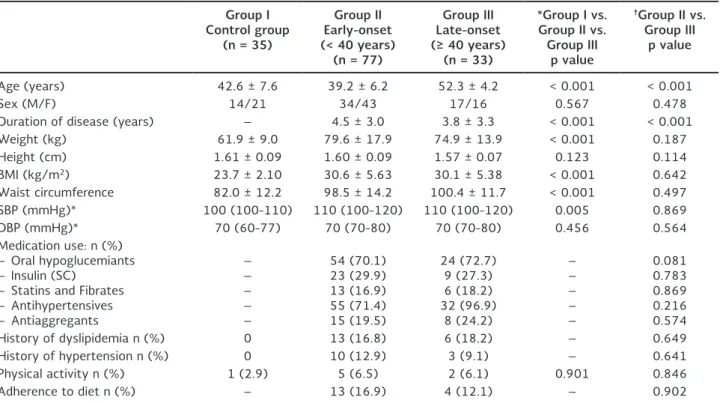
Table 1. Baseline clinical and anthropometric parameters of study subjects according to age at onset of type 2 diabetes
Group I Control group
(n = 35)
Group II Early-onset (< 40 years)
(n = 77)
Group III Late-onset (≥ 40 years)
(n = 33)
*Group I vs. Group II vs.
Group III p value
†Group II vs.
Group III p value
Age (years) 42.6 ± 7.6 39.2 ± 6.2 52.3 ± 4.2 < 0.001 < 0.001
Sex (M/F) 14/21 34/43 17/16 0.567 0.478
Duration of disease (years) – 4.5 ± 3.0 3.8 ± 3.3 < 0.001 < 0.001
Weight (kg) 61.9 ± 9.0 79.6 ± 17.9 74.9 ± 13.9 < 0.001 0.187
Height (cm) 1.61 ± 0.09 1.60 ± 0.09 1.57 ± 0.07 0.123 0.114
BMI (kg/m2) 23.7 ± 2.10 30.6 ± 5.63 30.1 ± 5.38 < 0.001 0.642
Waist circumference 82.0 ± 12.2 98.5 ± 14.2 100.4 ± 11.7 < 0.001 0.497
SBP (mmHg)* 100 (100-110) 110 (100-120) 110 (100-120) 0.005 0.869
DBP (mmHg)* 70 (60-77) 70 (70-80) 70 (70-80) 0.456 0.564
Medication use: n (%) – Oral hypoglucemiants – Insulin (SC)
– Statins and Fibrates – Antihypertensives – Antiaggregants
– – – – –
54 (70.1) 23 (29.9) 13 (16.9) 55 (71.4) 15 (19.5)
24 (72.7) 9 (27.3) 6 (18.2) 32 (96.9)
8 (24.2)
– – – – –
0.081 0.783 0.869 0.216 0.574
History of dyslipidemia n (%) 0 13 (16.8) 6 (18.2) – 0.649
History of hypertension n (%) 0 10 (12.9) 3 (9.1) – 0.641
Physical activity n (%) 1 (2.9) 5 (6.5) 2 (6.1) 0.901 0.846
Adherence to diet n (%) – 13 (16.9) 4 (12.1) – 0.902
Data represent the n (%) or mean ± SD.
*Median (interquartile range, Q25-Q75); *Kruskal-Wallis or ANOVA was used.
†Student t or Mann-Whitney U was used, each according to data distribution.
BMI: body mass index; DBP: diastolic blood pressure; SBP: systolic blood pressure; SC: subcutaneous.
lower extremity by the higher SBP of the upper ex-tremities, using the lower number for analysis. All the information was recorded in a database specially de-signed for the study.
Obesity was defined as body mass index (BMI) ≥ 30. Arterial hypertension was diagnosed according to rec-ommendations23 or if the subject was using
antihy-pertensive medication. Dyslipidemia was defined ac-cording to the third panel of the National Program of Cholesterol Education24.
Statistical Analysis
ANOVA or Kruskal-Wallis was used to compare the variables among the three groups. Student t or Mann-Whitney U compared between early- and late-onset diabetes. Spearman or Pearson correlation, as appro-priate, correlated cIMT, AAI, and flow velocities for the variables studied, and logistic regression analysis was used to identify predictors of risk. Statistical sig-nificance of p < 0.05 was determined. These analyses
were performed with the statistical package SPSS (v15, Chicago, IL).
RESULTS
A total of 353 subjects were evaluated: 198 women (56%) and 155 men (44%); the average age of par-ticipants was 46.1 ± 9.6 years and the BMI was 29.0 ± 5.7 kg/m2. Group II included 77 patients with
early-onset T2DM (before the age of 40): 43 women and 34 men 20-50 years old with disease duration of 4.5 ± 3.0 years. Group III included 33 patients with late-onset T2DM (≥ 40 years of age): 16 women and 17 men 43-60 years old with disease duration of 3.8 ± 3.3 years.
Clinical and anthropometric characteristics of all the subjects are shown in table 1.
As expected, there were differences in BMI and waist circumference, with the control subjects being slimmer and with less abdominal fat (Table 1). When comparing
.r
e
hsi
l
b
u
p
e
ht
f
o
n
ois
si
mr
e
p
ne
tti
r
w r
oir
p
e
ht
t
u
o
hti
w
g
ni
y
p
oc
ot
o
h
p r
o
de
c
u
d
or
pe
r
e
b
ya
m
n
oit
aci
l
b
u
p s
i
ht
f
o t
ra
p
o
N
BMI Normal Overweight Obese p = 0.646 p < 0.001
0.6
0.4
cIM
T
0.8 0.9
0.7
0.5
Patients with early-onset (< 40 years)
diabetes
Patients with late-onset (≥ 40 years)
diabetes Control
group
Figure. 1. Comparison of carotid intima-media thickness with body mass index in the sample population. Comparison of carotid intima-media thickness with body mass index (ANOVA was used to compare the three groups and Student t for patients with early (< 40 years) vs. late (≥ 40 years) onset of type 2 diabetes).
cIMT: carotid intima-media thickness; BMI: body mass index
the increase in cIMT with BMI, we found that being overweight led to greater cIMT in the control group and patients with early-onset diabetes, while in the late-onset group a normal weight was associated with a greater cIMT. The presence of diabetes appeared to lead to a greater cIMT (p < 0.001), although the dif-ferences between early- and late-onset were not sig-nificant (p = 0.464) (Fig. 1).
On the other hand, in the biochemical parameters, levels of glucose and HbA1c showed significant dif-ferences between the three groups (p < 0.001); they were higher in the early-onset group, although the difference between early- and late-onset diabetes was not significant. There was also a significant difference in the lipid profile between the three groups, as ex-pected, except for LDL-C (p = 0.292). However, when compared between groups II and III, these differences lost their significance. Serum markers of inflamma-tion showed significant differences when compared with the healthy control group (p < 0.001), and IL-1β, IL-4 and IL-6 maintained significance between the two groups with diabetes, showing higher concentrations in those with late-onset diabetes, although fibrinogen
(p = 0.677) and hs-CRP (p = 0.233) lost significance and were higher in the early-onset group (Table 2). Upon analyzing cIMT with the degree of metabolic control in diabetic patients according to HbA1c val-ues, a slight correlation is seen (R2 = 0.216) (Fig. 2).
When analyzing the groups according to thickness of the common carotid-intima media, we found a sig-nificant difference when comparing Groups II (0.692 ± 0.154 mm) and III (0.715 ± 0.130 mm) against Group I (0.566 ± 0.172 mm) (p < 0.001), but not when comparing early- and late-onset groups (p = 0.464) (Table 3).
The AAI was greater in Group I (1.19 ± 0.08) com-pared with Group II (1.08 ± 0.11) and Group III (1.10 ± 0.11) (p < 0.001), but not when comparing early- and late-onset diabetes (p = 0.589). There were no signifi-cant differences in flow velocities between groups. The presence of atheroma plaque was documented in the carotid arteries of 10.4% of patients from Group II and 6.1% of Group III (p = 0.469) (Table 3).
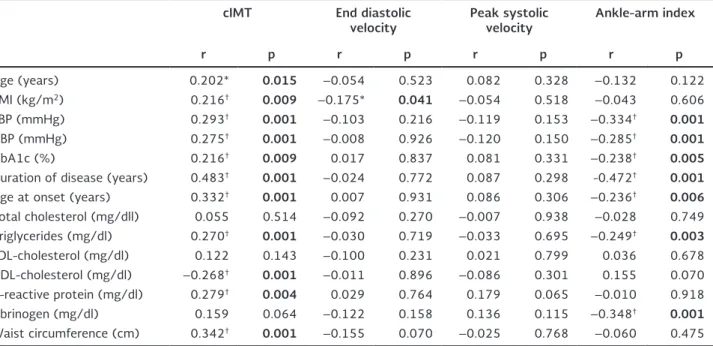
Several variables correlated with cIMT and AAI, but not with flow velocities, including systolic and diastolic blood pressure, HbA1c, diabetes duration, age at on-set, and triglycerides. Age, BMI, HDL-C, CRP, and waist circumference significantly correlated with cIMT but not AAI, while the reverse was true for fibrinogen. The only variable that correlated with flow velocity was BMI with end diastolic velocity (p = 0.041) (Table 4).
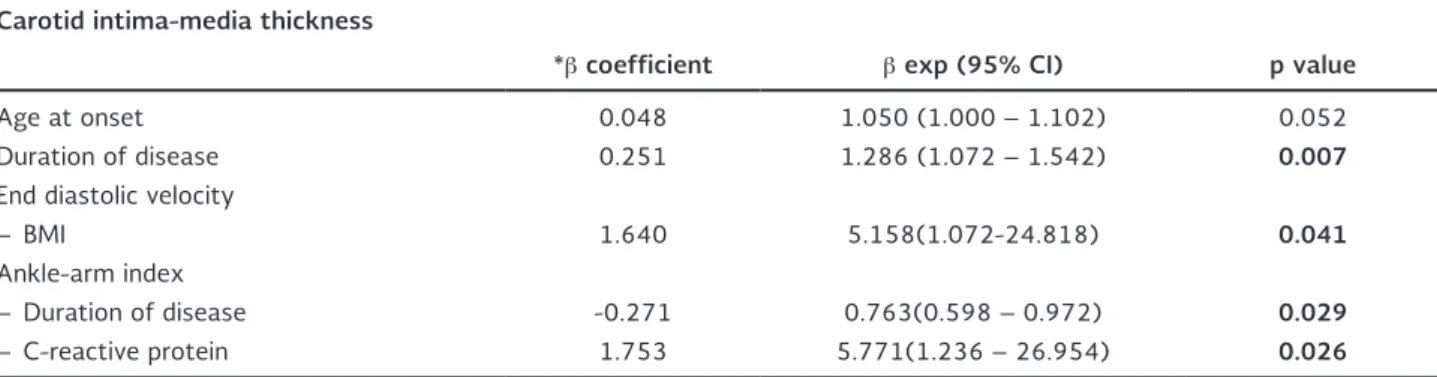
Logistic regression analysis was performed using the upper 75th percentile of cIMT (> 0.600 mm) and AAI (< 1.19) found in the study group. After adjusting for age, BMI, blood pressure, waist circumference, HDL-C, LDL-C, triglycerides, IL-1β, IL-4, IL-6, HbA1c, fibrinogen, high-density C-reactive protein, with cIMT, age at on-set and duration remained independently significant (beta 0.048 with β exponent of 1.050 [p = 0.052; 95% CI: 1.000-1.102] and beta 0.251 with β exponent of 1.286 [p = 0.007; 95% CI: 1.072-1.542]), respective-ly. However, for AAI, disease duration and C-reactive protein were the variables that remained significant (beta –0.271 with β exponent of 0.763 [p = 0.029; 95% CI: 0.598-0.972] and beta 1.753 with β expo-nent of 5.771 [p = 0.026; 95% CI: 1.236-26.954]), respectively. Similarly, BMI proved to be a risk predictor for end diastolic velocity (beta 1.640 with β exponent of 5.158; p = 0.041; 95% CI: 1.072-24.818) (Table 5).
.r
e
hsi
l
b
u
p
e
ht
f
o
n
ois
si
mr
e
p
ne
tti
r
w r
oir
p
e
ht
t
u
o
hti
w
g
ni
y
p
oc
ot
o
h
p r
o
de
c
u
d
or
pe
r
e
b
ya
m
n
oit
aci
l
b
u
p s
i
ht
f
o t
ra
p
o
N
2.0
1.5
1.0
0.5
0.0
cIM
T (mm)
HbA1c (%)
12.0 16.0 20.0
8.0 4.0
R2 = 0.216
p = 0.009 Table 2. Biochemical characteristics and inflammation markers of the study population
Group I Control group
(n = 35)
Group II Early-onset (< 40 years)
(n = 77)
Group III Late-onset (≥ 40 years)
(n = 33)
Group I vs. Group II vs. Group III
p value
Group II vs. Group III
p value
Glucose (mg/dl)† 88.0 (81-95) 152 (113.5-269) 134 (106.5-220) < 0.001 0.147
Total cholesterol (mg/dl)* 183.0 ± 18.2 203.4 ± 53.6 206.3 ± 39.5 0.048 0.780
Triglycerides (mg/dl)† 99 (74-125) 189 (142-338) 214 (155-292.5) < 0.001 0.914
HDL-C (mg/dl)* 60.6 ± 14.02 38.7 ± 10.81 41.7 ± 12.03 < 0.001 0.206
LDL-C (mg/dl)* 102.1 ± 21.85 108.3 ± 41.94 115.8 ± 32.79 0.292 0.363
HbA1c (%)† 5.7 (5.4-5.9) 7.4 (6.1-10.4) 7.0 (6.3-9.0) < 0.001 0.667
Interleukin-6 (pg/ml)† 172.3
(31.2-550.7) (132.6-612.5)549.7 (549.7-625.1)568.5 < 0.001 0.030
Interleukin-4 (pg/ml)† 7.9
(6.8-146.2) (1.9-321.6)159.3 (159.3-318.6)212.0 < 0.001 0.026
Interleukin-1β (pg/ml)† 46.4
(28.0-117.3) (15.7-502.8)265.0 (393.5-509.3)451.4 < 0.001 0.010
Fibrinogen (mg/dl)* 309.5 ± 60.6 373.2 ± 75.0 366.5 ± 78.2 < 0.001 0.677
Ultrasensitive C-reactive
protein (mg/dl)† 0.50 (0.30-1.97) 3.03 (1.51-6.53) 2.33 (0.73-5.37)
< 0.001 0.233
Data represent n (%), or means ± SD; Median (interquartile range, Q25-Q75) according to data distribution. ANOVA or Kruskal-Wallis was used to compare the three groups.
*Student t.
†Mann-Whitney U to compare groups II and III.
HDL-C: high-density lipoprotein cholesterol; LDL-C: low-density lipoprotein cholesterol; HbA1c: glycosylated hemoglobin A1c.
Figure. 2. Correlation of carotid intima-media thickness with level of glycosylated hemoglobin A1c using Spearman Rho correlation. cIMT: carotid intima-media thickness; HbA1c: glycosylated hemoglobin A1c.
.r
e
hsi
l
b
u
p
e
ht
f
o
n
ois
si
mr
e
p
ne
tti
r
w r
oir
p
e
ht
t
u
o
hti
w
g
ni
y
p
oc
ot
o
h
p r
o
de
c
u
d
or
pe
r
e
b
ya
m
n
oit
aci
l
b
u
p s
i
ht
f
o t
ra
p
o
N
Table 3. Parameters of vascular ultrasound in subjects according to age at onset of type 2 diabetes mellitus
Group I Control group
(n = 35)
Group II Early-onset (< 40 years)
(n = 77)
Group III Late-onset (≥ 40 years)
(n = 33)
Group I vs. Group II vs. Group III
p value
Group II vs. Group III
p value
cIMT (mm) 0.566 ± 0.172 0.692 ± 0.154 0.715 ± 0.130 < 0.001* 0.464‡
Mean AAI 1.19 ± 0.08 1.08 ± 0.11 1.10 ± 0.11 < 0.001* 0.589‡
Peak systolic velocity 74.8 ± 17.4
(61.6-84.5) 74.2 ± 12.3(66.5-82.1) 75.4 ± 11.1(65.8-83.3) 0.907
† 0.625‡
Atheroma plaque n (%) – 8 (10.4%) 2 (6.1%) – 0.469§
Data represent the mean ± SD or number (%). *ANOVA.
†Kruskal-Wallis was used to compare the three groups.
‡Student t.
§Xi2.
Xi2 o Student t were used to compare 2 groups, according to distribution.
cIMT: carotid intima-media thickness; AAI: ankle-arm index.
Table 4. Correlation coefficient between carotid intima-media thickness, peak systolic and end diastolic velocities and related variables
cIMT End diastolic
velocity Peak systolic velocity Ankle-arm index
r p r p r p r p
Age (years) 0.202* 0.015 –0.054 0.523 0.082 0.328 –0.132 0.122
BMI (kg/m2) 0.216† 0.009 –0.175* 0.041 –0.054 0.518 –0.043 0.606
SBP (mmHg) 0.293† 0.001 –0.103 0.216 –0.119 0.153 –0.334† 0.001
DBP (mmHg) 0.275† 0.001 –0.008 0.926 –0.120 0.150 –0.285† 0.001
HbA1c (%) 0.216† 0.009 0.017 0.837 0.081 0.331 –0.238† 0.005
Duration of disease (years) 0.483† 0.001 –0.024 0.772 0.087 0.298 -0.472† 0.001
Age at onset (years) 0.332† 0.001 0.007 0.931 0.086 0.306 –0.236† 0.006
Total cholesterol (mg/dll) 0.055 0.514 –0.092 0.270 –0.007 0.938 –0.028 0.749
Triglycerides (mg/dl) 0.270† 0.001 –0.030 0.719 –0.033 0.695 –0.249† 0.003
LDL-cholesterol (mg/dl) 0.122 0.143 –0.100 0.231 0.021 0.799 0.036 0.678
HDL-cholesterol (mg/dl) –0.268† 0.001 –0.011 0.896 –0.086 0.301 0.155 0.070
C-reactive protein (mg/dl) 0.279† 0.004 0.029 0.764 0.179 0.065 –0.010 0.918
Fibrinogen (mg/dl) 0.159 0.064 –0.122 0.158 0.136 0.115 –0.348† 0.001
Waist circumference (cm) 0.342† 0.001 –0.155 0.070 –0.025 0.768 –0.060 0.475
Spearman or Pearson (as appropriate) correlation coefficient: *Significant correlation: < 0.05 (bilateral).
†Significant correlation: < 0.01 (bilateral).
BMI: body mass index; SBP: systolic blood pressure; DBP: diastolic blood pressure; LDL: low density lipids; HDL: high density lipids; HbA1c: glycosylated hemoglobin A1c.
DISCUSSION
This study confirms that there are important differ-ences between early- and late-onset type 2 diabetes, and between cIMT and AAI. The AAI findings highlight the importance of measuring hs-CRP. The most re-cent evidence suggests that early-onset T2DM is a
phenotype of a more aggressive disease than late onset, with greater development of cardiovascular complications5,25.
When analyzing the metabolic state in the groups, we found lower levels of total cholesterol, triglycerides, and HDL-C and LDL-C to be more prevalent in patients
.r
e
hsi
l
b
u
p
e
ht
f
o
n
ois
si
mr
e
p
ne
tti
r
w r
oir
p
e
ht
t
u
o
hti
w
g
ni
y
p
oc
ot
o
h
p r
o
de
c
u
d
or
pe
r
e
b
ya
m
n
oit
aci
l
b
u
p s
i
ht
f
o t
ra
p
o
N
Table 5. Logistic regression analysis for the association between carotid intima-media thickness, flow velocity, ankle-arm index and related variables
Carotid intima-media thickness
*β coefficient β exp (95% CI) p value
Age at onset 0.048 1.050 (1.000 – 1.102) 0.052
Duration of disease 0.251 1.286 (1.072 – 1.542) 0.007
End diastolic velocity
– BMI 1.640 5.158(1.072-24.818) 0.041
Ankle-arm index
– Duration of disease -0.271 0.763(0.598 – 0.972) 0.029
– C-reactive protein 1.753 5.771(1.236 – 26.954) 0.026
*The β coefficient of carotid intima-media thickness (> 0.600 mm) and ankle-arm index (< 1.19) was calculated for the highest quartile and adjusted for each variable: age, body mass index, systolic blood pressure, diastolic blood pressure, waist circumference, high-density lipid cholesterol, low-density lipid cholesterol, triglycerides, interleukin 1-β, interleukin-4, and interleukin-6, glycosylated hemoglobin A1c, fibrinogen, high-density C-reactive protein.
with early-onset T2DM compared with the late-onset group, all of which were abnormal but not significant. This confirms the observations of Haffner, et al. and stresses the presence of slightly elevated concentra-tions of LDL-C, or even normal levels26.
In theory, the presence of a higher pro-atherogenic lipid profile in patients with early-onset T2DM should be ac-companied by a rise in serum inflammation markers such as hs-CRP, VCAM-1, ICAM-1, SP-selectin and SE-selectin, as referred to by Tousoulis, et al.27.
How-ever, in our study, while it is true that we found sig-nificant differences in interleukins, hs-CRP, and fibrin-ogen when comparing the three groups, we were not able to document differences between early-onset and late-onset T2DM, probably because group III included patients with less time with T2DM.
The American Heart Association (AHA) has recom-mended the use of carotid echocardiography in selected patients with intermediate global risk28. Large
prospec-tive studies in individuals have demonstrated conclusive-ly that cIMT is a risk factor independent of cardiac coronary disease or stroke1,29,30. Our work is one of the
first to use the quantification of cIMT and AAI in pa-tients with T2DM under 40 years of age, considering that by age alone they would be considered at low risk.
The study determined the mean cIMT of the posterior wall of the common carotid in healthy subjects in our population (0.566 mm), using a value within the range of 0.25-1.5 mm referred to in the Cardiovascular
Health Study, as a group at low risk of developing infarction or ictus (1.1%/year)31,32. In our study,
pa-tients with T2DM showed higher mean cIMT values compared with the control group, but without differ-ences between Groups II and III (p = 0.464).
When we analyzed atherosclerosis plaque at the ca-rotid level, almost twice the number of the patients with early-onset T2DM had atheroma plaque com-pared with the late-onset group (10.4 vs. 6.1%, re-spectively). These percentages are lower than that found by other authors, including Salonen and Salonen, who found 23.3% in asymptomatic individuals with various cardiovascular risk factors33.
Carotid intima-media thickness has been associated with age, SBP, presence of diabetes, and LDL-C concen-tration, among other factors. In individuals < 45 years of age, cIMT has been related with six risk factors for cardiovascular disease30. The importance of the
inde-pendent risk factor for developing atherosclerosis as manifested by increased cIMT has been confirmed34.
But the increase in cIMT in our study was only statisti-cally associated with the increase in SBP, independent of lipid levels, which suggests that in addition to endo-thelial damage, there is another mechanism involved in the accumulation of lipids on the arterial wall35,36.
On the other hand, atherosclerosis is an inflammatory disease. Numerous epidemiological studies have dem-onstrated that hs-CRP is an inflammatory marker and is a predictor of future cardiovascular events in both
.r
e
hsi
l
b
u
p
e
ht
f
o
n
ois
si
mr
e
p
ne
tti
r
w r
oir
p
e
ht
t
u
o
hti
w
g
ni
y
p
oc
ot
o
h
p r
o
de
c
u
d
or
pe
r
e
b
ya
m
n
oit
aci
l
b
u
p s
i
ht
f
o t
ra
p
o
N
men and women8,9. Our results agree with the
litera-ture, documenting a linear correlation between the number of risk factors and an increase in cIMT in the three groups, although without statistical significance between groups II and III. In this study, cIMT was also associated with the direct increase of hs-CRP (subclin-ical inflammation), suggesting an increase in athero-sclerosis risk. The group of patients with early-onset T2DM had concentrations of 3.03 mg/dl compared with the late-onset group with 2.33 mg/dl, which con-firms the usefulness of this marker to better catego-rize the risk of cardiovascular events in each individual, mainly in subjects with intermediate risk, as suggest-ed by the AHA28. No significant differences were found
between the two groups, probably due to the duration of the disease.
Regarding the AAI, its usefulness is accepted for eval-uating subclinical peripheral arterial disease. It has been shown to be an important predictor of vascular disease in other areas, so that an AAI ≤ 0.9 or > 1.4 is associated with greater mortality from cardiopathic ischemia, and, to a lesser degree, from cerebrovascular disease20,37.
In regards to hs-CRP, a relationship was seen with the values obtained for AAI in logistic regression analysis, showing more than five-times the risk of AAI ≤ 0.9. The importance of duration of disease in our study is observed both for cIMT and AAI, showing an inverse association with AAI and a positive one with the in-crease in cIMT. These results are similar to those stated by other authors20,37. It is also important to note that
obesity reduces vasodilation reserve and vascular wall compliance38.
There are several limitations to this study. One is the small sample size. As noted, more than half of the patients considered did not meet the inclusion crite-ria. Another is the lack of follow-up, which did not allow us to see future development of cardiovascular complications as indicated by abnormal cIMT or AAI values. The same is true of atheromatous lesions. In addition, the short time with diabetes of the sample did not allow us to observe progression of these com-plications. The designation of early- and late-onset was based on the time of detection of the disease and could not consider the time with diabetes prior to that point. This may explain the negative association of disease duration with abnormal AAI.
There are differences between early- and late-onset type 2 diabetes in both cIMT and AAI. The IL-1β, IL-4 and IL-6 concentrations were significant between the two groups with diabetes, showing higher concentra-tions in those with late-onset diabetes. A cIMT above the 75th percentile significantly associated with age at
diag-nosis and duration of the disease. An increase in cIMT and AAI depended in great measure on the duration of T2DM. The cIMT was also affected by the age at onset of the disease, while AAI associated with hs-CRP, indicat-ing a fivefold risk of abnormal AAI with elevated CRP, a finding which appears to agree with O’Hare, et al.37.
In conclusion, our findings suggest that cIMT and AAI associate with inflammation markers and could be included in the evaluation of all patients, according to disease onset and duration. There are important dif-ferences in interleukin concentrations between early- and late-onset T2DM. Additionally, measurement of hs-CRP is suggested in patients with abnormal AAI.
ACKNOWLEDGEMENTS
The authors would like to thank Ms. Susan Drier for helping in the preparation of the manuscript, and Ricardo Saldaña Espinoza for his kind assistance with data analysis.
This study was supported by grant SALUD 87852 from the Consejo Nacional de Ciencia y Tecnología (CONACyT), FIS/ IMSS/PROT/640.
REFERENCES
1. Juutilainen A, Lehto S, Rönnemaa T, Pyörälä K, Laakso M. Type 2 diabetes as a “Coronary Heart Disease Equivalent”. An 18-year prospective population-based study in Finnish subjects. Diabetes Care. 2005;28:2901-7.
2. Villalpando S, Shamah-Levy T, Rojas R, Aguilar-Salinas CA. Trends for type 2 diabetes and other cardiovascular risk factors in Mexico from 1993-2006. Salud Pública Mex. 2010;52(Suppl 1):S72-9.
3. Hernández-Ávila M, Gutiérrez JP, Reynoso-Noverón N. [Diabetes mellitus in Mexico. Status of the epidemic]. Salud Publica Mex. 2013;55(Suppl 2):S129-36.
4. Gungor N, Bacha F, Saad R, Janosky J, Arslanian S. Youth type 2 diabetes: Insulin resistance, beta-cell failure or both? Diabetes Care. 2005;28:638-44.
5. Hillier TA, Pedula KL. Characteristics of an adult population with newly diagnosed type 2 diabetes: The relation of obesity and age of onset. Diabetes Care. 2001;24:1522-7.
6. Gungor N, Arslanian S. Progressive beta cell failure in type 2 diabetes mellitus of youth. J Pediatr. 2004;144:656-9. 7. Becker A, Bos G, de Vegt F, et al. Cardiovascular events in type
2 diabetes: Comparison with nondiabetic individuals without and with prior cardiovascular disease. Eur Heart J. 2003; 24:1406-13.
8. Rifai N, Ballantyne CH, Cushman M, Levy D, Myers GL. Point: High-sensitivity C-reactive protein and cardiac C-reactive protein assays: Is there a need to differentiate? Clin Chem. 2006;52:1254-6.
.r
e
hsi
l
b
u
p
e
ht
f
o
n
ois
si
mr
e
p
ne
tti
r
w r
oir
p
e
ht
t
u
o
hti
w
g
ni
y
p
oc
ot
o
h
p r
o
de
c
u
d
or
pe
r
e
b
ya
m
n
oit
aci
l
b
u
p s
i
ht
f
o t
ra
p
o
N
9. Sabatine MS, Morrow DA, Jablonski KA, et al. Prognostic sig-nificance of the Centers for Disease Control/American Heart Association high-sensitivity C-reactive protein cut points for cardiovascular and other outcomes in patients with stable coro-nary artery disease. Circulation. 2007;115:1528-36.
10. Pradhan AD, Manson JE, Rifai N, Buring JE, Ridker PM. C-reactive protein, interleukin 6, and the risk of developing type 2 diabetes mellitus. JAMA. 2001;286:327-34.
11. Kablack-Ziembicka A, Przewlocki T, Tracz W, et al. Diagnostic value of carotid intima-media thickness in indicating multi-level atherosclerosis. Atherosclerosis. 2007;193:395-400.
12. Grant EG, Benson CB, Moneta GL, et al. Carotid artery stenosis: Gray-scale and Doppler US diagnosis-Society of Radiologists in Ultrasound Consensus Conference. Radiology. 2003;229:340-6. 13. Bots M, Hoes A, Koudstaal P, Hofman A, Grobbee DE. Common carotid intima-media thickness and risk of stroke and myocardial infarction. (The Rotterdam Study). Circulation. 1997;96:1432-7. 14. Yamasaki Y, Kodama M, Nishizawa H, et al. Carotid intima-media thickness in Japanese type 2 diabetic subjects: Predictors of progression and relationship with incident coronary heart disease. Diabetes Care. 2000;23:1310-5.
15. Freedman DS, Srinivasan SR, Cresanta JL, Webber LS, Berenson GS. Cardiovascular risk factors from birth to 7 years of age: The Bogalusa Heart Study. Serum lipids and lipoproteins. Pediatrics. 1987;80:789-96.
16. Cantú B, Rodríguez S, Reynoso M, Marmolejo-Henderson R, Bar-inagarrementeria-Aldatz F. [Cardiovascular risk factors and ca-rotid atherosclerosis detected by ultrasonography]. Salud Pu-blica Mex. 1999;41:452-9.
17. Bashir R, Cooper CJ. Evaluation and medical treatment of pe-ripheral arterial disease. Curr Opin Cardiol. 2003;18:436-43. 18. Criqui MH, Langer RD, Fronek A, et al. Mortality over a period
of 10 years in patients with peripheral arterial disease. N Engl J Med. 1992;326:381-6.
19. Contreras EJ, Rodríguez-Moctezuma JR, López-Carmona JM, Mun-guía-Miranda C, Aranda-Moreno C, Peralta-Pedrero ML. [Differ-ences of risk factors for peripheral arterial disease in type 2 dia-betes patients in urban and suburban populations]. Rev Med Inst Mex Seguro Soc 2007; 45:117-22.
20. Manzano L, García-Díaz DJ, Gómez-Cerezo J, et al. [Clinical value of the ankle-brachial index in patients at risk of cardio-vascular disease but without known atherothrombotic disease: VITAMIN study]. Rev Esp Cardiol. 2006;59:662-70.
21. Lohman TG, Roche AF, Martorell R. Anthropometric standardization reference manual. Champaign, IL: Human Kinetics Books, 1998. 22. Stein JH, Korcarz CE, Hurst RT, et al. The American Society of
Echocardiography Carotid Intima-Media Thickness Task Force. Use of carotid ultrasound to identify subclinical vascular disease and evaluate cardiovascular disease risk: a consensus statement from the American Society of Echocardiography Carotid Intima-Media Thickness Task Force. Endorsed by the Society for Vas-cular Medicine. J Am Soc Echocardiogr. 2008;21:93-111. 23. Mancia G, Fagard R, Narkiewicz K, et al. 2013 ESH/ESC Practice
Guidelines for the Management of Arterial Hypertension. Blood Press. 2014;23:3-16.
24. National Cholesterol Education Program (NCEP) Expert Panel on Detection, Evaluation, and Treatment of High Blood Cholesterol in Adults (Adult Treatment Panel III). Third Report of the Na-tional Cholesterol Education Program (NCEP) Expert Panel on Detection, Evaluation, and Treatment of High Blood Cholesterol in Adults (Adult Treatment Panel III) final report. Circulation. 2002;106:3143-421.
25. Hillier T, Pedula K. Complications in young adults with early-onset type 2 diabetes. Diabetes Care. 2003;26:2999-3005. 26. Haffner SM, Lehto S, Rönnemaa T, Pyörälä K, Laakso M.
Mortal-ity from coronary heart disease in subjects with type 2 diabetes and in nondiabetic subjects with and without prior myocardial infarction. N Engl J Med. 1998;339:229-34.
27. Tousoulis D, Papageorgiou N, Androulakis E, et al. Diabetes melli-tus-associated vascular impairment: Novel circulating biomarkers and therapeutic approaches. J Am Coll Cardiol. 2013;62:667-76. 28. Smith SC, Allen J, Blair SN, et al. National Heart, Lung, and Blood
Institute. AHA/ACC guidelines for secondary prevention for pa-tients with coronary and other atherosclerotic vascular disease: 2006 update. Endorsed by the National Heart, Lung, and Blood Institute. J Am Coll Cardiol. 2006;47:2130-9.
29. Yuk HB, Park HW, Jung IJ, et al. Analysis of carotid ultrasound find-ings on cardiovascular events in patients with coronary artery dis-ease during seven-year follow-up. Korean Circ J. 2015;45:28-37. 30. Eikendal AL, Groenewegen KA, Anderson TJ, et al. Common
carotid intima-media thickness relates to cardiovascular events in adults aged <45 years. Hypertension. 2015;65:707-13. 31. O’Leary DH, Polak JF, Wolfson Jr SK, et al. Use of sonography
to evaluate carotid atherosclerosis in the elderly: the Cardiovas-cular Health Study. Stroke. 1991;22:1155-63.
32. O’Leary DH, Polak JF, Kronmal RA, et al. Thickening of the ca-rotid wall. A marker for atherosclerosis in the elderly? Cardio-vascular Health Study Collaborative Research Group. Stroke. 1996;27:224-31.
33. Salonen JT, Salonen R. Ultrasonographically assessed carotid morphology and the risk of coronary heart disease. Arterioscler Thromb. 1991;11:1245-9.
34. Lee EJ, Kim HJ, Bae JM, et al. Relevance of common carotid inti-ma-media thickness and carotid plaque as risk factors for isch-emic stroke in patients with type 2 diabetes mellitus. Am J Neuroradiol. 2007;28:916-9.
35. Lakka TA, Salonen R, Kaplan GA, Salonen JT. Blood pressure and the progression of carotid atherosclerosis in middle-aged men. Hypertension. 1999;34:51-6.
36. Olsen MH, Fossum E, Hjerkinn E, et al. Relative influence of in-sulin resistance versus blood pressure on vascular changes in longstanding hypertension. ICARUS, a LIFE sub study. Insulin Carotids US Scandinavia. J Hypertens. 2000;18:75-81. 37. O’Hare AM, Katz R, Shlipak MG, Cushman M, Newman AB.
Mor-tality and cardiovascular risk across the ankle-arm index spec-trum: Results from the Cardiovascular Health Study. Circulation. 2006;113:388-93.
38: DeVallance E, Fournier SB, Donley DA, et al. Is obesity predictive of cardiovascular dysfunction independent of cardiovascular risk factors? Int J Obes. 2015;39:244-53.
.r
e
hsi
l
b
u
p
e
ht
f
o
n
ois
si
mr
e
p
ne
tti
r
w r
oir
p
e
ht
t
u
o
hti
w
g
ni
y
p
oc
ot
o
h
p r
o
de
c
u
d
or
pe
r
e
b
ya
m
n
oit
aci
l
b
u
p s
i
ht
f
o t
ra
p
o
N