GPS
Investigation
A GLOBE
®
GPS Investigation
at a Glance
Protocol
Onetime Only Measurements:
Time of initial recording and averaged latitude, longitude, and elevation for the following Study Sites:
Atmosphere, Hydrology, Land Cover, Soil Characterization, Soil Moisture, and your school which is the center of your GLOBE Study Site.
Suggested Sequence of GPS Investigation
• Read the Protocol to learn precisely what is measured and how.
• Copy and distribute the Field Guides to your students.
• Prior to using the GPS receiver, identify all of your GLOBE sites that require latitude, longitude, and elevation measurements.
• Have the students conduct some test measurements near your school, following the GPS Field Guide found in the Protocol section. When you and your students are comfortable with the operation of the receiver go to your GLOBE study sites and, following the GPS Field Guide, take the position measurements at each site. Report your results back to GLOBE as soon as possible upon completing the measurements and calculations.
• If one or more of your sites are obscured by tree canopy, follow the Offset GPS Activity Field Guide to determine your site’s position.
• If your students are experiencing difficulties with performing the measurements or are interested in further activities related to global positioning systems, refer to and conduct one or more of accompanying activities (Relative and Absolute Directions
Table of Contents
Introduction
Overview ...Introduction 1 Satellites ...Introduction 1 GPS Satellites ...Introduction 1
Protocols
GPS Measurement Protocol GPS Protocol Field Guide Offset GPS Protocol Field Guide
Learning Activities
What is the Right Answer?* Relative and Absolute Directions
Appendix
Site Location Data Sheet ...Appendix 2 GPS Investigation Data Sheet ...Appendix 3 Offset Data Sheet ...Appendix 4 Glossary ...Appendix 5
Pr
otocols
L
earning A
ctivities
A
ppendix
W
elcome
Intr
oduction
Introduction
Overview
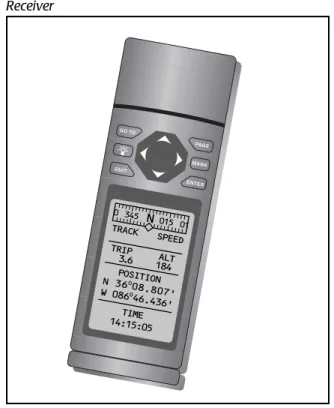
A Global Positioning System (GPS) receiver is a hand-held device that receives data directly from overhead satellites. Using a GPS receiver, students can determine their location, as measured in latitude and longitude, almost anywhere in the
world to an accuracy of ± 10 – 15 meters. If they
average several measurements, typically they can
determine their location to within ± 10 meters or
less. Thus, students can determine the location of their GLOBE sites with sufficient accuracy to identify their individual pixel (30 m X 30 m) in Landsat images.
Yes, students can use satellite data. Although it was originally designed for military use, GPS is now used primarily in civilian applications. As a part of GLOBE, students will determine the latitude, longitude, and elevation of their school as well as of their GLOBE study sites. This information is critical for making GLOBE data useful for students and scientists around the world. The visualization of student data as GLOBE maps would not be possible if the latitude and longitude of each site where students collect their data were not available.
Satellites
An object in orbit around a larger body is called a satellite. When the Galileo spacecraft reached Jupiter and slowed down to enter into an orbit around the planet, it became a satellite of Jupiter. When we launch a satellite into orbit around Earth, it becomes an artificial satellite of Earth just as the moon is a natural satellite of Earth. These artificial satellites in Earth’s orbit perform a variety of tasks including: long-distance telephone, television, and data communication, weather and natural-resource observations, military surveillance, and basic science measurements.
Our moon is 384,500 km from Earth, and it takes about one month to complete one orbit. Because of fuel limitations or a desire to perform close
observations, space shuttles and some observation satellites are only a few hundred kilometers above Earth. These Low-Earth-Orbit satellites take a minimum of 90 minutes to complete one orbit. Communications satellites are in orbits 35,792 km above Earth. At this altitude, these satellites take exactly one day to circle Earth. This special orbit is called Geosynchronous Orbit. A satellite in geosynchronous orbit always appears to be at the same place in the sky to a terrestrial observer. Thus, an antenna pointed at a geosynchronous satellite need not move. Compare this to a space shuttle which may pass from horizon to horizon in minutes or our moon which may take a month to move across the sky.
GPS Satellites
The Global Positioning System consists of a series of satellites, ground control stations, and users with GPS receivers. See Figure GPS-I-1. These satellites are unmanned and are launched by expendable rockets that place them into orbit. There are 28 GPS satellites in orbit 20,200 km above Earth’s surface. At this altitude, the satellites take about 12 hours to complete one orbit. The satellites are spaced in their orbits so that at least four are always in view of a terrestrial observer at any point on Earth. A ground-based system of tracking stations monitor the orbits of the satellites
to an accuracy of ± 1 m, and encodes the satellite’s
location, along with the satellite-generated time signal, into the unique identification code transmitted by each satellite. The satellites transmit encoded signals approximately every 15 seconds. When received by a hand-held GPS unit, the data allow the calculation of the latitude, longitude and elevation (or altitude) of the receiver. The radio signals travel in a straight line from the satellite to the GPS receiver passing through clouds, light tree canopies, glass, and plastic, but not through solid structures such as buildings and mountains. When operating, the GPS unit is able to identify each satellite as they
Figure GPS-I-1: A Global Positioning System Satellite
come into view, and evaluate the quality of the incoming signals. Modern GPS units may receive signals from up to 12 satellites at the same time. A minimum of three signals is required to give the latitude and longitude, while reception of a minimum of four signals is necessary to calculate the altitude. Reception of a larger number of signals produces a more accurate result.
Students should learn the basics of GPS.
Obtain a GPS receiver from GLOBE or another source.
Practice making GPS measurements near the school.
Make the GPS measurements at the sites specified.
Submit your GPS data to GLOBE.
Return the GPS receiver.
Learning A
ctivities
A
ppendix
W
elcome
Intr
oduction
Pr
otocols
GPS Measurement Protocol
Purpose
To determine the latitude, longitude, and elevation of your school and of all your GLOBE sites
Overview
The GPS receiver will be used to determine the latitude, longitude and elevation of your school or of your GLOBE sites.
Student Outcomes
Science Concepts
Earth and Space Sciences
Earth materials have different physical properties (magnetism).
Physical Science
Position of an object can be described by locating it relative to another object. Materials have measurable properties (magnetism).
Magnets attract and repel each other.
Geography
Tools and technologies have distinct characteristics and capabilities. Use appropriate geographic tools. Latitude and longitude may be displayed on maps.
Scientific Inquiry Abilities
Using a GPS receiver to determine latitude and longitude
Using a compass to determine true north and south
Identify answerable questions. Design and conduct scientific
investigations.
Use appropriate mathematics to analyze data.
Time
15 minutes to 60 minutes per site
Level
AllFrequency
Once per siteMaterials and Tools
GPS receiverMagnetic compass Tape measure Pencil or pen
GPS Protocol Data Sheet Offset GPS Work Sheet
Preparation
Determine locations to be visited. Bring GPS unit, data sheets, and pen or pencil to field sites. Identify sites where GPS location measurement is not possible because the signal is blocked. For there sites, compass, measuring tape, and
Offset GPS Data Work Sheet should be also
brought.
Figure GPS-P-1: Diagram of one example of a GPS Receiver
GPS Protocol –
Introduction
Have you ever considered how you describe your location, or how to give directions to a place? When you tell a friend where to meet, you will most likely give the location relative to a place or object you’re both familiar with. For example “let’s meet outside the main entrance of our school”. In this case you will both go to the same location because you know the local environment of your school – it is a system that is referenced to your own experience. However, should you plan to meet in a new location unfamiliar to both of you, such as a nearby city, you will need to find a more general framework of reference. For example you could use road systems or topographic references such as rivers or hills. If you want to locate all GLOBE schools and their study sites, you would have to resort to a more universal reference system.
The geographic locating system used is a set of lines called latitude and longitude that are mapped, like a grid, onto the spherical surface of the Earth. By convention, zero degrees longitude passes through Greenwich England and zero degrees latitude is the Equator. Locations are identified as
being east and west of zero longitude and north and south of zero latitude. At any location it is also possible to further specify ones position by measuring the elevation, or height of the location above or below the average sea level. By reporting their latitude, longitude and elevation each GLOBE school may be individually located.
For you, the GLOBE student, the hand-held GPS receiver provides a simple and accurate way to measure your latitude, longitude and, when corrected, elevation. These instruments are sufficiently accurate to distinguish the two ends of a classroom or to determine your location well within an area the size of a single pixel (30 m X 30 m) of a LandSat image. Besides the location, GPS instruments also provide the time, as well as additional measurements such as the speed of travel between two points, and distance and direction between any two locations. Insights into the GPS system as a whole, provide an understanding of the measurements it produces and how a simple measurement relies on a sophisticated science and technology infrastructure.
Offset
What if you cannot make a GPS latitude and longitude measurement at a study or sample site because the GPS satellite signals are obscured by thick foliage or a building? See Figure GPS-P-2. You can move from your site to a nearby location where the GPS receiver can receive the satellite signals. This is known as an offset location. You can then determine the location of your desired site by measuring the compass direction and distance between the offset location and your site. In general, you need to use trigonometric skills to determine the desired location. However, if you restrict yourselves to moving directly North or South from your site, you can determine the latitude and longitude of your site using only arithmetic and some knowledge about our planet.
Learning A
ctivities
A
ppendix
W
elcome
Intr
oduction
Pr
otocols
km/0.0001 degrees or approximately 11 meters/ 0.0001 degrees). GPS receivers typically present locations to the nearest 0.0001 degrees, which is approximately 11 meters of latitude on Earth. Knowing the distance north or south between your site and an offset location allows you to determine the difference in their latitudes.
Elevation
All measurements of elevation are made using mean sea level as a point of reference. For example, Mount Everest has an elevation of 8,850 meters above mean sea level. Since sea level fluctuates daily with tides, the mean sea level surface is used as the reference. The reference surface that passes through the global mean sea level and is shaped by Earth’s gravitational field is known as the geoid. This surface is not smooth because of the irregular distribution of Earth’s gravity field.
GPS receivers must also use a reference for determining elevation. Unfortunately, the geoid is very complicated and too large to fit in the internal memory of most GPS receivers. Instead, they contain a simplified shape for a smooth surface known as the reference ellipsoid. All GPS elevation measurements are made against the reference ellipsoid. See Figure GPS-P-3. While the geoid and reference ellipsoid may overlap in some areas, in others they may differ by more than 100 meters. Because of this, the elevation of your location measured with a GPS receiver may be significantly different from the elevation
determined by other methods (for example, topographic maps). The GLOBE server will automatically make the geoid correction to your elevation once you have entered your GPS measurements for latitude, longitude, and elevation for your site.
Magnetic Variation
On Earth, the magnetic North and South poles do not line up exactly with the true North and South poles (along our planet’s rotation axis). Earth’s magnetic north pole is slowly moving and is currently located in Canada’s Northwest Territories about 11 degrees from the North Pole. Additionally, the magnetic properties of Earth’s composition vary slightly among locations. As a result, there is a unique distortion to Earth’s magnetic field at any given place. Typically a small variation of a few degrees must be added or subtracted from magnetic compass bearings to determine the direction of true North. This variation is known as magnetic variation or
magnetic declination and its value depends on your
location. Figure GPS-P-4 is a world map of magnetic declination. Use this figure to determine true north at your location. You may also use a topographic map to determine the magnetic variation and true North at your location. You will need use the true North heading for the Measuring
Wind Direction Field Guide in the Atmosphere
Investigation and for the Offset GPS Field Guide in
this Investigation. Be sure to adjust your compass to true North according to the following directions. Figure GPS-P-2: Clear and Blocked Views to a GPS
Satellite
Figure GPS-P-3: Geoid and Ellipsoid Surfaces
Topographic
Elevation is Measured in Reference to the Geoid.
Geoid
GPS Measures Elevation in Reference to the Ellipsoid.
W
orld Magnetic Declination Map
Figure G
P
S-P-4
How to deter
mine the dir
ection of true North at your location:
Determine the magnetic declination at your location
using the map above. Add this value
to zer
o degr
ees (magnetic Nor
th). The r
esult r
epr
esents the dir
ection to true North
at your location. Note: Please r
emember that if your declination value is negative, you must subtract this fr
om zer
o
degr
ees.
Cr
edit: U.S. Geological Sur
Learning A
ctivities
A
ppendix
W
elcome
Intr
oduction
Pr
otocols
Compass: True North
The magnetic needle in a compass is attracted by the magnetism of the Earth, and that is why it always points North. However, there are really two North Poles on the Earth. One is the True North Pole which is located geographically at the top of the earth (at 90o North latitude); and the other is the Magnetic
North Pole, an area of highly magnetic rock under central Canada.
Maps and directions are based on True North while the compass needle points to Magnetic North. Magnetic declination is the angle between True North and Magnetic North. Its size and direction depends on where you are on the Earth. It is necessary to determine the declination to take accurate compass bearings. Compasses either have a mechanism to set the angle of declination or a scale to determine declination.
Because compasses are attracted to metal objects they will give incorrect readings if the user is close to, or wearing, metal objects including watches, keys, etc.
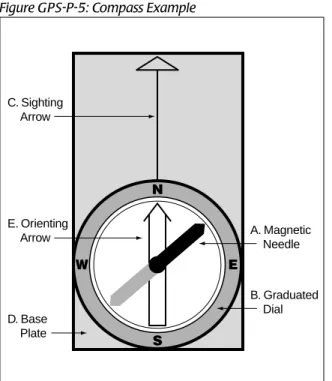
Three Basic Parts of the Compass
1. The magnetic needle (See A in the Figure GPS-P-5) is attracted by the magnetic North Pole of the earth. The magnetic end (black) always points to magnetic north
2. The graduated dial (B) is used to set the desired bearing. The bearing is read in degrees at the sighting arrow (C) at the top of the compass. The dial is graduated in 2 degree increments from 0 to 360 degrees. The cardinal directions are at 0 (or 360), 90 degrees, 180 degrees and 270 degrees which correspond to North, East, South and West.
3. The base plate (D) has an orienting arrow (E) and a sighting arrow (C). Some models also have mirror sights attached. These components are used to line up the magnetic needle and point out the “line of travel”.
Setting Compass Bearings
Step 1:
Set the dial (B) to the desired degree reading (the direction in which you want to travel) so that the correct compass bearing lines up with the sighting
arrow (C).
Step 2:
While holding the compass level, turn your body until the red end of the magnetic needle (A) lines up with the red orienting arrow (E). “Put the red in the shed” is a useful saying to help students remember what to do. The red orienting arrow is considered the “shed.”
Step 3:
Your direction or objective will now lie straight ahead in the direction you are holding the compass (the direction in which the sighting arrow points).
Be sure to choose an object ahead of you in line with your compass bearing and walk toward it. This allows you to walk without looking down at your compass. Every few paces stop and check that you are still traveling in the desired compass direction.
N
E W
S
C. Sighting Arrow
E. Orienting Arrow
D. Base Plate
B. Graduated Dial A. Magnetic Needle
Teacher Support
Measurement Logistics
1. Students must determine the latitude, longitude, and elevation of their school, and for all other GLOBE study sites. 2. Remember, the location and elevation of
each site must be determined only once. 3. If you or your school do not own a GPS
receiver and you are borrowing one, you may want to determine all the sites for which you need to take GPS
measurements. This would allow you to collect GPS data for all the sites in a short period of time (e.g., a week).
4. Locations of GPS measurements:
Student Preparation
The Learning Activities in this Investigation provide additional exercises to help students understand the measurements of time, relative and absolute position, and angles, all the basic elements incorporated in the GPS measurement.
Helpful Hints
Before you use a GPS to receiver make sure that it is set to display the following units:
• Time as Universal Time (UT) • Elevation in meters
• Latitude and longitude in decimal degrees If it does not, follow the manufacturer’s directions or user’s manual to make these adjustments.
Site GPS Measurement Location
School Main entrance
Atmosphere study site Instrument shelter location Hydrology study site Surface water sampling location Soil study sites:
Soil Characterization site Soil profile location
Soil Moisture site Center of the soil moisture star pattern Soil Temperature Soil Moisture or Atmosphere site locations Land Cover sample sites Center of 90 m x 90 m homogeneous area
Phenology Location of the tree, shrub, or one meter square grass area used for the Green-Up and Green-Down measurements.
Some GLOBE study sites should provide clear views of the sky and thus good satellite reception (e.g., Atmosphere study site). Others, especially the Land Cover and Phenology sites, may offer poor GPS reception due to heavy canopy cover. The school location is to be determined at the front or main entrance to the school, thus building may block satellite reception to some extent. In these cases use
the Offset GPS Protocol Field Guide.
Please note that some GPS receivers are not able to display latitude and longitude readings in decimal degrees. If you are using one of these receivers, you should set it to read in degrees and decimal minutes and then convert the latitude and longitude readings to decimal degrees before reporting them to GLOBE. To do so, use the formula and follow the example given below:
Converting from Degrees and Decimal Minutes to Decimal Degrees:
1 degree = 60 minutesReading in decimal degrees = degrees + decimal minutes/(60 minutes/degree)
Example:
A latitude reading is given as 15 degrees and 39.03 minutes N.
Latitude in decimal degrees = 15 degrees + 39.03 minutes/(60 minutes/degree) =
GPS Protocol
Field Guide
Task
Measure the latitude, longitude, and elevation of your school or a GLOBE study site.
What You Need
❑ GPS receiver
❑
GPS Data Sheet❑ Watch
❑ Pen or pencil
In the Field
1. Take the GPS receiver to the exact location you would like to determine latitude, longitude, and elevation.
2. Turn on the receiver, making sure that you are holding it vertical and you are not blocking the antenna’s view of the sky. In most receivers the antenna is internal and is located at the top of the receiver.
3. After an introduction message, the receiver will start to search for satellites. Some receivers may display the previous latitude, longitude, and elevation values while it is locking onto satellite signals.
4. Wait for the receiver to indicate that at least four satellites have been acquired and that a good measurement is available. In most receivers, this is indicated by the appearance of a “3-D” message.
5. At one minute intervals and without moving the receiver more than one meter, make five recordings on a copy of the GPS Investigation Data Sheet of all digits and symbols for the following displayed values:
a. Latitude b. Longitude c. Elevation d. Time
e. Number of satellites f. “2-D’ or “3-D” status icons
6. Turn off the receiver.
7. Average all five latitudes, longitudes, and elevations.
8. Confirm for yourself that your results make sense. You should be able to get a rough estimate of your latitude and longitude by looking at a globe or local map.
9. Copy and submit all GPS readings as your site location to the GLOBE Student Data Archive.
Offset GPS Protocol
Field Guide
Task
Measure the latitude and longitude of your school or a GLOBE study site when a GPS receiver is unable to make an accurate measurement.
What You Need
❑
GPS receiver❑
Watch❑
Magnetic compass❑
Pencil or pen❑ Tape measure
❑
Offset GPS Data Work SheetIn the Field
1. Determine the direction of true North at your location using Figure GPS-P-4.
2. Go to your desired site and mark it with a flag or other obvious marker.
3. Follow the GPS Field Guide to confirm that good GPS reception is not possible. 4. Use the compass to determine true North.
5. Move either North or South to reach the nearest open area in which you can successfully follow the GPS Field Guide . This is your offset location.
6. Follow the GPS Field Guide and record your latitude and longitude. Mark this as the offset location.
7. Record whether the offset location is North or South of your site.
8. Measure the distance between the offset location and your site in meters and record it on the
Offset GPS Data Work Sheet.
9. Divide this distance by 0.0011 meters per degree to determine the latitude difference (in ten thousandths of a degree) between the offset location and your site.
10.Depending on the direction of your offset location:
• If you moved to the north of your site, subtract this value from the latitude of the offset location to determine the latitude of your site.
• If moved to the south of your site, add this value to the latitude of the offset location to determine the latitude of your site.
Learning A
ctivities
A
ppendix
W
elcome
Intr
oduction
Pr
otocols
Frequently Asked Questions
1. How long does it take for a GPS receiver to determine latitude, longitude, and elevation?
The GPS receiver may require anywhere from several seconds to several minutes to acquire a sufficient number of satellites after it has been activated. This depends on the availability of GPS satellites overhead at the time of your measurement, on the presence of obstructions, and on the energy level of your receiver’s batteries. If it takes more than five minutes to get a satellite lock, change your batteries and try again.
2. The receiver is not displaying latitude or longitude. Why?
The receiver has many functions available on various display screens besides the “Location “ screen that usually appears first when the unit is powered up. Please read the manual and familiarize yourself with these other functions of your GPS receiver.
3. The receiver displays “Insufficient
Satellites”, “ Poor Signal Reception”, or similar message. What should we do?
Learning
Activities !
?
What is the Right Answer?*
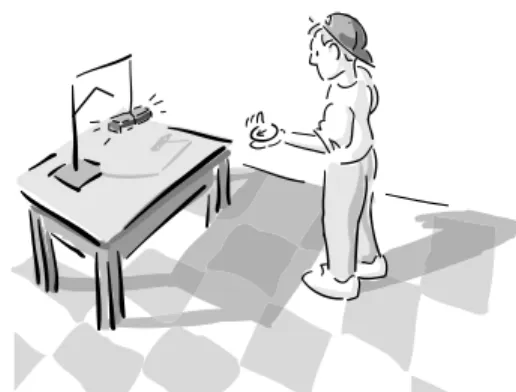
Through a series of activities, students will learn that there are no “right” answers to some questions. A GPS receiver is optional.
Relative and Absolute Directions
A set of activities to introduce students to latitude, longitude, coordinates and relative and absolute directions. A GPS receiver is not needed.
A
ppendix
W
elcome
Intr
oduction
Pr
otocols
L
earning A
ctivities
!
?
What is the Right Answer?
Purpose
To introduce students to the concept that sometimes there is no one “right” answer to a question or measurement
Overview
Students learn to be careful when searching for a “right” answer to questions such as “What time is it?” by comparing multiple measurements of the time-of-day. Students gain an intuitive understanding of the characteristics of imperfect measurements. Using different clocks, students simultaneously record the displayed times. The resulting time measurements are converted from minutes and seconds to seconds. These measurements are plotted to illustrate the mathematical techniques of averages and deviations from an average.
Student Outcomes
Learn how to measure time. Understand the accuracy of a
measurement.
Science Concepts
Levels of measurement incorporate degrees of accuracy.
There are mathematical techniques for characterizing the accuracy of a measurement.
Science Inquiry Abilities
Identify answerable questions. Design and conduct scientific
investigations.
Use appropriate mathematics to analyze data.
Develop descriptions and explanations using evidence.
Time
Approximately one class period
Level
Elementary - do only the clock comparison step
Middle and Secondary - do the full activity
Materials and Tools
At least one clock per student, any type, which shows seconds, will suffice Paper and a writing tool for each student
to record times
Copies of the GPS Investigation Time
Measurements Work Sheet and plot forms for each student
Optional but desirable:
Calculator with addition, subtraction, multiplication and division functions GPS receiver (Used as a source of
standard time. Access to a GPS receiver is not essential. If available, use it as a highly accurate clock.)
Preparation
Provide at least 10 clocks for use by the class. The students can use school clocks or bring in clocks from home.
Prerequisites
Beginning levels - ability to read time on a clock
Background
GPS measurements will be made by a large variety of instruments scattered over large geographic regions and long periods of time. Efforts have been made to recommend instruments of sufficient accuracy and resolution to suit the underlying scientific goals. However, there will be variations between the measurement values because of the diversity of instrument conditions and student researchers.
What Is the Right Answer?
When people make measurements, they usually wish to know something about the quality of their acquired values. Typically someone asks, “How far am I from the right answer?” or “Did I get the right answer?” This assumes that there is a right answer against which to compare the measured value.
Sometimes there is a right answer. However, when scientists begin measuring a quantity, especially if it is the for first time, there may not be a standard against which to compare one’s results. If you have the only instrument for making a particular measurement and you have no reason to doubt the values that you are recording, then it is reasonable to consider yourself to be the standard. A problem comes when there exist either multiple measurement instruments or someone claims to be able to produce “the right” or better results. It has been said, “Someone with two watches does not know the time.” In this case, you, the scientist, have to decide how to handle potentially different measurement values or how to choose which measurements and standards to use.
Resolution and Accuracy Using Clocks
The number of digits or the smallest unit of time that can be read reliably by a person observing a clock is called the instrument’s resolution. Thus a digital clock that displays 12:30:21 (meaning 12 hours, 30 minutes, and 21 seconds) has a resolution of about one second because the clock user can read the clock to the nearest second. An analog clock (which has hour, minute, and second hands) also has a resolution of about one second because you can read the second hand to about one second. An analog clock with only hour and
minute hands has a resolution of only about one minute unless you consistently can determine the location of the minute hand between individual minute markers.
However, the clock that can be read to a resolution of 1 second can deviate from some standard time source from a fraction of a second up through a few hours. The ability of a clock to maintain “correct” time is called its accuracy. Therefore, if you have a clock that gains 10 minutes every day, you still may be able to read it to a resolution of a single second, but it is accurate to only 10 minutes per day. Some say that this clock has an error of 10 minutes per day.
Clocks are machines that display a count of something that changes as time passes. Early clocks determined time by counting falling drops of water or grains of sand. These were not particularly accurate because size of water droplets or an amount of sand falling is hard to control. Later clocks counted the swings of pendulums, the vibrations of tuning forks, mechanical oscillations in electrically stimulated crystals, and atomic resonances. Each of these subsequent clocks is more accurate than its predecessor, and all depend on the increased stability and repeatability of an underlying cyclical physical process. See Figure GPS-RA-1.
A
ppendix
W
elcome
Intr
oduction
Pr
otocols
L
earning A
ctivities
For all clocks to display the same time, ideally each clock would have to be set to the same time simultaneously and experience the same environmental and mechanical conditions. This rarely happens. Clocks typically are set at different times from different references, having different accuracies, with different constructions, and experience different environments. A given collection of clocks will tend to offer a collection of slightly varying time values. This variation in measurement values will be true of most instruments for the temperature, distance, and other measurements of the GLOBE Program (thermometers, tape measures, etc.).
In the case of deciding when to feed a pet, an error of a few minutes from day to day may be insignificant. However, a Global Positioning System location measurement depends on the clocks onboard the satellites being highly accurate. An error of a single microsecond (1/1,000,000 second) may cause the displayed GPS location to be in error by more than 300 meters. The desired resolution and accuracy depend on you (the user) and your understanding of your application.
Time Standards
Until the advent of the American railroads in the late 1800s, there were few widely accepted standards for time. Each population center had its own clocks that were usually referred to local solar noon when the sun peaks in the sky or some other celestial event. However, once one moves through 15 degrees of longitude or about 1600 kilometers along the equator, the time of local noon has changed by an hour. To facilitate consistent scheduling across continent-sized areas of our planet, time zones were created and implemented. The railroads needed and presented a common time reference frame.
Today all time zones are referenced to a longitude of 0 degrees that goes through Greenwich, England. Greenwich houses one of the great astronomical observatories. It was established for standardization of time for British naval navigation. Thus, the time in Greenwich, England, is used as a standard and is called Greenwich Mean Time (GMT), Universal Time (UT), or sometimes Zulu time. (Zulu refers to zero or the 0 degree
longitude.) In the GLOBE GPS Protocol you will
use the Universal Time (UT) designation for your measurements.
The Navy and the National Institute of Standards and Technology (NIST) within the United States and telephone companies maintain standard times using highly accurate atomic clocks that count the vibrations of a variety of atoms under well-defined conditions. The U.S. radio station with the call letters WWV continuously broadcasts the time of day in English on the short-wave radio frequencies of 5, 10, 15, 20, and 25 MHz from Boulder, Colorado. These frequencies themselves are locked to atomic time standards. The Canadian government provides a similar service in both English and French with their short-wave radio station CHU on 7.335 and 14.670 MHz. Many such services exist globally.
The Global Positioning System
The Global Positioning System has a series of satellites that broadcast timing signals from highly-accurate onboard atomic clocks. Therefore, a GPS receiver can determine its time to an accuracy comparable to that of the clocks on the satellite. The GPS receiver can even remove the delay due to travel time between the satellite and the terrestrial receiver because the receiver knows both the satellites’ and its own locations. Thus, GPS receivers have become the best alternative to having your own atomic clock.
Telecommunications
vibrate mechanically at chosen values of between 10 thousand and 100 million times per second. The vibrations are electronically counted by a digital circuit to determine the amount of time which has passed.
What To Do and How To Do It
Step 1. Get the Clocks
Locate at least ten (and preferably more) operating clocks that display time to a resolution of one second. Assign a student to each clock, and declare one student to be the master timekeeper. In a classroom situation where many students may have wrist watches with one second resolutions, these clocks will suffice. Wall clocks displaying seconds in a variety of different rooms are also adequate. Each student should be prepared to record a time and be able to see or hear the master timekeeper.
Step 2. Take the Measurements
Centrally locate the master timekeeper. At 30 minutes and zero seconds after the hour, this student is going to indicate to the other students to record their clocks’ displayed time values to the nearest second. Perhaps ten seconds before the designated time, the master time keeper may begin counting down aloud to prepare the other students.
Although any particular time will work, choosing 30 minutes into the hour increases the chances that during the measurements no clocks will advance to the next hour and thus complicate later arithmetic processing.
Advanced students: Have the students perform the computations and graphing.
Other students: The teacher performs the computations and graphing outside of class for later presentation and discussion. While younger students may not understand the arithmetic, they do understand how the shape of the histogram plot appears for various clock accuracies.
Step 3. What time was it?
For details, see the sample GPS Investigation Time
Measurements Work Sheet and instructions. Determine the average of all time-of-day measurements.
To determine the average time of day when the data were recorded:
Determine the number of seconds past the hour for each participant’s recorded time.
Add these seconds values to produce a sum. Divide by the number of participants to produce the average time.
Convert this back to minutes and seconds and record.
Step 4. Are our clocks any good? Determine Deviation from the Average.
For each participant, compute the difference of each participant’s time value from the average. Do not keep the sign. All results are positive. Add these together to produce a sum. Divide this sum by the number of participants to produce the average deviation. The average deviation is a measure of how far each measurement is from the average time
Plot differences from the average of our recorded
times. See Occurrences Versus Differences Work
Sheet.
Each bin is 10 seconds wide and is 10 seconds from the average number of seconds. Record the average number of seconds in the center box. Place an X in the appropriate bin for each participant’s number of seconds into the hour. This type of plot is called a histogram.
A
ppendix
W
elcome
Intr
oduction
Pr
otocols
L
earning A
ctivities
Further Investigation
If you have access to a GPS receiver, use its time to set a clock that can be used as the master clock for the measurements. The GPS receiver’s displayed time will probably be the most accurate time available.
If we have higher quality clocks, how will our computed average deviation change?
Students with access to spreadsheet computer programs may wish to automate the arithmetic computations found on the work sheet.
Advanced students may wish to investigate the statistical concepts of standard deviation and variance.
Student Assessment
Quantitative
Ask students how the histogram plot would be different if they had a better or worse collection of clocks. Better: X’s grouped closer together. Worse: further apart. Could they record clock values? Could they understand the arithmetic? Should any of the data be rejected? If a data sample is obviously inappropriate, such as from a stopped clock, yes!
Qualitative
Instructions
Record Times Computations
Determine the number of seconds past the hour for each participant’s recorded time.
(Total Seconds = Minutes x 60 + Seconds)
Determine the average time.
(Average time = Sum of seconds / Number of participants)
Compute the difference of each participant’s time value from the average.
(Difference = Seconds into the Hour - Average Seconds) (Do not keep the sign – All results are positive numbers)
Determine the averages of the differences. Plot Histogram
Record the average number of seconds in the center box.
Each bin is 10 seconds away from the average and 10 seconds wide. Determine the time for each bin by adding or subtracting from the average. For each number of seconds into the hour, place an “X” in the nearest bin.
(The number of X’s should be the same as the number of participants.) 1 2 3 4 5 6 7 8 9 10 11 12 13 14 15 16 17 18 19 20
GPS Investigation
Time Measurements Work Sheet
Seconds
Participant Recorded past the Difference Average of
Number times Hour Average from Average Differences
(Hr Min Sec) (Seconds) (Seconds) (Seconds) (Seconds)
12 30 0
12 29 54
12 30 1
12 30 15
12 31 1
12 30 25
12 30 3
12 30 7
12 29 22
12 30 1
Ten Students Participated 1800 1794 1801 1815 1861 1825 1803 1807 1762 1801 1806.9 Average Number of Seconds into the Hour Sum divided by number of Participants 6.9 12.9 5.9 8.1 54.1 18.1 3.9 0.1 44.9 5.9 16.08 Average Deviation Difference Sum divided by number of Participants
10 = No. of Participants 18069 = Sum 160.8 = Difference Sum
Average Time
(Minutes) (Seconds)
30 6.9
Figure GPS-RA-2: An Example Time Measurements Work Sheet
Instructions
Record Times Computations
Determine the number of seconds into the hour for each participant’s recorded time.
(Total Seconds = Minutes x 60 + Seconds)
Determine the average time.
(Average time = Sum of seconds / Number of participants)
Compute the difference of each participant’s time value from the average.
(Difference = Seconds into the Hour - Average Seconds) (Do not keep the sign – All results are positive numbers)
Determine the averages of the differences. Plot Histogram
Record the average number of seconds in the center box.
Each bin is 10 seconds away from the average and 10 seconds wide. Determine the time for each bin by adding or subtracting from the average. For each number of seconds into the hour, place an “X” in the nearest bin.
1 2 3 4 5 6 7 8 9 10 11 12 13 14 15 16 17 18 19 20
Seconds
Participant Recorded into the Difference Average of
Number times Hour Average from Average Differences
(Hr Min Sec) (Seconds) (Seconds) (Seconds) (Seconds)
Average Number of
Seconds into the
Hour
Sum divided by number of Participants
Average Deviation
Difference Sum divided by number of Participants
10 = No. of Participants = Sum = Difference Sum
Average Time
(Minutes) (Seconds)
GPS Investigation
Time Measurements Work Sheet
GPS Investigation
Occurr
ences V
ersus Diff
er
ences W
ork Sheet
P
lot 1: Histogr
am of Number of Occurr
ences v
ersus Diff
er
ences
Figure G
P
S-R
A-3: An Ex
ample Oc
currenc
es V
ersus Differenc
es W
ork Sheet
GPS Investigation
Occurr
ences V
ersus Diff
er
ences W
ork Sheet
P
lot 1: Histogr
am of Number of Occurr
ences v
ersus Diff
er
A
ppendix
W
elcome
Intr
oduction
Pr
otocols
L
earning A
ctivities
Relative and Absolute
Directions
Time
From one to five class periods depending on which steps you choose to do
Level
All levels with some exceptions noted
Materials and Tools
Paper and pencil Graph paperMagnetic compasses
Drawing compasses (for drawing circles) Globes
Metric rulers and meter sticks Bar magnet
Preparation
NonePrerequisites
Beginning levels: Students should be at the appropriate developmental level to be able to learn about the use of latitude and longitude to find a location.
Intermediate and advanced levels: Basic
understanding of degrees, angles and coordinate systems.
!
?
Purpose
Learning about latitude and longitude Developing math skills
Overview
Students begin by asking the simple question: “Where Am I?” Then they learn
about the magnetic Earth and the use of compasses and angles. Students also
learn about the difference between relative and absolute locations.
Throughout this activity, students practice using a variety of math skills.
Student Outcomes
Learn how to locate a position.
Science Concepts
Latitude and longitude determine location. A compass may be used the Earth’s
magnetic field to give direction.
Physical Science
The position of an object can be described by locating it relative to another object.
Geography
Location is used to display information on maps.
Science Inquiry Abilities
Use a magnetic compass to accurately determine angular direction. Identify answerable questions. Design and conduct scientific
investigations.
Develop descriptions and explanations using evidence.
Background
The GLOBE program uses GPS receivers to determine the latitude and longitude of GLOBE study sites. However, the ideas of latitude and longitude, coordinates attached to absolute reference systems, or angles from north may be new to many students. This set of activities introduces these concepts.
When you ask students, “Where are you?”, they may respond, “At home” or “At school.” The answers are in their own local reference frame. If you use a magnetic compass to determine the direction to a tree that is north of you, you will probably conclude that the tree is to your north. However, if you move east or west by any substantial amount and use the same compass to determine your direction to the same tree, you will find the tree to be to your northeast or your northwest. Neither the tree nor Earth’s magnetic poles have moved, but your compass indicates a different direction to the tree. There is something absolute about the positions of the tree and the poles, but there is something relative about your measurement technique. The starting point moved.
If we impose a gridded coordinate system upon our geographic area of interest or the entire world and number the various lines on the grid, we now have a reference frame in which we can uniquely determine any location independent of the relationship between your location and that of another individual. Latitude and longitude are the names of the values for the coordinate system in which we shall be working for geographic determination of locations with the Global Positioning System.
What To Do and How To Do It
Step 1. Relative Positions: Where am I? (For all levels)
Have students ask themselves the question, “Where am I?” and have them list words or draw a rough picture of where they are. Lead a class discussion on what defines “where are we?”
Encourage questions and time for reflection on where a person is and how one might explain where anyone was. Good questions for students
to ask are: How can you describe your location to another student: in your classroom? in another classroom? in another school in town? in another town? in another country? Did students describe their location using relative or absolute references? Emphasize their reference frames.
Step 2. Attempting to Impose a Reference Frame: The Magnetic Earth (For all levels)
Our planet projects a gigantic magnetic field as if it contained a large bar magnet. See Figure GPS-RE-1. Another magnet (like a magnetized needle) will be attracted to our planet’s magnetic poles. A magnetic compass contains a magnet which can spin freely and be observed. Thus, magnetic compasses are useful navigational instruments because they allow one to see the direction of Earth’s magnetic field, which almost lines up with Earth’s north and south poles.
Figure GPS-RE-1: The Earth as a Giant Magnet
A
ppendix
W
elcome
Intr
oduction
Pr
otocols
L
earning A
ctivities
Suspend a bar magnet on a string away from large metal objects and allow the magnet to stop any rotation or spin. Attach the string to the ends of the magnet as shown in Figure GPS-RE-2.
Ask students what will happen. The magnet will eventually stop spinning so that its poles are aligned with north and south directions. Students can test the north-south direction by comparing the magnet with a magnetic compass.
To use the compass, hold the compass on your fingers of your outstretched hand and arm. Hold the compass flat relative to the ground so that the needle can move freely, and keep it away from all metal objects. Position yourself so that you can look across the compass through north while waiting for the needle to stop moving. Do not place the compass near the magnet; it will lessen the effectiveness of the compass.
Step 3. Introductory Compass Angles (For beginning levels)
On a blank sheet of paper, record the following observations, using a magnetic compass for direction.
• Record your specific location (e.g., on the big rock outside our classroom window) and the date.
• List all things that are directly to your north (use the compass to find your direction), east, south, and west, then write a descriptive paragraph on each direction.
Tip. Be specific about what is seen and the direction it is from you. Also record only permanent objects. In areas where there are many things that look similar, try to pick out specific differences.
Remember that good scientists are specific in their descriptions and their drawings. They compare and contrast in their observations. Examples would include the following descriptions at two different schools. See Figures 3, GPS-RE-4a and 4b.
1. The red-brown brick building with the green window frames is due west. To the north of that building is the factory with the tall smoke stack.
2. The area to the east has a single oak tree with a fence extending away from the observer.
Ask questions about the observations to encourage students to compare and contrast.
N W S E N
Step 4. Intermediate and Advanced Compass Angles (For intermediate and advanced levels)
You can divide a circle around you into 360 degrees. This is also written as 360˚. See the GPS Learning Activity Working with Angles.
Navigational directions from some location are given as angles around such a circle, with north at the starting place, or 0˚. East is 90˚. south is 180˚; and west is 270˚.
Angular Directions from North
Your hand can be used to measure directional angles effectively. As illustrated in Figure GPS-RE-5, if you extend your arm, make a fist, and then extend your thumb, the width of your hand (with thumb extended) is about 15˚ (you may need to extend the little finger as well). That means that six of your hands with extended thumbs would fit between north and east. (Each fist with extended thumb equals 15˚, because there are 90˚ between north and east, and 90˚ divided by six fists is 15˚ for each fist.) Figure GPS-RE-5: Using your hand to measure 15˚
Because the angular relationships of each individual’s hand will differ slightly, you may find
that you have to extend your finger slightly so that six “fists” fit into 90 degrees. You may need to try to measure six “fists” between north and east several times before you consistently get the same number of “fists” on repeated trials. Hold your hand as steadily as possible. Focus on what is at the tip of your thumb, and then move your hand so that the back of your hand is now where your thumb tip was. Because you always take your hand with you, remember how you extended your
arm and hand so that you can make future angle measurements. Practice positioning your hand and thumb so that you get a consistent number of “hands” between north and east or north and west. Now record what you see at the end of each hand width. After you feel confident with your measurements go on to the panorama observations below.
Step 5. Panorama Observations (For all levels)
Take a sheet of paper and fold it in half lengthwise. Cut along the fold, so that you have two long halves of the paper. Tape two of the ends together and mark the four directions on the paper, as indicated in Figure GPS-RE-6, so that north is on the two far ends and south is in the middle. Record all observations as drawings on the long narrow strip of paper.
Now that you have had experience with the magnetic compass and with the compass directions, position yourself in the same spot as you did for the compass activity. Draw a panoramic view of what the landscape looks like all around you by making multiple individual drawings for each of the four north, south, east, and west directions. Students can mark all the other directions that fall in between (south southeast, northwest by north), by measuring the angles with their fists.
Step 6. Telling Time with the Sun
To extend this step further, use your fist to measure time. Because the sun moves 15˚ per hour through the sky, one can estimate the time in hours until sunset by measuring the number of hand-widths from the sun to the western horizon. Knowing your local time of sunset, you can then work backward and estimate your local time without a clock!
Figure GPS-RE-5: Using your hand to measure 15°
A
ppendix
W
elcome
Intr
oduction
Pr
otocols
L
earning A
ctivities
Step 7. Are the North, South, East, and West Directions Relative or Absolute? (For all levels)
Go outdoors and mark a point about two meters above the ground (for example, crossed strips of tape on a school window), so that you can have the students stand along an east-west line south of the mark. Have the students form a line with the person on the far east due south of the mark. The students should be spaced at arms’ length. See Figure GPS-RE-7.
In Figure GPS-RE-8, the boxes represent individual students. With compass in hand, the first student takes a bearing on the mark and finds that the direction is north and the angle is 0˚. The students will then record “0˚” in the box, marked “1.” Have each student, in numerical order, make an angle measurement between north and the mark. Because all results will be between north and east for the scenario illustrated, all measurement results should be between 0˚ (north) and 90˚ (east).
Why did each student get a slightly different measurement? Were they all not looking at the same point? Their compass angles are relative to their individual and different locations.
Step 8. Compass Directions Are Relative to Your Location (For all levels)
For practical purposes, Earth’s north and south magnetic poles are fixed close to our planet’s north and south spin axes. In the absence of other magnets, a magnetic compass needle aligns itself with Earth’s magnetic field. Thus, its needle will point to Earth’s magnetic poles. (The Earth’s magnetic poles will not move much during our lifetimes.)
Earth’s magnetic poles appear fixed. However, an observer on the equator will claim the direction to the north as being along a line tangent to the equator. Another observer who is half way from the equator to the north pole will also claim that the direction north is a line tangent to the globe at his location. However, these two lines are not parallel. See Figure GPS-RE-9. Therefore, they are not pointing in the same direction. Get a globe and try this for a variety of different locations around the world. You can see that the direction you call north depends on your location. Therefore, north, south, east, and west are relative directions. These directions are angle measurements in the direction of the magnetic north pole relative to the location from which the measurement is taken.
Figure GPS-RE-7: Students lined facing a mark to the North
Relativ
e and A
bsolute Dir
ec
tions
Figure GPS-RE-8: Overhead diagram of students facing a particular mark
Further background: Directions are not necessarily unique. What problems does this cause? Navigation between arbitrary locations requires a known point as a fixed reference. Giving directions to listeners who are located at different positions means that they must agree to some point in common before directions can be given. Unique starting and ending points (like trade routes), provide an absolute or fixed reference frame such as a coordinate system placed on a map. Latitude and longitude provide a similar reference frame for our spherical planet. Use the drawing and map in Figure GPS-RE-10 to help students understand relative and absolute directions and positions. A full page version of Figure GPS-RE-10 is included at the end of this Learning Activity for you to make duplicates for student use. Describe how to go from your school to your house. Then describe how to go from another school to another house. Then ask, what is the difference? A riddle about absolute directions: Someone builds a house. All of the outside walls of the house face south. A bear walks up to the house. What color is the bear? (Answer: White - if all sides of the house face south, then the house must be at the North Pole. The only bears in the Arctic Circle are polar bears.)
Step 9. Describing a Location (for all levels)
We wish to introduce absolute reference frames for describing locations. Students will expand upon past activities to answer the question “Where am I?” or “Where is something?” and will learn that they must specify the “where” with sufficient clarity so they can communicate their position unambiguously to someone else. We ask students to provide directions relative to some agreed-upon reference or some coordinate system instead of relative to themselves. Cartesian coordinates (x,y axes in geometry and algebra) and latitude and longitude on the globe provide such a system.
Place two students back to back, each with checker boards, so that each cannot see the other’s board. Give them two checkers (tokens) and have one place the tokens anywhere upon the board. Without imposing further rules, have that student describe to the other student where to place the token, so that each token is in the same position on each board. Repeat the process beginning with the second student. Lead a discussion on the communication between the two students. How did the students choose to communicate the locations of their tokens? What determined the clarity and difficulty of their communications?
Figure GPS-RE-11: Describing checker locations
YOUR SCHOOL ANOTHER SCHOOL ANOTHER HOUSE YOUR HOUSE North 0° 180° South East 90° West 270° North 0° 180° South East 90° West 270°
A
ppendix
W
elcome
Intr
oduction
Pr
otocols
L
earning A
ctivities
Step 10. Numerically Describing a Location (for intermediate and advanced levels)
Label a piece of graph paper or a drawn grid as shown in Figure GPS-RE-12, Have students find positions communicated as follows: (1,2), where the first number describes the distance to move to the right from zero on the horizontal axis and the second number describes the distance to move up along the vertical axis.
Then, have students draw a simple picture from the following lines between the given sets of positions. See Figure GPS-RE-13.
(4,1) to (4,4) (4,1) to (5,2) (5,2) to (5,5)
(1,4) to (1,1) (1,1) to (4,1) (1,4) to (4,4)
(1,4) to (2,5) (2,5) to (5,5) (4,4) to (5,5)
Discuss what information is needed to communicate points and drawings. For example, each line required information about a starting point and an end point.
On a new piece of gridded paper, go to position (7,4), and draw an arc with a drawing compass that has a radius of two units. With position (1,1) as the center, draw an arc with a radius of five units that intersects the first arc. Finally, draw a third arc, with a radius of five units and which has a center at (8.0). Where do they intersect? How many arcs are needed to determine a point.
Suppose that the Cartesian coordinates in Table GPS-RE-1 were mapping a portion of ocean and that the side of each square was the distance it
Signal travel time
Ship Location milliseconds
Alexandria (0,0) 4.0
Corsica (1,5) 2.0
Hsuchou (6,3) 3.5
Figure GPS-RE-13: The resulting simple picture Figure GPS-RE-12: Label a sheet of graph paper
Figure GPS-RE-14: Cartesian coordinates defining arcs
Latitude Longitude Name
36˚N 139˚E _______________________
60˚N 30˚W _______________________
27˚S 109˚W _______________________
90˚S 0˚E _______________________
90˚S 180˚W _______________________
__ __ Your location
__ __ Your opposite location
takes a radio signal to travel in one millisecond. There are three ships at sea, the Alexandria is at (0,0), the Corsica is at (1,5), and the Hsuchou at (6,3). Each ship receives a distress signal from a fourth ship, the Bainbridge. The time that it took the Bainbridge’s distress signal to travel to the three potential rescue ships will help the ships locate Bainbridge’s position. Can you find the distressed ship? (Measurement of signal travel times forms the basis of radar and GPS.)
Step 11. Describing Geographical Locations (for intermediate and advanced levels)
On a globe, the east-west lines are lines of constant latitude and the north-south lines are lines of constant longitude. Have students discuss how they are similar to and how they are different from the lines they found on the Cartesian coordinate system. Find the locations listed in Table GPS-RE-2.
Take a globe and find your location. Estimate values for your latitude and longitude from the globe. Now find the point on the globe opposite your location and estimate its latitude and longitude. What are the relationships between the latitude and longitude coordinates for these two opposite locations?
Note: Steps 9, 10, and 11 present concepts similar
to those in Odyssey of the Eyes Learning Activity in the Land Cover/Biology Investigation.
Adaptations for Younger and Older
Students
Qualitative descriptions of measurements may be more appropriate for younger students. For example, describing a compass direction as being “northeast” may be clearer than “45˚ from north.” More quantitative and analytic techniques may be appropriate for older students. For example, they can use the Pythagorean Theorem to determine distances between locations in a flat, gridded coordinate system.
Student Assessment
Have students identify various cities or geographical features using latitude and longitude. Give them a list of cities and have them determine latitude and longitude for each. Also have them find distances between geographical locations.
YOUR SCHOOL
ANOTHER SCHOOL
ANOTHER HOUSE
YOUR HOUSE
North
0°
180°
South
East
90°
West
270°
North
0°
180°
South
East
90°
West
270°
GPS Investigation
Appendix
Site Location Data Sheet
GPS Investigation Data Sheet
Offset GPS Measurements Data Sheet
GPS Investigation
Site Location Data Sheet
You will need at least one copy of this GLOBE GPS Data Sheet per GLOBE site. After making your field GPS measurements and averaging the position data, note your results on one of the GPS Data Submission Sheets, then submit your data to GLOBE. You can do this by accessing the GPS data entry page under the main GLOBE page (http://www.globe.gov) on the World Wide Web. You will be submitting the determined average location for each of your sites (Atmosphere, Land Cover, Biology, Hydrology, Soil Characterization, and Soil Moisture Study Sites and your school). The data submitted should be rounded to the nearest 0.01 minutes as displayed on your GPS receiver.
Type of Site
(Atmosphere, Hydrology, etc.)
Site Description
(25 characters or less)Averaged Latitude
(Whole Degrees, Decimal Minutes N/S)
Averaged Longitude
(Whole Degrees, Decimal Minutes E/W)
Time of 1st Observation
Hours: Minutes: Seconds in UTType of Receiver
Magellan Trailblazer XL & UNAVCO number
or
GPS Investigation
Data Recorded By:
Date Recorded: Year Month: Day:
Circle Site type: School Atmosphere Hydrology
Soil Land Cover Phenology
Other
Site Name: School Name: School Address:
Do not begin recording data until your GPS receiver has “locked in.” Wait at least one minute between recording observations.
Record the following data from the appropriate screens on your GPS unit.
OBS Latitude Longitude Elevation Time # Sats Messages
Decimal Degrees (N/S) Decimal Degrees (E/W) Meters H:M:S UTC Satellites Circle if Shown
1 2D 3D
2 2D 3D
3 2D 3D
4 2D 3D
5 2D 3D
<———Averages
GPS Unit Information
Brand Name:
Model Number:
Offset GPS Measurements
Data Work Sheet
Data Recorded By:
Date Recorded: Year Month: Day:
Circle Site type: School Atmosphere Hydrology
Soil Land Cover Phenology
Other
Site Name: School Name: School Address:
Offset GPS Measurements
Measured Latitude: degrees N or S (circle one)
Measured Longitude: degrees W or E (circle one)
Direction from GLOBE site to offset location: N or S (circle one)
Distance from GLOBE site to offset location (Distance): meters
Computations
Change in Latitude = Distance:_________meters = ________degrees
GLOBE Site’s Latitude:
If offset location further from Equator than the study site:
GLOBE site latitude = (Measured Latitude) - (Change in latitude) = degrees N or S (circle one)
If offset location closer to the Equator than the study site:
GLOBE site latitude = (Measured Latitude) + (Change in latitude) = degrees N or S (circle one)
GLOBE site’s longitude: W or E (circle one) Same as Measured Longitude at the Offset location
GLOBE site’s elevation: From a local topographic map using your site’s latitude and longitude