GIS-based hydrogeological
platform for sedimentary
media
PhD Thesis
Domitila Violeta Velasco Mansilla
Advisor:
Dr. Enric Vázquez Suñè
Hydrogeology Group (GHS)
Institute of Environmental Assesment and Water
Research (IDAEA), Spanish Research Council(CSIC)
1 I. ABSTRACT
The detailed 3D hydrogeological modelling of sedimentary media (e.g. alluvial, deltaic, etc) that form important aquifers is very complex because of: (1) the natural intrinsic heterogeneity of the geological media, (2) the need for integrating reliable 3D geological models that represent this heterogeneity in the hydrogeological modelling process and (3) the scarcity of comprenhensive tools for the systematic management of spatial and temporal dependent data.
The first aim of this thesis was the development of a software platform to facilitate the creation of 3D hydrogeological models in sedimentary media. It is composed of a hydrogeological geospatial database and several sets of instruments working within a GIS environment. They were designed to manage, visualise, analyse, interpret and pre and post-process the data stored in the spatial database
The geospatial database (HYDOR) is based on the Personal Geodatabase structure of ArcGIS(ESRI) and enables the user to integrate into a logical and consistent structure the wide range of spatio-temporal dependent groundwater information ( e.g. geological, hydrogeological, geographical, etc data) from different sources( other database, field tests, etc) and different formats( e.g. digital data, maps etc). A set of applications in the database were established to facilitate and ensure the correct data entry in accordance with existing international standards.
The set of analysis tools was developed as an extension of ArcMap environment (ArcGIS; ESRI).This set of tools was separated into three main modules represented by different toolbars.
The first toolbar, termed HEROS, allows the user to exploit the geological data stored in the database and facilitate the generation of 3D geological models. Detailed stratigraphic columns of the selected boreholes can be generated using customized queries. The automatic creation of a geological profile is possible by displaying the borehole lithological columns, the geophysical and geotechnical field-test results, and the defined stratigraphic units. The user is able to analyse and to define the possible existing correlation surfaces, units, and faults on the basis of an interactive analysis environment. These spatial elements can then be converted within a 3D environment. Finally, the use of the resulting geological model to support the hydraulic parameterisation for hydrogeological modelling is also possible by employing another command.
2
ionic balance calculations, correlation of chemical parameters, and calculation of various common hydrogeochemical diagrams (e.g. Schöeller-Berkaloff, Piper, and Stiff). Moreover, it is also possible to perform a complete statistical analysis of the data including descriptive statistical univariate and bivariate analyses, the generation of correlation matrices of several components, calculation of correlation graphics, etc.
The last toolbar (HYYH) was designed to analyse and visualise different hydrogeological measurements and hydraulic field test results. Contour maps and further spatial operations of the depth or thickness of the aquifers could be generated using customized queries. Likewise, piezometric maps can be created for the selected points and for the selected period of time with another command included in this toolbar. Additionally, multi-criteria query forms enable the user to analyse and visualise different data and interpretations derived from pumping and tracer tests.
The interpreted data and calculations can be easily stored and consulted in the same platform and can be used to build an updatable model database for further interpretations. Thus, each new study does not have to start from scratch.
3 II. RESUMEN
La modelización hidrogeológica tridimensional de los medios sedimentarios (p.ej. sedimentos aluviales, deltas) que suelen constituir acuíferos importantes es compleja debido principalmente a tres factores: (1) la heterogeneidad natural intrínseca del medio, (2) la necesidad de integrar un modelo geológico tridimensional que represente dicha heterogeneidad adecuadamente en los procesos de modelización hidrogeológica y (3) la escasez de herramientas apropiadas para gestionar grandes cantidades de datos hidrogeológicos espacio- temporales.
El primer objetivo de esta tesis ha sido el desarrollo de una plataforma software en un entorno GIS que facilite la realización de modelos hidrogeológicos 3D. Está compuesta por una base de datos geoespacial y un conjunto de herramientas que permiten al usuario gestionar, visualizar, analizar, interpretar y pre-post procesar los datos almacenados en dicha base de datos.
El modelo de bases de datos propuesta en esta tesis (HYDOR) se ha implementado en una base de datos geoespacial del tipo Personal Geodatabase (ArcGIS, ESRI) y permite la integración en una estructura coherente y lógica de un amplio rango de tipos de información hidrogeológica procedentes de diversas fuentes y con diferentes formatos.
Los diferentes instrumentos desarrollados para explotar los datos almacenados en la base de datos se han creado como una extensión de ArcMap (ArcGIS; ESRI) y se reagrupan formando tres barras de herramientas.
La primera barra de herramientas (HEROS) además de facilitarnos el análisis y la interpretación de los datos geológicos almacenados en la base de datos, nos permite generar modelos geológicos tridimensionales. Entre las funciones de dichas herramientas, está la de poder visualizar la información geológica aportada por los sondeos en forma de columna estratigráfica así como la generación automática de perfiles geológicos que muestran las diferentes columnas estratigráficas de los sondeos seleccionados. Información útil como los resultados de los ensayos geofísicos así como las unidades geológicas definidas aparecen también en la pantalla del mismo perfil geológico. Este entorno es óptimo para que el usuario analice y defina las superficies de correlación, las diferentes unidades geológicas y las posibles fallas. Estos elementos espaciales se pueden visualizar en tres dimensiones. Finalmente, otra herramienta nos proporciona la parametrización hidráulica inicial (para el modelo hidrogeológico) de las diferentes unidades geológicas partiendo de las características texturales de las mismas.
4
permite desarrollar un análisis estadístico completo en el que se incluyen entre otros, análisis estadísticos univariante, bivariante y generación de matrices de correlación de diferentes compuestos químicos.
La última barra de herramientas (HYYH) se ha diseñado para visualizar y analizar los datos hidrogeológicos entre los que se incluyen los procedentes de ensayos hidráulicos. Usando estas herramientas se pueden generar mapas de isolineas y otras representaciones espaciales que nos permitan visualizar la profundidad o el espesor de los acuíferos. Del mismo modo, se pueden obtener mapas piezometricos de los puntos seleccionados para un intervalo de tiempo determinado por el usuario. Finalmente, otra herramienta nos permite consultar las interpretaciones procedentes de ensayos hidráulicos.
La información obtenida usando todas estas herramientas, también se almacenan en la base de datos constituyendo de este modo una base para futuras interpretaciones.
El segundo objetivo de esta tesis ha sido la aplicación de esta plataforma software en la gestión de los datos disponibles del área urbana de Barcelona (NE de España) obteniendo con ello una herramienta apropiada de gestión de los recursos hídricos de esta zona tanto en términos de calidad como de cantidad.
Concretamente en la zona del Delta del Besòs (NE de Barcelona), la aplicación de esta plataforma de gestión nos ha facilitado lo siguiente: (1) la delimitación de unidades geológicas basadas en criterios de estratigrafía secuencial, (2) la generación de un modelo geológico tridimensional de facies basado en dichos criterios estratigráficos, (3) el uso del modelo geológico obtenido par establecer la distribución espacial de los parámetros hidráulicos que nos han servido para generar un modelo hidrogeológico consistenete del complejo deltaico. Este modelo se ha calibrado además con datos incluidos también en la base de datos y que proceden de diversos puntos tanto de gestión como de producción durante de los últimos 100 años.
5 III. RESUM
La modelització hidrogeològica tridimensional dels mitjans sedimentaris que solen constituir aqüífers importants (p.ex. sediments al·luvials, deltes) és complexa. Això es deu principalment a tres factors: (1) l'heterogeneïtat natural intrínseca del medi, (2) la necessitat d'integrar un model geològic tridimensional que representi adequadament l’heterogeneïtat en els processos de modelització hidrogeològica i (3) l'escassetat d'eines apropiades per gestionar grans quantitats de dades hidrogeològiques espai-temporals .
El primer objectiu d'aquesta tesi ha estat el desenvolupament d'una plataforma software en un entorn GIS que faciliti la realització de models hidrogeològics 3D. Està composta per una base de dades geoespacial i un conjunt d'eines que permeten que l’usuari gestioni, visualitzar, analitzi, interpreti i pre-post processi les dades emmagatzemades en la base de dades.
El model de bases de dades proposada en aquesta tesi (HYDOR) s'ha implementat en una base de dades geoespacial de tipus Personal Geodatabase (ArcGIS , ESRI), que permet la integració d'un ampli rang de tipus d'informació hidrogeològica procedents de diverses fonts i formats en una estructura coherent i lògica.
Les diferents eines desenvolupades per l’explotació de les dades emmagatzemades a la base de dades s'han implementat com una extensió d’ArcMap (ESRI). Aquestes eines es reagrupen en tres barres diferents.
La primera barra d'eines, HEROS, ens permet analitzar i interpretar les dades geològiques emmagatzemades a la base de dades, permetent alhora la creació de models geològics tridimensionals. També s'han desenvolupat eines que permeten visualitzar la informació geològica aportada pels sondejos en forma de columna estratigràfica, així com generar automàticament perfils geològics per mostrar diferents columnes estratigràfiques de sondejos preseleccionats. A la pantalla del mateix perfil geològic també apareix informació útil com són els resultats dels assaigs geofísics o les unitats geològiques definides. Aquest entorn és òptim perquè l'usuari analitzi i defineixi les superfícies de correlació, les diferents unitats geològiques i les possibles falles. Els elements espacials definits es poden visualitzar en tres dimensions. Finalment, una altra eina ens proporciona la parametrització hidràulica inicial de les diferents unitats geològiques (per al model hidrogeològic) partint de les seves característiques texturals.
6
estadístics univariant, bivariant i generació de matrius de correlació de diferents compostos químics.
L'última barra d' eines, HYYH, s'ha dissenyat per a visualitzar i analitzar les dades hidrogeològiques, entre d’altres, els procedents d'assajos hidràulics. Amb aquestes eines es poden generar mapes d'isolínies i altres representacions espacials que permeten visualitzar la profunditat o l'espessor dels aqüífers. De la mateixa manera, es poden obtenir mapes piezomètrics per a un interval de temps i de punts determinats per l'usuari. Finalment, una altra eina ens permet consultar les interpretacions procedents d'assajos hidràulics.
La informació obtinguda de totes aquestes eines s'emmagatzema a la base de dades, constituint d'aquesta manera una base per a futures interpretacions.
El segon objectiu d'aquesta tesi és l'aplicació d'aquesta plataforma software a la gestió de les dades disponibles de l'àrea urbana de Barcelona (NE de Espanya), obtenint una apropiada eina de gestió dels recursos hídrics d’aquesta zona, tant en termes de qualitat com de quantitat.
Concretament a la zona del Delta del Besòs (NE de Barcelona), l'aplicació d'aquesta plataforma de gestió ens ha facilitat (1) la delimitació d'unitats geològiques basades en criteris d’estratigrafia seqüencial, (2) la generació d'un model geològic tridimensional de fàcies basat en aquests criteris estratigràfics i (3) l'ús del model geològic obtingut per a establir la distribució espacial dels paràmetres hidràulics que ens han servit per generar un model hidrogeològic consistenet del complex deltaic. Aquest model s'ha calibrat amb dades incloses a la base de dades i que procedeixen de diversos punts, tant de gestió com de producció, durant els últims 100 anys.
7 IV. AGRADECIMIENTOS
En primer lugar quisiera expresar mi más sincero agradecimiento a Enric Vázquez Suñè, el director de esta tesis, por sus numerosos consejos y por su paciencia tanto en el plano profesional como en el personal. Sin duda, esta tesis no hubiese sido posible sin su ayuda.
Además me gustaría agradecer a Radu Gogu la oportunidad de conocer el apasionante mundo de las bases de datos y de los Sistemas de Información Geográficas.
Por supuesto nunca podré olvidar la ayuda que el resto de los integrantes del grupo de Hidrología Subterránea de la UPC-CSIC me ha brindado durante estos últimos años. Gracias Carlos, Xavi, Jesús, Dani, Marco, Lurdes y Marteen por vuestras charlas científicas, por vuestras revisiones, por vuestros consejos y por haberme transmitido parte de vuestra sabiduría. Sobre todo me gustaría agradecer los debates, las risas, los consejos y los ánimos al resto de doctorandos (algunos ya doctores o casi doctores) que me han acompañado en esta aventura. Es imposible nombrar a todos, pero no quisiera olvidarme de Adria G, Dani M, Nicola D, Anna J, Estanislao P, Jordi F, María P, Txell G, Albert N, Marco B, Andres P, Julia R, Víctor S, Olga M, Natalia C, Guillem, Laura C, Víctor B, Yoar C, Silvia S, Juan H, Francesca G, Isabel T, Arantxa S, Ester T, Rotman C, Alejandro S, Alejandro G, Manuela B,Alejandro B, Mar G, Enkhbayar D…..Tampoco me quería olvidar agradecer el apoyo logístico a Tere, Silvia, Ana y más recientemente a Mónica.
Además me gustaría agradecer el esfuerzo y la ayuda de Emilio R, Patricia C y Miguel L de la Facultad de Geologia de Barcelona (UB).
También quiero agradecer las revisiones y consejos de Teresa G y Josep F de la Agència Catalana de l’Aigua (ACA).
No podría haber terminado esta aventura sin la ayuda de mis chicas y chicos que me acompañaron durante este periplo o incluso algunos durante casi toda mi vida, tanto en Barcelona como por otras partes del mundo. Gracias por confiar en mí, por vuestro apoyo incondicional, vuestras sonrisas y vuestra amistad. Gracias Vane, Sandra, Anabel, Almu, Elena, Oski, Olgui, Bea, Pollo, Patri, Yoli, Caty, Ani, Anita, Luis, Sabi, Cris, Espe, Adela, Ana, Choni, Merche, Tania, Susi, Manu, Sonia, Luca, Umber, Alberrrrto y Moncho.
8
Infine vorrei ringraziare il mio compagno di vita Marco Miozzo, per tutto il suo sostegno, la gentilezza e l'amore. Grazie mille, per avermi dato tanto in cambio di nulla, per avermi regalato un amore libero e vero... per essere stato al mio fianco. Volevo anche ringraziarti per avermi dato la possibilitá di conoscere i tuoi cari, che mi hanno dato tanti consigli, especiamente a Paolo D.
9 V. TABLE OF CONTENTS
I. ABSTRACT ... 1
II. RESUMEN ... 3
III. RESUM ... 5
IV. AGRADECIMIENTOS ... 7
V. TABLE OF CONTENTS ... 9
VI. LIST OF FIGURES ... 12
VII. LIST OF TABLES ... 18
1 INTRODUCTION ... 19
1.1 Aims and objectives... 19
1.2 Thesis outline ... 21
2 GIS-BASED HYDROGEOLOGICAL DATABASE AND ANALYSIS TOOLS... 23
2.1 Introduction... 23
2.2 Background ... 25
2.3 Proposed GIS-based platform ... 27
2.3.1 HYDOR database ... 29
2.3.3 Storing the results: Interpreted data set. ... 47
2.4 Application: urban area of Barcelona city (Spain) ... 51
2.4.1 Data recording ... 52
2.4.2 Dataset description ... 53
2.4.3 Data Query ... 55
2.5 Conclusions and discussion ... 56
10
3.1 Introduction... 58
3.2 Software instruments and spatial database concepts for geological analysis 60 3.2.1 GIS based software packages for geological analysis ... 62
3.3 GIS-based platform for 3D geological analysis ... 64
3.3.1 Design goals ... 64
3.3.2 Analysis software platform. ... 65
3.4 Application ... 76
3.5 Discussion and conclusion ... 79
4 GIS-BASED HYDROGEOCHEMICAL ANALYSIS TOOLS (QUIMET) ... 82
4.1 Introduction... 82
4.2 GIS-based software platform QUIMET ... 85
4.2.1 Design approach ... 85
4.2.2 The Software platform QUIMET ... 86
4.3 Application ... 98
4.4 Discussion and conclusions ... 103
5 A SEQUENCE STRATIGRAPHIC BASED GEOLOGICAL MODEL FOR CONSTRAINING HYDROGEOLOGICAL MODELING IN THE URBANIZED AREA OF THE QUATERNARY BESÒS DELTA (NW MEDITERRANEAN COAST, SPAIN) ... 105
5.1 Introduction... 105
5.2 General setting ... 107
5.2.1 Besòs delta complex ... 107
5.2.2 Dataset ... 108
5.3 Facies and sequence stratigraphic analysis ... 110
5.3.1 Sedimentary facies belt ... 110
5.3.2 Sequence stratigraphic subdivision ... 114
11
5.4.1 Geological model ... 116
5.4.2 The hydrogeological model ... 121
5.5 Discussion ... 127
5.5.1 The role of sequence stratigraphy in geological and hydrogeological modeling 127
5.5.2 The geological model ... 129
5.5.3 Applicability of the workflow modeling ... 130
5.6 Conclusions... 130
6 GENERAL CONCLUSIONS ... 131
7 REFERENCE LIST ... 134
ANNEX 1: ARTICLES AND REPORTS RELATED TO THE DEVELOPMENT OF THIS THESIS 155 Annex 1.1. Scientific Articles ... 155
12 VI. LIST OF FIGURES
13
Figure 2.12. Simplified conceptual diagram representing some of principal contents of the interpreted dataset related to data obtained by using the commands of HYYH. The 1 and 1..* represents the cardinality of the relationships between tables. ... 51 Figure 2.13. Orthophotograph of the metropolitan area of Barcelona covering the extent of the Besòs Delta, Llobregat Delta and Barcelona Coastal Plain. 52
14
15
16
17
18 VII.LIST OF TABLES
19
1
INTRODUCTION
1.1
Aims and objectives
Sedimentary media (alluvial sediments, deltas, etc.) constitute important aquifers because of their high permeability, storage capacity, and interaction with surface water. In an urban environment, there is a considerable impact of human activity in terms of quality and quantity on groundwater (due to the sewerage system, the water supply network, etc.). Moreover, groundwater poses a problem for the development of infrastructure such as tunnels, basement crossings of large buildings, underground parking lots, etc (Vázquez- Suñè et al. 2005b, Pujades et al.2011).
Groundwater models constitute an essential tool for a reliable water management in urban sedimentary media (Pokrajac 1999; Vázquez-Suñé et al. 2006; Carneiro and Carvalho 2010).These models allow us to conceptualize, identify and quantify the hydrogeological processes. They enable us to simulate various scenarios such as droughts, water resource exploitation, water quality evolution and interaction with civil works in terms of hydraulic and geomechanical behaviour of the ground.
The complex nature of the process that controls the sedimentary media often produces a highly heterogeneous distribution of hydrogeological parameters in aquifers. In this regard, some authors (Huggenberger and Aigner, 1999; Klingbeil et al., 1999; Heinz et al., 2003; Sharpe et al., 2003; Ezzy et al., 2006) have highlighted the importance of constraining the models of flow and transport of solutes to the sedimentological heterogeneities of the aquifer.
Nevertheless, defining the geological heterogeneities that control flow behaviour in sedimentary aquifers and especially, in those located under urbanised areas, is not easy. Outcrops, where they exist, are few and far between and data are sparse and are derived from diverse sources, making a suitable integration and management difficult.
20
Apart from a detailed geological model, a comprehensive hydrogeological model must use all kinds of information available, i.e. hydrometeorological, geographical, hydrochemical, hydrogeological and environmental information, etc. Each field complements the interpretation of the rest of the fields. For instance, an appropiate hydrochemical analysis allows us to re-interpretate the geology, or a reliable geological analysis enable us to perform a proper parameterization of the study area that can be complemented with pumping tests.
The accomplishment of these tasks is not always straightforward because of a) the management and integration of a vast amount of time and spatial dependent data of different nature ( e.g. hydrological, geological, etc), b) the homogenisation and harmonisation of data collected from diverse sources and gathered with different techniques (Rienzo et al 2008, Letoenau et al 2011), c) the communication and exchange of data of different formats ( Wojda and Brouyere 2013), d) the management of data with varying quality standards and diverse temporal and spatial extensions and e) the need for integrating into the database the resulting interpretations and models derived from the raw data with the necessary documentation for re-use by third parties with different objectives(Refsgaard et al.,2010).
An optimum data management of this vast amount of spatial-temporal information cannot be readily handled without a comprehensive geospatial database that covers all the necessary concepts for dealing with a comprehensive groundwater characterisation. Besides, such a database should have at its disposal efficient tools for the gathering and the exploitation of raw data for their subsequent interpretations. Moreover, these interpretations should be correctly structured and included in the database for further cross-analyses (e.g.validation of a hydrogeological model with a geological model).
The use of the GIS-based approach proved to be a reliable method to implement groundwater database and to handle the interpretation and the analysis of the data taking into account most of the aforementioned aspects (e.g. Carrera-Hernandez et al 2008, Chesnaoux et al 2011).
As regards hydrogeology, GIS-based hydrogeological databases and tools have already been applied to a wide range of applications (e.g. Camp and Outlaw, 1993, Gogu et al., 2001, Strassberg, 2005; Gemitzi and Tolikas, 2006; Best and Lewis, 2010; Whittaker et al., 2012, Rhaman et al., 2012). Nevertheless, the following issues remain to be resolved: (1)the need for developing further tools that complement the existing tools implemented in the GIS platforms to perform a comprehensive 3D geological and hydrogeological analysis,(2) the scarcity of geospatial databases that are specially designed to store and manage the wide variety of hydrogeological spatial-temporal dependent data with the appropriate tools for retrieving additional information in the same GIS platform, and (3) the dearth of geospatial databases aimed at integrating the resulting interpretations and models derived from raw data with the documentation for re-use.
21
analysis and interpretation. Furthermore, this platform facilitates the pre- and post-processing of the hydrogeological data for modelling.
The second aim of this thesis is to implement this modelling platform in the urban area of Barcelona (NE, Spain) to structure all the available data and set up a working framework of groundwater resources in terms of quantity and quality for this area.
The urban area of Barcelona with over 3 million inhabitants is located on the Mediterranean coast in the NE of the Iberian Peninsula. Geologically, this area consists of a coastal plain limited by two deltaic formations and a higher area, the Catalan Coastal Ranges.
The sedimentary aquifers have been exploited for domestic and industrial use in recent decades, which has seriously compromised the quantity and quality of the groundwater resources of the study area. Moreover, this region has an active underground infrastructure, which also poses a threat to the quantity and quality of groundwater resources.
1.2
Thesis outline
This thesis consists of four principal chapters (chapters 2 to 5) in addition to the introduction (chapter 1), general conclusions (chapter 6) and reference list (chapter 7). The main chapters are based on papers that have been published, accepted or submitted to international journals. The references to the papers are contained in a footnote at the beginning of each chapter. One annex lists the articles and reports concerning the development of this thesis and the participations in scientific congresses and seminaries.
Chapter 2 highlights the need for developing a software platform in a GIS-environment that combines in a unique platform a geospatial database (HYDOR) and three families of utilities aimed at facilitating: hydrochemical data interpretation (QUIMET), 3D geological analyses and modelling (HEROS) and other hydrogeological analyses (HYYH). In this chapter, we focus on describing the last set of tools (HYYH) and the database model of HYDOR. Section 2.2 provides a review of the general advances made in the development of the database and tools. Moreover, this chapter presents the implementation of this data model in the urban area of Barcelona (NE, Spain).
Chapter 3 describes the methodology and instruments created for generating 3D geological models using the set of geological analysis tools (HEROS). The second section of this chapter undertakes a critical review of commercial and research instruments that assist the creation of 3D geological models with special emphasis on the GIS-based software platforms. This chapter also includes an application of these tools in a study area located in Barcelona.
22
Chapter 5 focuses on the application side of the GIS-based platform and presents a sequence stratigraphic-based 3D geological model of the Quaternary Besos Delta (urban area of Barcelona, Spain), which was used to constrain the distribution of hydraulic parameters and thus to obtain a consistent hydrogeological model of the Delta.
Chapter 6 contains the summary of the main conclusions of the thesis and chapter 7
23
2
GIS-BASED HYDROGEOLOGICAL DATABASE
AND ANALYSIS TOOLS
2.1
Introduction
Groundwater represents an important source of water. Evaluating and predicting its availability and accessibility is therefore one of the main tasks in Integrated Water Resources Management (IWRM) (Barthel et al., 2008).
In an IWRM framework, the development of hydrogeological models is required to predict the impact of different land and water management. Moreover, all data employed in modelling should be easily accessible to decision makers and modelers (Carrera and Gaskin, 2008).
Models are a representation of the reality (Cunge, 2003), but reality is elusive. A comprehensive hydrogeological model demands the use of a wide variety of information, i.e. geological, hydrometeorological, geographical, hydrochemical, hydrogeological and environmental, etc. Each field complements the interpretation of the rest of the fields. For instance, a proper hydrochemical analysis allows us to re-interpret the geology and a reliable geological analysis enables us to perform a proper parameterization of the study area that can be complemented with pumping tests.
In practice, this interpretation process may encounter a number of difficulties: a) the management and integration of a vast amount of time and spatial dependent data of all kinds( e.g. hydrological, geological, etc), b) the homogenisation and harmonisation of data collected from diverse sources and gathered with different techniques (Rienzo et al., 2008;Létourneau et al.,2011), c) the communication and exchange of data of different formats (Wojda and Brouyere, 2013), d) the management of data with varying quality standards and diverse temporal and spatial extent, e) the need for handling and retrieving geological and hydrogeological data for representing the heterogeneity of the aquifer systems in the three dimensions of space (e.g. Ross et al., 2005; Robins et al., 2008; Velasco et al.,2012a; Velasco et al., 2012b) and f) the necessity of integrating into the database the resulting interpretations and models derived from the raw data with the necessary documentation for use by third parties for different objectives (Refsgaard et al.,2010).
24
An optimum data management of this vast amount of spatial-temporal information cannot be readily handled without a comprehensive geospatial database that covers all the necessary concepts for dealing with an entire groundwater characterisation.
Besides, such a database should have at its disposal efficient tools to gather and exploit the raw data for further interpretations. Moreover, these interpretations should be correctly structured and included in the database for subsequent cross-analyses (e.g., validation of a hydrogeological model with a geological model).
The use of a GIS-based approach has proved to be a reliable method to implement groundwater databases and to interpret and analyse the data taking into account most of the aforementioned aspects (e.g. Strassberg et al., 2007; Sanz et al., 2009; Chesnaoux et al., 2011). The use of GIS improves the visualisation and the editing of data through the simultaneous display of different layers and more advanced 3D views. These applications increase the integration of quantitative and qualitative data and enable straightforward consultation, search, and retrieval of portions of information provided by different sources of spatial data (Descamps et al., 2005). Moreover, the combination of databases and GIS software packages not only constitutes a valuable support for the creation of data structure for the interpreted data but also maintains a simple interface with the user, obviating the need to know the complexity of the data model.
As regards hydrogeology, GIS-based hydrogeological databases and tools have already been applied to a wide variety of applications (e.g. Gogu et al., 2001; Strager et al., 2010; Rhaman et al., 2012). However, because of the complexity and large number of methodologies involved in groundwater characterisation, some procedures still lack refinements (e.g. the possibility of performing a hydraulic parameterisation from detailed geological analyses with the support of tools to manage hydraulic test results in the same scenario).
In this context, we developed a novel GIS-based platform. It is composed of a geospatial database and a set of GIS tools that arrange all the available data into a coherent structure and provide support for their proper management, analyses and interpretations.
In detail, these GIS tools provide three families of utilities aimed at facilitating: hydrochemical data interpretation (QUIMET; Velasco et al., 2013a), 3D geological analysis and modelisation (HEROS; Velasco et al., 2012b) and other hydrogeological analyses (HYYH, presented in this chapter).
25
Section 1.1 of the present chapter is constituted by the introduction. Section 2.2 provides a review of the existing hydrogeological database models with their corresponding tools. Section 2.3 contains a detailed discussion of the novel GIS based platform. Section 2.4 focuses on the application of this platform to the metropolitan area of Barcelona. Finally, the main conclusions arising from the application of the software together with its advantages, limitations and possible further developments are presented in section 2.5.
2.2
Background
This section reviews some existing projects that inspired the design of the database and the development of the tools to exploit the information presented here. The review begins by examining some existing groundwater data models paying particular attention to the projects that have also developed tools to exploit the available data in a GIS environment.
In the early nineties, Camp and Outlaw, 1993 developed a complete well log database based on information obtained from driller`s logs and electrical geophysical logs. Additionally, a procedure for constructing geological profiles for providing geometric data for groundwater flow and contaminant transport models has also been created using ARC/INFO (ESRI, 1993).
Some years later, Gogu et al., 2001 developed one of the first reliable GIS-based hydrogeological databases for the Walloon region in Belgium. It is a GIS-based database that offers facilities for groundwater-vulnerability analysis and hydrogeological modelling. This database manages efficiently geological, hydrochemical, climatological and further hydrogeological information using ARC/INFO (ESRI, 1997). Furthermore, it includes a set of tools to perform spatial-temporal queries of some of the data included in the database such as hydraulic head or pumping well allocations.
Thereafter, Cabalska et al., 2005 developed a functional system composed of GIS-tools that facilitate data consultation and retrieval of a complete database which integrates several existing databases in the Polish Geological Institute (PGI, 2013). The database includes a variety of hydrogeological, hydrochemical, geological and meteorological information. The GIS-tools, developed in the Geomedia Pro platform, enable the graphical representation of some data integrated into the database, their spatial analysis and the generation of hydrogeological cross-sections.
Despite these advances, there continues to be a need for other tools to perform and store detailed 3D characterisation of the study area and also for tools to facilitate further hydrogeological analyses.
26
wells, temporal and vertical information recorded along boreholes. In addition to the geodatabase, two sets of tools have been developed to help users create data structures within the data model. The first set of tools operates within ArcScene and supports the creation and the storage of 3D objects such as hydrostatigraphy, cross-sections and volumetric objects. The second set of tools facilitates the generation of 2D/3D modelling elements such as cells and models. Besides, the database structure enables the generation of SQL queries to map time series in 2D and 3D.
This framework provides efficient tools for the management and interpretation of hydrogeological data. Nevertheless, further procedures may be improved especially for the management and retrieval of detailed geological data and hydrogeological experimental tests.
Whiteaker et al., 2012 facilitate the management and interpretation of geological data integrating 2D cross-sections and 3D representations into the site characterizations in ArcGIS by using the presented ArcHydro Groundwater model.
Chesnaux et al., 2011 present an effective methodology to build a comprehensive database through a combination of Relational Database management Systems (RDBMS), ArcGIS and the aforementioned ArcHydro Groundwater Tools. Additionally, these authors introduce a process for increasing the efficiency of the geodatabase thanks to instruments developed for data quality control. The database includes a wide variety of hydrogeological data; among them results of experimental tests such as pumping tests, specific capacity tests, grain size analysis and prediction of the hydraulic conductivity of the aquifers.
Further advances in the storage of field test observations and interpretations can be found in the H+ database (de Dreuzy et al., 2006), which provides an interface between experimentalists and modellers. This database structure enables us to store a large number of data and data types collected for a given site or multi-site network. It is designed to manage a broad range of information that incorporates both routine monitoring of point collections and experimentally derived data from several site collections. It is enriched with a fully functional web-based user interface; nevertheless further tools for interpretation and visualization of data are still needed.In addition, the generic structure proposed as a template does not describe a conceptual data model for specific hydraulic tests (Wojda et al., 2010).
27
In order to facilitate data exchange, this model complies with the recommendations of the European Geospatial Information Group (Vogt, 2002) and follows the guidelines of the International Organisation for Standardisation Technical Committee 211 (ISO/TC211) and the Open Geospatial Consortium (OGC). Finally, it proposes a simplified approach based on the Observations&Measurements standard (OGC, 2003; OGC, 2006; OGC, 2007) to manage hydrogeological data such as time series of piezometric heads and field measurements and observations.
In addition to the aforementioned models and in line with Wojda and Brouyere, 2013, International Standards and on-going projects concerning encoding and exchange of geospatial information were also taken into account to develop the hydrogeological data model presented here. This includes the Geological data specifications of the European Directive INSPIRE (INSPIRE, 2013), the ONEGeology project (OneGeology, 2013), the Australian National Groundwater Data Transfer Standard (1999), the Common Implementation Strategy for the Water framework directive (2000/60/EC) (WFD, 2007), GeoSciML (Sen and Duffy, 2005), Water ML.2.0 (OGC, 2012) and the Observations&Measuremens standard (INSPIRE, 2011).
2.3
Proposed GIS-based platform
In the light of the aforementioned discussion, a new hydrogeological database model was developed together with a set of tools to improve the visualisation, processing and interpretation of the hydrogeological data constituting a GIS-based platform.
This software platform was designed bearing in mind the different tools and methodologies that water managers use to evaluate, integrate and analyse the wide range of information for the construction of a hydrogeological model. Consequently, the following requirements were taken into consideration to design the software platform:
I. Management and storage of spatial features and time dependent data on a geospatial database. The design of the database should support:
I.1. The representation of different spatial-temporal scales of groundwater systems. I.2.The integration of different types of information (e.g. groundwater, hydrometoerological, hydrological).
I.3. The possibility of the standardisation and harmonisation of data. I.4. The integration of interpreted data.
28
II.1. Instruments to perform accurate geological analysis and creation of 3D models: a) specific instruments to perform accurate stratigraphic analysis, visualisation of stratigraphic columns and generation of cross-sections b) tools to generate 3D surfaces of isopach and isobath maps and c) tools to generate fence-diagrams.
II.2. Tools to facilitate the hydrochemical analysis by using quality controls, computation methods, statistical analysis and traditional graphical analysis techniques (e.g. Piper, Stiff and salinity diagrams).
II.3. Instruments to query and represent other hydrogeological data such as groundwater level, aquifer tests and well abstractions or injections.
II.4. Tools that enable the hydraulic parameterisation by using calculations based on the textural characteristics of the terrain and based on hydraulic test interpretations (i.e. pumping and tracer tests).
II.5. GIS environment which provides: a) different interpolation tools to estimate/ validate the distribution of different parameters such as hydrogeological, hydrochemical, petrophysics, hydrological, hydrometeorological properties, b) Index overlay techniques and c) a wide range of in built utilities for further analysis (e.g. Spatial Analysis Tools, Geostatistical Tools, Mapping tools, etc).
III. Native interaction with external software for further analysis using:
III.1. Geostatistical software packages such as SGems (Remy, 2009) or GSLIB code (Deutch and Journal, 1998).
III.2. Software packages especially designed to characterise the recharge (e.g. EASYBAL (Serrano et al., 2013; GHS, 2013a).
III.3. Codes to facilitate the hydraulic tests interpretations such as EPHEBO/MariaJ code (GHS, 2013b)
III.4. Pre-processor packages to generate 3D mesh such as GID (CIMNE, 2013).
III.5. Groundwater modelling packages such as TRANSIN (Medina and Carrera, 2003, Medina et al., 2000) and VisualTransin (GHS, 2013d).
III.6. Hydrogeochemical modelling packages such as PHREEQC (Parkhurst and Appelo, 2013), NETPATH (Plummer et al., 1994) and MIX (Carrera et al., 2004; Serrano et al., 2013; GHS, 2013c).
29
2.3.1 HYDOR database
The geospatial database HYDOR represents geospatial information based on the Personal Geodatabase structure provided by ArcGIS (ESRI, 2012).
The database design enables the user to extend the scheme if necessary. This framework offers a very good interface for geospatial data management and the possibility to exchange geospatial data through XML which extends its interoperability (Wojda and Brouyere, 2013). Moreover, although the data model of the hydrogeological database described here was implemented within ArcGIS, most of these concepts are sufficiently flexible to enable implementation into other platforms.
The first step in the development of the database was the creation of a conceptual model of the required information. The data model of HYDOR is conceptualized in 8 main components: Geology (e.g., boreholes lithological description, stratigraphic units, depth to bedrock), Geophysics (e.g. diagraphies), Hydrogeology (e.g. well descriptions, springs, head measurements, extraction measurements, hydrochemical measurements), Hydrology (e.g. rivers, lakes, sea), Hydrometeorology (e.g. precipitation, temperature) , Environment (e.g. protection zones),Regional Geography (e.g. topography, cities) and Water Management Administration ( e.g. River Basin Districts).
30
Figure 2.1. Simplified ArcCatalog view of the HYDOR database model.
2.3.1.1 Description of data contained
This section describes the most important or innovative elements of the HYDOR database, highlighting the most used aspects in groundwater characterisation. Other datasets (Interpreted dataset) containing interpretations and calculations obtained from these data are shown in section 2.3.3. Finally, the reader is referred to Velasco et al 2012b and Velasco et al, 2013a for further details about geological and hydrochemical components of the database.
I. Geological components
31 I.1. Boreholes
One of the main components of the geological dataset is Boreholes, which is a point feature class describing borehole locations and attributes. Boreholes provide information that is used to characterise the subsurface. The observations recorded within a borehole such as its lithological (Lithology), paleontological (Fossils), chronological (Age, Period, Epoch), geotechnical (GeotechnicalObservations&Measurements) characteristics are stored in different tables linked to the Boreholes feature class. These observations are expressed as intervals that correspond to different depths along the borehole.
I.2. GeolObservationsPoints
Although the main source of geological information in an urban area is provided by the boreholes, other geological observation points (GeolObservationPoints) such as pits or outcrops were included in the database. As with the Boreholes feature class, this entity is linked to the same tables for storing its geological and geotechnical characteristics (i.e.
Lithology, Fossils, etc.).
I.3. GeologicalUnits/SubUnits
These tables store the different properties of the identified geological units, such as type (e.g. biostratigraphic, allostratigraphic,) and general composition (e.g. dolomitic, sulphate, etc.). In line with the definition of the Geological Units class established by INSPIRE, 2013 these tables are conceptual entities and enable a single real world geological unit to have multiple map representations (2D, 3D, sections, etc.). The aforementioned representations depend on the available data and on the objectives of the project (e.g. regional, local-site study). In order to maintain the difference between raw data and interpreted data, all the spatial representations of the GeologicalUnit/Subunits are stored separately in the Interpreted dataset (section 2.3.3).
The definition of the boundaries (top and bottom) of the different
GeologicalUnits/Subunits for each borehole or geological observation point is stored in tables
BoreholeGeolUnits/SubUnits and GeoObsPointGeolUnits/Subunits. I.4. GeologicalStructures
32 II. Hydrogeological components
The hydrogeological dataset of the data model includes the representation of hydrogeological units, groundwater bodies and aquifer systems in a number of spatial forms. Moreover, this dataset contains features class and different attribute tables to describe man-made or natural objects where interaction occurs within the hydrogeological system. Finally, a wide range of hydrogeological spatial-temporal dependent data such as piezometric heads or hydrochemical measurements among others can be easily managed within the database (see figure 2.2, 2.3 and 2.4).
II.1. Hydrogeological Units
The HydrogeologicalUnits table stores the conceptual description and attributes of the hydrogeological units identified. A hydrogeological unit is a part of the terrain with distinct parameters for water storage and conduction. There are 3 main subclasses of hydrogeological units: Aquifer, Aquitard and Aquiclude.
The design of these feature classes are essentially based on the recommendations given by the INSPIRE, 2013. For instance, the Aquifers feature class contains all properties of the aquifer systems such as aquifer media type ( e.g. porous, fractured, etc) , aquifer type ( e.g. confined, unconfined, etc) , hydrogeochemical rock type to define the natural hydrogeochemical condition ( e.g. siliciclastic, carbonatic, etc), vulnerability to pollution , mean storativity coeffient and mean permeability.
Additionally, the table AquiferSystems represents a collection of aquifers and/or aquitards which together constitute the environment of groundwater - "communicating vessels" that are filled or can be filled with groundwater i.e. a GroundWaterBody.
These features have different spatial representations in 2D and 3D as the
GeologicalUnits and they are also stored in the Interpreted dataset (section 2.3.3). The definition of the boundaries of the different hydrogeological units identified for each borehole (Boreholes) or for each geological observation point (GeolObsPoints) is stored in the tables
33
Figure 2.2. Simplified conceptual diagram representing some of the hydrogeological content of the HYDOR geospatial database including HydrogeologicalUnits, GwPoints and the different tables that describe the Wells properties.The 1 and 1..* represents the cardinality of the relatioinships between tables.
II.2. GroundwaterBody
This polygon feature class represents a distinct volume of groundwater within an aquifer or aquifer system, which is hydraulically isolated from nearby groundwater bodies (INSPIRE, 2013). This feature contains general information of the groundwater body such as the water type (e.g. fresh water, saline water, etc) and the degree of change as a result of human activity ( e.g. natural, modified, slighty modified, ect). GroundWaterBody is linked to a number of entities such as AquiferSystems and WFDGroundWaterBody, which is a management unit within the Water Framework Directive (WFD).
Besides, global piezometric characterisation of the groundwater body for different time intervals is stored in the associated table PiezometricState. Likewise, PiezometricState is related to the HydrogeologicalSurfaces (representing the geometry of any hydrogeological surface based on hydrogeological measurements in a group of wells) which is stored in the
[image:34.595.102.501.107.398.2]34 II.3. GwPoints
This point feature class is focused on representing punctual man-made (e.g. well, mines) or natural objects (e.g. springs, geysers) where interactions occur within the hydrogeological system. The main attributes of this GwPoints are the geographical coordinates, the description of the different names used to identify these points of information (potential different sources of data), the type of groundwater point (well, piezometer, spring, etc.), point accessibility, related groundwater body and other administrative information. Moreover, information specific for each groundwater point type is stored in different tables. The most common GwPoints types in use are:
• Wells
The table Wells stores specific properties of wells and piezometers such as activity (e.g. monitoring, dewatering, disposal, recharge, etc.), depth, status, dimensions of the curb, related borehole, etc. In order to complete the description of the wells, different tables were defined: a) Pumps, which stores the properties of the pump of the wells should one exist, b)
Gravels, which describes the gravel pack properties and c) Screens, which describes the screen type (e.g. continuous-slot, slotted plastic pipe, etc) and d) ScreenObservations, which stores the intervals screened. The latter, also establishes for each given screened interval, the link of the well to the hydrogeological unit which is screened .Thus, a well can be screened in diverse hydrogeological units whereas a hydrogeological unit is screened by different wells.
• Springs
The table Springs stores specific properties of springs, such as spring type or water persistence (e.g. intermittent, seasonal, etc.).
II.4.GwObservations&Measurements
To manage hydrogeological data observed at a given groundwater point (GwPoints) such as time series of head measurements, or rate and volume of abstraction or recharge, the tables GwPointsObservations and GwPointsMeasurements were designed (see Fig.2.3). Several tables containing further details such as those related to the temporal measurements (TimeMetadata) and the process used to carry out the observation (ProcessUsed) are linked to these tables. A code list of hydrogeological measurements with its corresponding units (LibGwParameters) was also developed.
In addition, other vertical measurements are considered in the
GwVerticalMeasurements table (as Strassberg, 2005).
35
II.5. ChemSamplesObservations&Measurements
These tables (ChemSampleObservations and ChemSampleMeasurements) contain information about the hydrochemical measurements realized in both groundwater points and surface-water points. Detailed information about this dataset and its related tables (e.g.
LibChemParmLab, LibNormative) can be seen inVelasco et al., 2013a.
Figure 2.3. Simplified conceptual diagram representing some of the tables that include the GwObservations& measurements observed in the GwPoints. The 1 and 1..* represents the cardinality of the relationships between tables.
II.6. HydraulicTests
Hydraulic tests (e.g. pumping tests, tracer tests) are commonly used by hydrogeologists to determine a wide variety of hydraulic properties of an aquifer system. Normally, this type of field-tests generate a large amount of complex spatio-temporal dependent data that are difficult to manipulate for subsequent analysis and interpretation. To overcome these difficulties, a dataset was generated to store the majority of the existing types of pumping and tracer tests.
According to Wojda and Brouyere, 2013, the information required for a generic analysis of aquifer tests consists in: a) the description of the experimental setup, b) observations retrieved at different locations in space and in time during the experiment and c) the interpretation of these observations with its methodological description.
36
misunderstanding in a general temporal-spatial query of the groundwater points and c) the design of the tables should support a wide variety of workflows for tracer and pumping tests.
This dataset is composed of the following tables (see Fig. 2.4.):
• Tests
This table contains general information of the hydraulic test such as name, campaign, date, responsible, type of test (related to TestType) and study area (related to StudyArea). The rest of the experimental setup information such as the wells and piezometers involved in the experiments or the characteristics of the tracers injected are stored in different tables linked to this one. Additionally, the observations and measurements retrieved during the tests and the interpretations obtained from these observations are stored in separated tables.
• PumpingTestWellSpecification
This table stores the information about the pumping period and other incidents of the pumping device occurring at the wells during the pumping test.
• PumpingTestObservations&Measurements tables
As with the GwObservation&Measurements, these tables were designed following the general guidelines of O&M standards with some specifications for improving the introduction, management and query of the data related to pumping tests. Consequently,
PumpingTestObservations table includes the feature of interest (well or observation point), the characteristics of the time-series (TimeMetadata) of the measurements performed during the test (e.g. flow profile or drawdown) and other important characteristics of the experiments such as the process and the device used in the experiments (ProcessUsed). The
PumpingTestWellMeasurements table stores the information retrieved in the well (flow and accumulative volume) where the pumping occurs whereas the
PumpingTestObsPointsMeasurements table stores the information of the drawdown or head measurements performed at the monitoring points. The design of the structure of the database considers that for a given pumping test various wells can extract/inject water simultaneously or at different periods of time. Likewise, these wells can act as monitoring points and vice versa.
Finally, the different parameters interpreted from these experiments as well as other details about the methodology are stored in the PumpingTestInterpretations table. For a given experiment, different interpretations can be obtained depending on the methodology used.
• TracerTestObservations&Measurements
The observations retrieved in a tracer tests is stored in this group of tables. The
37
[image:38.595.89.506.178.439.2]procedure such as injection point, process used, injected volume, type (punctual or continuous) and the characteristics for each tracer used (TracerTestChemInjections) together with the date and duration of the injection.
Figure 2.4. Simplified conceptual diagram representing the most of the tables involved in the storage and management of the data related with the hydraulic tests. The 1 and 1..* represents the cardinality of the relationships between tables.
The TracerTestSampleObservations table stores the information of the measurements made at each sampling point. This sample is stratified in accordance with, sampling data, sample name, sample size and depth .Thereafter, each sample analysis is stored in accordance with sampling data analysis, parameter, value and units of measurement in the
TracerTestChemMeasurements table.
The TracerTestsCountinousObservations and TracerTestContinousMeasurements
tables include information of the tracer measurements made by continuous tracer test instrumentation.
38 III. Geophysical components
This dataset was designed to store commonly used geophysical measurements made in groundwater characterisation. This dataset includes two main feature-classes that represent the location and projected geometry of geophysical activity: GeophPoints and GeophProfiles.
III.1. Geophysical profiles
This line feature-class (GeophProfiles) was designed to represent the location and the main attributes of the geophysical measurements spatially referenced to a projected line (e.g. seismic lines).
III.2.Geophysical points
It is a point feature-class (GeophPoints) that indicates those geophysical measurements spatially represented as points, such as diagraphy.
III.3. Geophysical observations&measurements
The GeophysicalObservations table stores the main characteristics of the geophysical measurements performed in the GeophPoints such as the experimental data set (related to
Process Used). The resulting values are stored in the linked GeopysicalVerticalMeasurements
table.
IV. Hydrological components
Traditionally, management water resources have been focused on surface water or ground water as if they were separated entities, but practically all surface water features (e.g. rivers, lakes, etc) interact with groundwater (Winter et al., 1999).
The general scheme includes spatial elements that take into account the WISE Reference GIS dataset (WFD, 2009). The WISE Reference GIS datasets have been created using detailed digital spatial data supplied by Member States and other sources, generalised for visualisation and assessment of geo-referenced data across Europe.
In addition, other datasets and feature-classes were specifically defined to include different observations for a complete groundwater characterisation and for describing the relationship of groundwater and surface water.
39 IV.1. Rivers
The main aim of this line feature-class (Rivers) is to represent the rivers or a segment of a river included in a given hydrogeological analysis. Therefore, apart from the spatial dimension of the surface water this feature class includes attributes of the surface water bed such as hydraulic conductivity or thickness of its bed layer. This feature class can be related to the rivers or to the river basin defined in accordance with the WISE reference GIS dataset (e.g.
LargeRiver, RiverBasinDistrict). IV.2. Lakes
As with Rivers, this polygon feature-class (Lakes) represents the lakes or portion of a lake included in a given hydrogeological analysis and contains the information required for an aquifer-lake relationship. Finally, this feature can also be related to Lakes defined by the WISE reference GIS dataset (e.g. LargeLakes, MainLakes).
IV.3. Lake/River/SeaPoints
These feature classes represent point features located in a Lake, River or SeaPoint
where an observation has been made. Apart from the spatial information of these observation points, these feature classes contain information on the lake or river point type (monitoring station, sampling site), accessibility, etc.
IV.4. Surface water Observations&Measurements
This dataset follows the same system and structure as
GwObservations&Measurements described above. Consequently, these tables
(SurfWaterObservations and SurfWaterMeasurements) store a wide variety of hydrological data such as water flow and water level measurements together with information about the gauging stations or the sampling points.
V. Hydrometeorological components
The location and attributes of a meteorological station is stored in the point feature class termed MeterologicalStation. The different observations and measurements obtained (e.g temperature, precipitation) are linked to this table and follow the same system and
structure as the GwObservations&Measurements or the
SurfWaterObservations&Measurements.
2.3.1.2 Entering the data
40
or “massive data”. Digital data (other database or spreadsheets) can be transferred to the geospatial database through the use of intermediate conversion tables or existing wizards of ArcGIS following an entry protocol. If the data are hand written, they should be introduced manually using assisted menus.
In order to avoid errors when introducing data and in order to improve the harmonisation and the analysis of the hydrogeological data, data control procedures were developed. For instance, several permissible value lists were introduced to facilitate the encoding following recommendations of existing standards and directives (e.g. INSPIRE, OneGeology, etc.). In addition, some classes and their attributes provided by those standards were imported to guarantee future data exchanges
Finally, a protocol to reference the original source of information (e.g. maps, technical reports, scientific journal, files, etc) was also established in order to allow the user to consult the source documentation.
2.3.1.3 Querying the data
To facilitate data retrieval and expedite the spatial analysis process of the hydrogeological data, a series of GIS-based tools and other specific query forms were developed and will be discussed below. Other spatial and non-spatial queries may also be generated from the geodatabase by using the inherent capabilities of ArcGIS and/or by using the standardised MS Access query builder. Interested readers are referred to further documentation of ArcGIS and MS Access in order to perform other queries.
2.3.2 GIS-based tools
This set of analysis tools was developed as an extension of the ArcMap environment (ArcGIS; ESRI 2010). They were created with ArcObjects, which is a developer kit for ArcGIS, based on Component Object Model (COM), and programmed in Visual Basic using the Visual Studio (Microsoft) environment (see Velasco et al., 2012b, Velasco et al., 2013a).
They were set up to manage, visualise, analyse, interpret and pre and post process the data stored in the spatial database. This set of tools is separated into three main modules represented by different toolbars integrated into ArcMap termed HEROS, QUIMET and HYYH. 2.3.2.1 Geological Analysis Tools (HEROS):
41
correlation tools. Thus, an interactive analysis environment is created, where the user is able to analyse and to define the possible existing correlation surfaces, units, and faults. These spatial elements can then be converted within a 3D environment and can be visualized in the same ArcGIS platform (ArcScene) or easily exported to external platforms such as GID for further analyses. Finally, hydraulic conductivity can be computed automatically (with the Tools for the hydraulic conductivity estimation) based on textural properties of each lithological interval defined in the boreholes or for each unit defined (for further information see Velasco et al., 2012b).
2.3.2.2 Hydrochemical Analysis Tools (QUIMET)
The second module (QUIMET) is composed of a set of instruments for analysis that cover a wide range of methodologies for querying, interpreting and comparing groundwater quality parameters(Velasco et al., 2013a).The Spatial QUIMET tools include chemical time-series analyses, ionic balance calculations, correlation of chemical parameters, and calculations of various common hydrogeochemical diagrams (e.g. Schöeller-Berkaloff, Piper, Stiff). The GIS platform allows us to generate maps representing the spatial distribution of several hydrogeochemical parameters and of the aforementioned specific hydrogeochemical diagrams. Moreover, it is also possible using Statistical QUIMET Tools, to perform a complete statistical analysis of the data including descriptive statistic ,univariate and bivariate analysis, the generation of correlation matrices of several components, calculation of correlation graphics, etc.
Finally, other instruments enable us to automatically retrieve the information necessary to perform subsequent calculations with external software such as MIX code or EASYQUIM (GHS, 2013b).
2.3.2.3 Hydrogeological Analysis Tools (HYYH)
42
Figure 2.5. Sketch representing the toolbar implemented in ArcMap and its main components (ChooseSU, GwObservations and Pumping and Tracer Query) created to facilitate the analysis and interpretation of the hydrogeological data.
I. ChooseSU
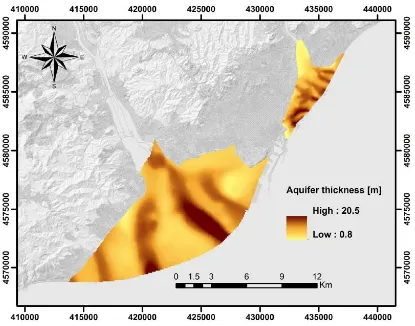
43
Figure 2.6. Map representing the main Aquifers thickness of the Besòs Delta Complex and of the Llobregat Delta Complex included in the metropolitanean area of Barcelona (NE, Spain).
II. GwObservationQuery
This set of tools (see Fig.2.7) enables us to calculate the minimum, maximum, average and standard deviation for each selected parameter (e.g. head level, depth to the water level) for a given period of time and for a point or a group of selected points. Besides, it allows us to represent these values in a map as spatial features (the number of GwPoints with information used is also displayed in the map). As with the results of the aforementioned command, these can be easily used for further analyses in the same ArcMap environment (e.g. using
[image:44.595.118.533.87.413.2]44
[image:45.595.85.509.137.444.2]obtain the aforementioned calculations for different periods of time for a given observation point.
45
Figure 2.8. Piezometric map of the shallower aquifers of the urban area of Barcelona
III. Pumping and Tracer Query
This set of instruments was designed to facilitate the data retrieval of the groundwater points involved in a given pumping and/or tracer test (see Fig 2.9).
It consists on a multi-criteria query forms that enables the user to analize different data and interpretations derived from pumping and tracer tests (such as transmissivity, storativity, etc) and to represent these values in a map as point feature (see Fig.2.10). As results this maps can be analyze together with the values of permeability and transmissivity obtained by using the Tools for the hydraulic conductivity estimation (HEROS).
46
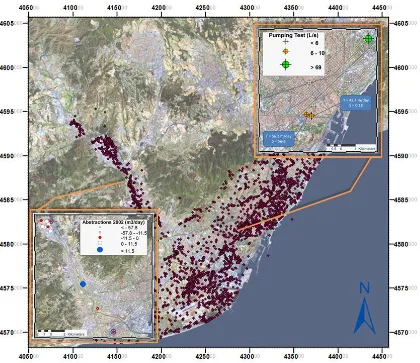
[image:47.595.122.527.86.386.2]47
Figure 2.10. Map representing some values of abstractions and some results of hydraulic parameterization performed from pumping tests, queried and mapped by the HYYH tools in the urban area of Barcelona (NE Spain).
2.3.3 Storing the results: Interpreted data set.
This dataset represents the geometry and attributes of the different interpretations derived from the data stored in the database by using the aforementioned GIS-based tools and other inherent instruments provided by ArcGIS. This dataset is stored separately to allow additional interpretations and at the same time to act as a framework for a new project. In general terms, all the components include the following information: a) methodology used, b) the person/entity or poject responsible for the interpretation, c) date of the phenomenon and d) date when a version of the spatial objects was inserted or changed.
[image:48.595.89.509.86.449.2]