1 A CAPILLARY ELECTROPHORESIS-TANDEM MASS SPECTROMETRY METHODOLOGY FOR THE DETERMINATION OF NON-PROTEIN AMINO ACIDS IN VEGETABLE OILS AS NOVEL MARKERS FOR THE DETECTION OF ADULTERATIONS IN OLIVE OILS.
LAURA SÁNCHEZ-HERNÁNDEZ, MARIA LUISA MARINA, ANTONIO L. CREGO *
Department of Analytical Chemistry, Faculty of Chemistry, University of Alcalá. Ctra. Madrid-Barcelona Km. 33.600, 28871 Alcalá de Henares (Madrid), Spain.
*Corresponding author (phone + 34-918855076; fax + 34-91-8854971; e-mail [email protected])
Keywords: Capillary Electrophoresis; Corn; Mass Spectrometry; Non-protein amino acid;
Oil; Olive; Soybean; Sunflower.
Accepted, revised and published in "Journal of Cromatography A",
2 Abstract
A new analytical methodology based on capillary electrophoresis-mass spectrometry (CE-MS2) is presented in this work, enabling the identification and determination of six non-protein amino acids (ornithine, β-alanine, GABA, alloisoleucine, citrulline and pyroglutamic acid) in vegetable oils. This methodology is based on a previous derivatization with butanol and subsequent separation using acidic conditions followed by on-line coupling to an ion trap analyzer for MS2 detection established through an electrospray-coaxial sheath flow interface. The electrophoretic and interface parameters were optimized obtaining the separation of all compounds in less than 15 min and with resolutions higher than 5. The proposed method was validated by assessing its accuracy, precision (RSD < 7% for corrected peak areas), LODs and LOQs (between 0.04-0.19 ng/g and 0.06-0.31 ng/g, respectively) and linearity range (R2 ˃
3 1. Introduction
Non-protein amino acids are naturally occurring amino acids of low molecular weight which are not usually found as protein constituents. The number of known non-protein amino acids is quite large, more than 800, and their origins are diverse as are their functions [1]. Most of them have been isolated from plants, foods, fungi, and microorganisms and they are usually considered as secondary compounds [2]. The nutritional and agricultural importance of non-protein amino acids lies in the fact that many occur in plants grown for food and fodder and can have beneficial as well as toxic properties. Thus, some of these compounds, such as ornithine and homoserine, are recognized as intermediates or end products in the synthesis of protein amino acids or in primary metabolism in both plants and animals [2,3], other can play roles as defensive agents, as antibacterial or antifungal, or as drugs for the treatment in human diseases (e.g. L-DOPA) [4-6] while some of them can present toxic properties (e.g. mimosine) [7-9].
The importance of olive oil and in particular the extra virgin olive oil has been correlated with its benefits in human health [10-12]. A relevant aspect of oil authenticity is adulteration of extra virgin olive oils with lower price oils which is prohibited by European regulations [13]. Thus, the genuineness of olive oils is a very important aspect from the point of view of quality and marketing.
To establish their authenticity, a wide number of chromatographic (as HPLC, GC, HPLC-MS, GC-HPLC-MS, or CE) [14] or spectrometric techniques (as fluorescence, NMR, Raman, Infrared, MS or chemiluminiscence) followed by multivariate statistical analysis of the data obtained [15] have been described.
4 [19-23] have been described for the authentication of olive oils blended with soybean, sunflower or corn oil, being the saponifiable fraction (98.5-99.5% of the oil) the most studied part. Thus, by GC-MS, fatty acids [16,17] and volatile compounds [18] have been described as markers. In these methods, adulterations with seed oils up to 1% (w/w) previous the derivatization of the fatty acids to methyl esters were detected [17] and up to 0.01% (w/w) was identified following two chemometric approaches to carefully interpret the wide accumulated data obtained (566 samples) and to detect subtle differences among them [14]. On the other hand, using HPLC-MS, triacylglycerols [19,20], the alcoholic fraction [21], glycerophospholipids [22] and sterols [23] have been reported. However, only the works using triacylglycerols as markers demonstrated the possibilities of the developed methods for detecting mixtures of olive oils with seed oils up to 1% (w/w) followed by a multivariate method [19].
Although the presence of amino acids as minor components in vegetable oils has been described by direct infusion MS [24] and HPLC-UV [25] methods, the presence of non-protein amino acids in vegetable oils has not been reported.
The aims of this work were the following: (i) to develop a sensitive method based on capillary electrophoresis with MS detection (CE-MS) enabling the simultaneous determination of six non-protein amino acids in vegetable oils, (ii) to apply the developed method to investigate their presence in oils, and (iii) to propose these compounds as novel markers for the detection of adulterations in olive oils.
2. Experimental 2.1 Chemicals
5 and 25% (v/v) ammonium hydroxide solution were supplied from Merck (Darmstadt, Germany). Formic acid was from Riedel-de Häen (Seelze, Germany). γ-Aminobutyric acid (GABA) and β-alanine were supplied from Sigma (St. Louis, MO, USA). Pyroglutamic acid, alloisoleucine, ornithine, citrulline and hydrogen chloride/1-butanol solution were from Fluka (Buchs, Switzerland). Distilled water was deionized by using a Milli-Q system (Millipore, Bedford, MA, USA).
2.2 Standards and samples
The stock standard solutions of non-protein amino acids were prepared from a 1 mg/mL solution in acetonitrile/water (40:60, v/v) and diluting them to the desired concentration. These solutions were stored at room temperature before use. 500 µ L of the standard solutions were evaporated at 80 ºC and 15 mbar in an eppendorf tube before to their derivatization.
Arbequina, Picual, and Hojiblanca extra virgin olive oils, refined sunflower oils, refined corn oils and refined soybean oils were acquired in different supermarkets (Madrid, Spain) from different trademarks. See Table 1 for more information.
6 2.3 Derivatization procedure
In MS methods, the butylation of amino acids containing mono- and dicarboxylic acid groups greatly improves ionization efficiencies and hence analytical sensitivity [27]. Moreover, esterification improves the mass differentiation among the analytes increasing the selectivity.
The butyl ester derivatization was adapted from a previous procedure [28]. Thus, butanol derivatizing agent was added to the evaporated extract of the samples (0.5 mL to standards and 1 mL to real samples) and shaken in a vortex. Then, the reaction was carried out in an oven at 80 ºC during 30 min. After 5 min in freezer at -4ºC to stop the reaction, the derivatization agent excess was evaporated in a concentrator at 80 ºC to dryness. Finally, reconstitution of analytes was achieved in 500 µl of acetonitrile/water (40:60, v/v).
2.4 Capillary Electrophoresis-Mass Spectrometry conditions
The analyses were carried out in a HP3DCE instrument (Agilent Technologies, Palo Alto, CA, USA) coupled through an orthogonal electrospray interface (ESI, model G1607A from Agilent Technologies, Palo Alto, CA, USA) to an 3D Ion Trap mass spectrometer (model 1100 from Agilent Technologies, Palo Alto, CA, USA) for MS detection. LC/MSD Trap Software 5.2 was used for MS control and data analysis. Uncoated fused-silica capillaries of 50 µm id with 60 cm of length were used. Before first use, a new capillary was conditioned by rinsing at 1 bar with 1 M NaOH for 20 min, then with water for 5 min and 0.1 M HCl for 5 min and finally with buffer (0.1 M formic acid pH = 2.0) for 30 min. After each run, the capillary was rinsed at 1 bar for 2 min with buffer. Injections were made at the anodic end using a N2
pressure of 50 mbar for 50 s. The electrophoretic separation was achieved with a voltage of 25 kV (positive polarity). The temperature of the capillary was kept constant at 25 °C.
7 Electrical contact at the electrospray needle tip was established using a sheath liquid based on isopropanol:water (50:50, v:v) with 0.1 % formic acid and delivered at a flow rate of 3.3
µL/min by a syringe pump (model 100, Holliston, USA) with SGE syringe of 10 mL from Supelco (Bellefonte, PA, USA). The nebulizer and drying gas conditions were 2 psi N2 and 3
L/min N2 at 300 ºC. The mass spectrometer operated with the ESI source in the positive ion
mode (4.5 kV) and the m/z range scanned was from 50 to 280. The ion trap parameters were programmed in “smart mode” (software mode that provides automatic optimization of some ion trap parameters for precursor ions) with 50 % of compound stability and 100 % of trap drive level. Finally, the ion charge control mode operated to accumulate 100000 ions, for a maximum accumulation time of 300 ms with one scan. The fragmentation was carried out by collision induced dissociation with the helium present in the trap for 10 ms with fragmentation amplitude of 1.00 V, and isolation width of 4.0 m/z to obtain MS2 spectra during the run in Multiple Reaction Monitoring (MRM) mode. Extracted ion electropherograms (EIEs) were obtained using a smoothed option of the software (Gauss at 1 point).
3. Results and discussion 3.1 Derivatization Optimization
8 influence of the temperature and the derivatization time were investigated from 60 to 100 ºC (60, 70, 80, and 100ºC) and from 10 to 30 min (10, 20, 30 min), respectively. As can be seen in Table 2, from values of 80 ºC and 30 min the percentage of the derivatization reaction was 100% being these conditions chosen as optimal to achieve the derivatization of the amino acids.
3.2Identification of non-protein amino acids
Six non-protein amino acids: citrulline, ornithine, pyroglutamic acid, β-alanine, GABA and alloisoleucine were chosen for their determination in vegetable oils because they have been identified in sunflower seeds (β-alanine, alloisoleucine, GABA, pyroglutamic acid) [29], soybean seeds (β-alanine, GABA, ornithine, citrulline) [30,31] and/or corn seeds (GABA, β -alanine, ornithine and pyroglutamic acid) [32].
The first experiments were carried out individually in order to identify the spectra of the different derivatized amino acids in MS and MS2 modes. The selected buffer was formic acid 0.1 M (pH 2.0) due to the fact that all the amino acids presented positive charge at acidic pH. All derivatized amino acids were identified, although for pyroglutamic acid a non-expected quasi-molecular ion was produced during the derivatization (m/z 260). Fig. 1 shows the proposed structures of the six derivatized amino acids. Note that due to the formation of the butyl derivative of the amino acids, the quasi-molecular ions have sizes (≥ 150 m/z) where the MS background noise is usually lower [33]. Once confirmed the quasi-molecular ions in MS mode, MS2 experiments were performed. Fig. 1 illustrates the MS2 spectra obtained for the six non-protein amino acids and the fragmentations of each molecule. These fragmentations were studied by MSn experiments to elucidate the fragmentation pattern of the precursor ions. Thus, neutral losses of m/z 56 corresponding to the derivatizing agent (CH3CH2CH=CH2) were
9 ammonia and or CO2 molecules were also generated. For citrulline only the rupture of
ammonia generated a stable compound of m/z 215. Finally, for pyroglutamic acid, the MSn experiments also allowed to identify the quasi-molecular ion. Thus, MS3 spectra using as precursor ions m/z 260 (in MS1) and m/z 242, 186, 158 and 130 (in MS2) concluded that pyroglutamic acid was derivatized with a double butyl chain and its quasi-molecular ion at m/z 260 contained a water molecule which was not completely desolvated during the ionization. Figure 2 shows the complex fragmentation pattern for pyroglutamic acid. As it can be seen, from m/z 242 two neutral losses of m/z 56 resulted in the product ions of m/z 186 and 130, respectively. The product ion 158 was obtained by a neutral loss of m/z 102 from m/z 260. Finally, the product ion m/z 84 was obtained by the decarboxylation from ion m/z 130 and by a neutral loss of m/z 56 and a water molecule from ion m/z 158.
3.3 Optimization of Capillary Electrophoresis-Mass Spectrometry conditions.
The separation conditions were optimized with mixtures of the six standard non-protein amino acids in order to obtain the maximum signal to noise (S/N) ratio and resolution between compounds. The first experiments in MS mode showed the following order of elution of the derivatized compounds: ornithine, β-alanine, GABA, alloisoleucine, citrulline and pyroglutamic acid. When a capillary of 60 cm was used (minimum possible length for the CE-MS equipment), resolutions higher than 5 between peaks were achieved in about 13 min as it can be seen in Fig. 3A.
10 scans averaged from 1 to 3 and the fragmentation time between 10 and 40 ms were studied. With lower values of maximum accumulation time and scans averaged, the points per peaks increased, however, the S/N decreased and the precision got worse. The chosen optimal conditions were 300 ms, one scan and fragmentation time of 10 ms to obtain at least 12 points per peak and RSDs of S/N lower than 10%.
Moreover, in order to increase the sensitivity for real samples, after the derivatization, the samples were reconstituted in acetonitrile/water (40:60, v/v) to carry out a stacking sample preconcentration according to our previous work [26]. Thus, a hydrodynamic injection of 50 s was employed. Fig. 3B illustrates the MS2 electropherograms for the compounds in MRM mode under the optimal conditions.
3.4 Analytical characteristics of the method
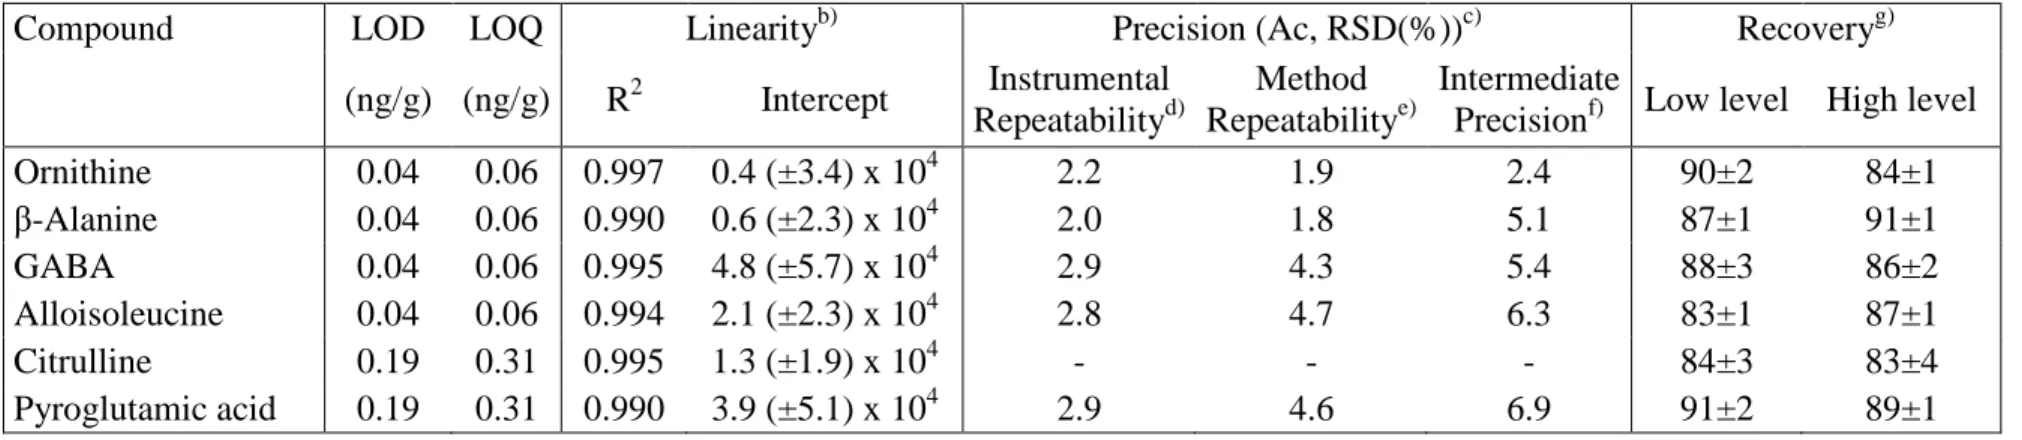
The method was validated in terms of selectivity, limit of detection (LOD), limit of quantitation (LOQ), linearity, precision and accuracy.
There are two reasons for considering the selectivity of the method developed as excellent. The first one is that it enables to reach a resolution among the amino acids exceeding base-line separation (see Fig. 3). The second is that according to the EC Decision about analytical methods operation and results interpretation [34], the unequivocal analysis of the compounds was possible monitoring at least two precursor-product ion transitions using MS2 experiments, except in the case of citrulline, where only one transition was achieved.
11 committing a false positive or false negative. Table 3 shows the values for these limits obtained for the solutions previous to their derivatization.
The linearity was established using the external standard calibration method from six standard solutions containing the amino acids from their LOQ to 100 times the LOQ. The solutions were injected in triplicate and checked for linearity during three days. Calibration curves were established by considering the corrected peak areas (Ac, peak area to migration time ratio) from the EIEs. Satisfactory results were obtained in terms of linearity with a correlation coefficient higher than 0.99 for the average calibration plot, and with all the confidence intervals at 95% for intercept, including the 0 value (see Table 3).
The precision study was carried out for a real sample of a seed oil containing the amino acids as a sunflower oil (RSO-1) and was evaluated in terms of instrumental repeatability, method repeatability and intermediate precision (see Table 3). The calculated values of relative standard deviations (RSDs in %) for corrected peak areas, without including citrulline which was not detected in the samples, were lower than 3% and 7.0% for instrumental repeatability and intermediate precision, respectively.
The accuracy of the method was evaluated as the recovery obtained for each amino acid when a representative extra virgin olive oil (HEVOO-1) was spiked with 0.125 ng/g and 12.5 ng/g of each amino acid. The samples were injected in triplicate. Values of recovery ranging from 83% to 91% with RSDs ≤ 4% were obtained (see Table 3).
3.5 Determination of non-protein amino acids in vegetable oils
12 interferences in vegetable oils was demonstrated previously by CE-UV [26]. Thus, it was performed by the injection of two different sample solutions for each vegetable oil sample: the sample solution and the spiked sample containing a known amount of amino acids (0.1 µ g/mL of citrulline, GABA and alloisoleucine, and 1 µ g/mL of ornithine, β-alanine and pyroglutamic acid). Table 4 shows the results obtained in the analyzed samples. Ornithine, β-alanine, GABA, alloisoleucine and pyroglutamic acid were determined for the first time in soybean, corn and sunflower oils while citrulline was not detected in these oils. The highest content was obtained for pyroglutamic acid and the lowest for GABA, being this about 10 times lower. For extra virgin olive oils, β-alanine, GABA and pyroglutamic acid were determined although with contents around 7, 5 and 12 times lower than in seed oils, respectively. These results are in agreement with the literature confirming the traceability of these non-protein amino acids from sunflower, soybean and corn seeds to their corresponding oils, except in the case of citrulline detected in soybean seeds but not in oils.
13 4 Concluding remarks
A very sensitive method CE–ESI-MS2 for the simultaneous determination of six non-protein amino acids in vegetable oil samples was developed. Adequate analysis time (less than 15 min) and acceptable precision of the developed method were obtained (RSD < 7%). Excellent LODs were obtained, between 0.04 and 0.19 ng/g. Ornithine, β-alanine, GABA, alloisoleucine and pyroglutamic acid were determined in soybean, corn and sunflower oils while citrulline was not detected in these oils. β-Alanine, GABA and pyroglutamic acid were determined in extra virgin olive oils while ornithine, alloisoleucine and citrulline were not detected. Thus, ornithine and alloisoleucine are proposed as novel markers for the detection of adulterations of olive oils with seed oils such as soybean, corn and sunflower oils. The developed method is the first one in which the possibilities of CE-MS to investigate olive oil adulterations have been demonstrated and shows a high potential to easily assess the quality of olive oils.
Acknowledgement
14 References
[1] S. Hunt, in: G.C. Barrett (Ed.), The Non-protein Amino Acids, Chapman and Hall, London and New York, 1985, pp. 55.
[2] E.A. Bell, J. Agric. Food Chem. 51 (2003) 2854. [3] P.J. Lea, R.D. Norris, Phytochemistry 15 (1976) 585. [4] J. Goole, K. Amighi, Int. J. Pharm. 380 (2009) 1.
[5] L. Tosi, R. Luigetti, A. Zazzerini, J.Phytopathol. 146 (1998) 295. [6] S.U. Schenk, F. Lambein, D. Werner, Biol. Fert. Soils, 11 (1991) 203.
[7] P.R. Nunn, E.A. Bell, A.A. Watson, R.J. Nash, Nat. Prod. Commun. 5 (2010) 485. [8] D.N. Roy, Nutr. Abstr. Rev. - Ser. A 51 (1981) 691.
[9] M.M.J. Champ, Br. J. Nutr. 88 (2002) S307.
[10] G. Bruckner, in: C.K. Chow (Ed.), Fatty Acids in Foods and Their Health Implications, Marcel Denker, New York, 2000, pp. 843.
[11] R.W. Owen, A. Giacosa, W.E. Hull, R. Haubner, G. Wurtele, B. Spiegelhalder, H. Bartsch, Lancet Oncol. 1 (2000) 107.
[12] J.M. Martin-Moreno, W.C. Willett, L. Gorgojo, J.R. Banegas, F. Rodriguez-Artalejo, J.C. Fernandez-Rodriguez, P. Maisonneuve, P. Boyle, Int. J. Cancer 58 (1994) 774. [13] European Communities. Regulation 865/2004. Off. J. Eur. Communities: Legis. 206
(2004) 37.
[14] R. Aparicio, R. Aparicio-Ruiz, J. Chromatogr. A 881 (2000) 93.
[15] I.S. Arvanitoyannis, A. Vlachos, Crit. Rev. Food Sci. Nutr. 47 (2007) 441.
[16] J. Gamazo-Vazquez, M.S. Garcia-Falcon, J. Simal-Gandara, Food Control 14 (2003) 463.
15 [19] M. Lisa, M. Holcapek, M. Bohac, J. Agric. Food Chem. 57 (2009) 6888.
[20] M. Fasciotti, A.D.P. Netto, Talanta 81 (2010) 1116.
[21] M.J. Lerma-Garcia, G. Ramis-Ramos, J.M. Herrero-Martinez, J.V. Gimeno-Adelantaido, E.F. Simo-Alfonso, J. Chromatogr. A 1216 (2009) 230.
[22] S. Boukhchina, K. Sebai, A. Cherif, H. Kallel, P.M. Mayer, Can. J. Chem.-Rev. Can. Chim. 82 (2004) 1210.
[23] A.S. Carretero, A. Carrasco-Pancorbo, S. Cortacero, A. Gori, L. Cerretani, A. Fernandez-Gutierrez, Eur. J. Lipid Sci. Technol. 110 (2008) 1142.
[24] M.J. Lerma-García, G. Ramis-Ramos, J.M. Herrero-Martínez, E.F. Simó-Alfonso, Rapid Commun. Mass. Spectrom. 21 (2007) 3751.
[25] V. Concha-Herrera, M.J. Lerma-García, J.M. Herrero-Martínez, E.F. Simó-Alfonso, Food Chem. 120 (2010) 1149.
[26] L. Sánchez-Hernández, P. Puchalska, C. García-Ruiz, A.L. Crego, M.L. Marina, J. Agric. Food Chem. 58 (2010) 7489.
[27] D.H. Chace, Chem. Rev. 101 (2001) 445.
[28] D. H. Chace, T. Lim, C.R. Hansen, V.R. De Jesus, W.H. Hannon, Clin. Chim. Acta 407 (2009) 6.
[29] C.H. Oh, J.H. Kim, K.R. Kim, T.J. Mabry, J. Chromatogr. A 708 (1995) 131.
[30] C. Martínez-Villaluenga, Y.-H. Kuo, F. Lambein, J. Frías, C. Vidal-Valverde, Eur. Food. Res. Technol. 224 (2006) 177.
[31] C. Hernandez-Sebastia, F. Marsolais, C. Saravitz, D. Israel, R.E. Dewey, S.C. Huber, J. Exp. Bot. 56 (2005) 1951.
[32] V. Lozovaya, A. Ulanov, A. Lygin, D. Duncan, J. Widholm, Planta 224 (2006) 1385. [33] M. Castro-Puyana, C. Garcia-Ruiz, A.L. Crego, M.L. Marina, Electrophoresis, 30
16 [34] Commision Decision 2002/657/EC, 2002.
17 Figure Captions
Fig. 1. MS2 spectra and structure of precursor ions for each non-protein amino acid are shown. CE conditions: BGE, 0.1 M formic buffer (pH 2.0); uncoated fused-silica capillary, 50 µm ID×85 cm; injection by pressure at 50 mbar×15 s; applied voltage, 25 kV; temperature, 25 ºC. ESI conditions: positive ion mode; spray voltage, 4.5 kV; sheath liquid, isopropanol/water (50/50 v/v) with 0.1% formic acid at 3.3 µ L/min; drying gas flow, 3 L/min; drying temperature, 300 ºC; nebulizer pressure, 2 psi. Ion trap conditions: maximum accumulation time, 300 ms; averages, 3; scan, 50-350 m/z; MS2 transitions with width, 4 m/z; fragmentation amplitude, 1.00 V; fragmentation time, 40 ms.
Fig. 2. MS2 fragmentation pattern of pyroglutamic acid.
Fig. 3. A) CE-MS base peak electropherogram for standard amino acids mixture of 5 µ g/mL each one (injection by pressure at 50 mbar×15 s). B) Simultaneous CE-MS2 EIE for a standard amino acids mixture of 5 µg/mL each one (injection by pressure at 50 mbar×50 s). CE Conditions: uncoated fused-silica capillary, 50 µm ID×60 cm; Other CE conditions and ESI conditions as in Fig. 1. Ion trap conditions: maximum accumulation time, 300 ms; averages, 1; scan, 50-280 m/z. MS2 transitions in MRM mode with width, 4 m/z; fragmentation amplitude, 1.00 and fragmentation time, 10 ms. Peak 1. Ornithine, 2. β -Alanine, 3. GABA, 4. Alloisoleucine, 5. Citrulline and 6. Pyroglutamic acid.
18 Fig. 1. 69.4 86.2 0.0 0.5 1.0 1.5 2.0 7 x10 Intens.
100 150 200 250 300 m/z
O
O C
H3
N H3 +
CH3
CH3
86 69
Derivatized alloisoleucine
[MH]+(m/z 188) +MS2 (188.0)
87.2 143.0 0 1 2 3 6 x10 Intens.
50 100 150 200 250 300 m/z
O
O
CH3
N H3 +
143 87
Derivatized GABA
[MH]+(m/z 160) +MS2 (160.0)
84.2 130.0 158.0 186.0 242.1 0 1 2 3 4 7 x10 Intens.
50 100 150 200 250 300 m/z
Derivatized pyroglutamic acid +MS2 (260.0)
[MH]+(m/z 260)
N+ O C H3 H H O CH 3 O OH3 130 242 84, 158 186 215.1 0 1 2 3 7 x10 Intens.
50 100 150 200 250 300 m/z
Derivatized citrulline
[MH]+(m/z 232) +MS2 (232.0)
N H3
+
NH O CH3
O N H2 O 215 72.3 90.2 0 1 2 3 5 x10 Intens.
100 150 200 250 300 m/z
Derivatized β-alanine
O
O N
H3 +
CH3
90
72 [MH]+(m/z 146)
+MS2 (146.0)
70.4 115.1 172.0 0.0 0.2 0.4 0.6 0.8 1.0 7 x10 Intens.
50 100 150 200 250 300 m/z
Derivatized ornithine
[MH]+(m/z 189) +MS2 (189.0)
N
H3 + O CH3
19 Fig. 2.
C H2
CH3
+ CO2
N+ O C H3 H H O CH 3 O OH3
Derivatized pyroglutamic acid C13H26NO4 (260 m/z)
C13H24NO3(242 m/z)
C H2
CH3
H2O
N+ O O CH3 O H H N+ O O OH H H
C4H6NO (84 m/z)
C8H16NO2(158 m/z) C9H16NO3 (186 m/z)
C5H8NO3(130 m/z)
C H2 CH3 HCOOH C H2 CH3
H2O
N+ H H O N+ O C H3 H H O CH 3 O N+ O C H3
H OHH 3
+
+ +
+
+ +
+ C4H6NO (84 m/z)
N+
H H
20 Fig. 3. 0.0 0.5 1.0 5 x10 Intens. 0 1 2 3 5 x10 0.0 0.5 1.0 5 x10 0.0 0.5 1.0 1.5 5 x10 0.0 0.5 1.0 1.5 5 x10 0 1 2 5 x10
5 10 15 Time [min]
1 3 4 5 6 2
B)
0 5 10 15 Time [min]
0 2 4 6 6 x10 Intens.
BPC 146;160; 188; 189; 232; 260 +MS 1 3 4 5 6 2
A)
EIE 72; 90 +MS2(146.0)
EIE 87;143 +MS2(160.0)
EIE 69; 86 +MS2(188.0)
EIE 70; 115; 172 +MS2(189.0)
EIE 215+MS2(232.0)
21 Fig. 4. 0.0 0.2 0.4 0.6 0.8 1.0 5 x10 Intens.
5 10 15
0.0 0.2 0.4 0.6 0.8 1.0 5 x10
5 10 15
0.0 0.2 0.4 0.6 0.8 1.0 5 x10
5 10 15 Time [min]
Alloisoleucine Alloisoleucine a) b) c) 0 2 4 6 4 x10 Inten s.
5 10 15
0 2 4 6 4 x10
5 10 15
0.0 0.5 1.0 1.5 2.0 4 x10
5 10 15 Time [min]
Ornithine Ornithine Unknown peak Unknown peak Unknown peak a) b) c) A B 70.3 115.1 172.0 0 1000 2000 3000 4000 Intens.
50 75 100 125 150 175 200 225 250 m/z
69.4 86.3 0.0 0.2 0.4 0.6 0.8 1.0 4 x10 Intens.
60 80 100 120 140 160 180 200 220 240 m/z
d) d) +MS2 (189.0)
22
Table 1. Botanical origin, number of samples and name for the vegetable oils samples used in this work.
Origin Number of samples Name
Sunflower oil 3
RSO-1 RSO-2 RSO-3
Corn oil 3
RCO-1 RCO-2 RCO-3
Soybean oil 3
RSYO-1 RSYO-2 RSYO-3 Hojiblanca extra
virgin olive oil 3
HEVOO-1 HEVOO-2 HEVOO-3 Arbequina extra
virgin olive oil 3
AEVOO-1 AEVOO-2 AEVOO-3 Picual extra
virgin olive oil 3
23
Table 2. Optimization of the reaction temperature and time for the derivatization procedure.
% Derivatization reactiona)
Phenylalanine Tryptophan
Temperature of reaction b)
60 ºC 95.1 95.4
70 ºC 97.4 97.6
80 ºC 98.9 98.9
100 ºC 99.0 99.0
Time of reactionc)
30 min 100.0 100.0
20 min 98.9 98.9
10 min 85.4 86.8
a)
% Reaction = 100 x Acderivatized compound/(Acderivatized compound + Acunderivatized compound);
Ac, corrected area
b)
Time of reaction, 20 minutes.
c)
24
Table 3. Analytical characteristics of the CE-MS2 developed methoda).
1
Compound LOD LOQ Linearityb) Precision (Ac, RSD(%))c) Recoveryg)
(ng/g) (ng/g) R2 Intercept Instrumental
Repeatabilityd)
Method Repeatabilitye)
Intermediate
Precisionf) Low level High level
Ornithine 0.04 0.06 0.997 0.4 (±3.4) x 104 2.2 1.9 2.4 90±2 84±1
β-Alanine 0.04 0.06 0.990 0.6 (±2.3) x 104 2.0 1.8 5.1 87±1 91±1
GABA 0.04 0.06 0.995 4.8 (±5.7) x 104 2.9 4.3 5.4 88±3 86±2
Alloisoleucine 0.04 0.06 0.994 2.1 (±2.3) x 104 2.8 4.7 6.3 83±1 87±1
Citrulline 0.19 0.31 0.995 1.3 (±1.9) x 104 - - - 84±3 83±4
Pyroglutamic acid 0.19 0.31 0.990 3.9 (±5.1) x 104 2.9 4.6 6.9 91±2 89±1
2 a)
Experimental conditions as in Fig. 3.
3 b)
Six standard solutions at different concentration levels (LOQ-100LOQ) injected in triplicate during three days. Values in parentheses are
4
confidence intervals at 95%: ±t×sintercept. 5
c)
Ac means corrected peak area (peak area divided by time).
6 d)
Obtained from six consecutive injections of RSO-1in the same day.
7 e)
Obtained from three individual RSO-1 samples injected by triplicate in the same day.
8 f)
Assessed from three individual RSO-1 samples injected in triplicate in three consecutive days.
9
g)
Recovery for HEVOO-1 samples spiked at low level (5 ng of each compound) and at high level (0.5 µg of each compound). Average ±
10
standard deviation (n=3).
11 12
25
Table 4. Botanical origin, name of the vegetable oils samples used in this work and the quantitation of the non-protein amino acids in the samples (n=3). ND: not detected (< LOD).
Quantitation (ng/g) Origin Sample
Name Ornithine β-Alanine GABA Alloisoleucine Citrulline
Pyroglutamic acid
Sunflower oil
RSO-1 2.7 ± 0.3 1.4 ± 0.1 0.5 ± 0.2 0.7 ± 0.1
ND
5.7 ± 0.8 RSO-2 0.8 ± 0.7 1.0 ± 0.1 0.4 ± 0.1 1.2 ± 0.4 4.4 ± 0.5 RSO-3 1.0 ± 0.1 2.8 ± 0.4 0.7 ± 0.2 2.1 ± 0.1 7.2 ± 0.7 Corn oil
RCO-1 1.2 ± 0.2 1.1 ± 0.2 0.5 ± 0.2 5.4 ± 0.7
ND
5.6 ± 0.4 RCO-2 0.9 ± 0.3 2.5 ± 0.2 0.7 ± 0.2 2.8 ± 0.1 7.6 ± 0.9 RCO-3 1.3 ± 0.3 1.5 ± 0.1 0.6 ± 0.1 1.4 ± 0.5 5.6 ± 0.8 Soybean oil
RSYO-1 2.0 ± 0.6 2.0 ± 0.2 0.37 ± 0.01 0.6 ± 0.1
ND
19 ± 1 RSYO-2 0.8 ± 0.1 1.8 ± 0.2 0.62 ± 0.01 1.2 ± 0.1 10 ± 1 RSYO-3 1.0 ± 0.1 1.8 ± 0.3 0.47 ± 0.02 0.7 ± 0.1 13 ± 1 Hojiblanca
extra virgin olive oil
HEVOO-1
ND
0.23 ± 0.01 0.12 ± 0.01
ND ND
0.59 ± 0.01
HEVOO-2 0.25 ± 0.01 0.17 ± 0.04 0.75 ± 0.09
HEVOO-3 0.26 ± 0.04 0.10 ± 0.01 ND
Arbequina extra virgin olive oil
AEVOO-1
ND
0.33 ± 0.01 0.09 ± 0.02
ND ND
0.91 ± 0.02
AEVOO-2 0.22 ± 0.01 0.06 ± 0.01 0.87 ± 0.01
AEVOO-3 0.36 ± 0.05 0.14 ± 0.02 ND
Picual extra virgin olive oil
PEVOO-1
ND
0.23 ± 0.01 0.08 ± 0.04
ND ND
0.41 ± 0.02
PEVOO-2 0.12 ± 0.02 < LOQ ND
PEVOO-3 ND ND ND
Mixtures of HEVOO-1 with
RSYO-3
10% 0.22 ± 0.03 0.48 ± 0.03 0.22 ± 0.01 0.12 ± 0.02
ND