C
C
|
E
E
|
D
D
|
L
L
|
A
A
|
S
S
Centro de Estudios
Distributivos, Laborales y Sociales
Maestría en Economía Universidad Nacional de La Plata
Failures in School Progression
Paula Giovagnoli
Failures
in
school
progression
Paula
Giovagnoli*
February,
2007
Preliminary version. Please do not cite.
I. INTRODUCTION ... 2
AIM OF THE PAPER... 3
II. THE EDUCATION SYSTEM... 4
II.A)BACKGROUND... 4
II.B)STYLISED FACTS... 5
Enrolment Patterns... 6
Non-attendance Rates and Age-grade Distortion... 7
RepetGition, Dropout and Completion Rates ... 11
III. FAILURES IN SCHOOL PROGRESSION... 13
III.A)THE EEJ SURVEY... 13
Educational paths ... 13
III.B)CHARACTERISATION OF DISSIMILAR PATHS... 15
III.C)THE ECONOMETRIC MODEL AND EMPIRICAL RESULTS... 22
The Econometric Model... 22
The empirical results ... 25
IV. CONCLUDING COMMENTS ... 31
ANNEX... 34
PART 1:TABLES... 34
PART 2:VARIABLE DEFINITIONS AND DESCRPITVE STATISTICS... 37
ACKNOWLEDGEMENTS ... 40
I.INTRODUCTION
The relevance of having a solid education system to improve society as a whole is
widely recognised in developed and developing countries.
A solid system involves an appropriate performance not only in the quantitative but
also in the qualitative aspects of human capital formation. The former refers to access
to education and its completion, and the later is more dedicated to understanding
differences in learning measures- albeit imperfect- such as test scores.
While in developed countries mandatory education level is a goal almost achieved,
policymakers in developing countries still have to do a lot in terms of improving
access, and more specifically, designing strategies in order to ensure successful
educational paths for young people.
In fact, as pointed out later in the paper, the examination of basic educational
indicators shows that a high percentage of children in Argentina experience failures
during their educational path, and most of them finally drop out of school.
While these issues are highly relevant in Argentina and a variety of literature is also
available, there are, however, far fewer empirical applications to this effect. The main
limitation usually arises from the lack of data on individual educational trajectories.
During 2005, the National Institute of Statistics and Census - INDEC jointly with
CEDLAS, carried out a specific module (Educación y Empleo de los Jóvenes EEJ)
incorporated into the current household survey (EPH) to young people (15 to 30
years old) living in Greater Buenos Aires. This module aimed to capture educational
path as well as labor market experiences.
Unlike much research on schooling, the EEJ module allows the tracing of individual
education histories from early in life in a retrospective manner. Tracking these paths
is of fundamental importance when education is understood as a cumulative process -
past events have some lasting effect, although their value in explaining output may
Aim of the paper
The objectives of this paper are two-fold. Firstly, to analyse the state of the education
system in Argentina, combining data from different sources, as each of them have
their own strengths and weaknesses. For instance, school census data have the
advantage of being direct reports from state education agencies but do not provide
wide socio-economic information on students, and do not give an estimation of how
many people are out of the system. Using the population Census data it is possible to
fill in the gap, as non-attendance rates by age and gender are easily calculated. This
information, however, is available every 10 years. There are also many contextual
variables (such as household income) that are not collected during the interviews.
Using the household survey it is possible to get that information on a current basis.
Although it covers only main urban areas, it is a good approximation to the urban
census data. With these data, it was also possible to construct a measure to identify
children who are below the modal grade for their age.
Secondly, to closely explore the interrelations between quantitative educational
outcomes and individual characteristics as well as school factors, exploiting the EEJ
database. The research intends to uncover correlations among variables and in this
sense, it is purely a descriptive paper to highlight associations rather than causal
relations.
The next section will provide the readers with the general context of the education
sector, and its origins. Section II.B describes the main stylised facts observed during
recent decades using data from different sources, with special focus on identifying
risk schooling zones for teenagers. Section III explores the new data set that allows
us to characterise dissimilar paths in youth education. The second part of this section
will present a multivariate analysis to identify the groups that are most likely to
having access secondary school and complete it. Findings are discussed by
II.THEEDUCATIONSYSTEM
II.A) Background
The development of the educational system in Argentina has its origins in the
National Constitution of 1853, in which the right to teach and learn was legally
established.
The fourth president of the country, Domingo F. Sarmiento, set the guidelines for the
modern system in the latter half of the nineteenth century, pushing through reforms
that supported school expansion for all citizens.
During the administration of Julio Roca, as an outcome of the Pedagogical Congress,
the Law 1420 of General Common Education was sanctioned on July 8th, 1884
establishing principles for primary schools. This law, a cornerstone in Argentine
history, dictated public, compulsory, free, and secular education “for children
between 6 and 14 yeas of age” (Law 1420, Section 1).
The provinces were responsible for the provision of primary schooling except in the
capital and national territories where education was under the National Education
Council´s responsability.
Differences in the educational performance among provinces sprang up, and so a new
law was introduced in 1905 (Decibe and Canela, 2003). This law allowed the
National Government to create primary schools in the provinces that requested them,
extending the attributes of the National Council of Education beyond the sphere of
the capital, colonies, and national territories.
While the main features of the system were being configured at that time, important
achievements were reflected across the country. The literacy rate rose from 33
percent in 1869 to nearly 50 percent by the turn of the century.
The transformation process was prolonged over time, with an important
administrative reform during 1978 and the transference of primary national schools to
Following the patterns of educational policies in Latin American countries during the
nineties, a new reform program was launched by the Federal Government, resulting
in the following laws: the Education Decentralisation Law (1992), the Federal
Education Law (1993), and the Higher Education Law (1995). These laws were
partially drafted and discussed by diverse sectors of the society during the National
Pedagogical Congress in 1984 and 1987.
Despite the fact that the Federal Education Law had been sanctioned early in the
decade, the implementation began in 1998, and by 2003, only 18 of 24 provinces had
carried out the reform completely. Another 4 provinces have reformed the system
incompletely, while two provinces - Rio Negro and Neuquén- did not conduct a
reform at all.
The reforms covered different areas: (i) the transfer of national responsibilities to the
provinces for secondary and technical education, and teacher training institutions; (ii)
the extension of mandatory education from 7 to 10 years; (iii) the curricular reform
that establishes one year of pre-school, nine years of Basic Education (EGB) and
three years of Polymodal; (iv) the administrative reform; and (v) the higher education
reform.
During 2006, education was again a focus of public debate. The central authorities
proposed the extension of the prescribed period of compulsory attendance (up to the
end of secondary education) as well as the re-formulation of the actual educational
system, in order to return to a structure similar to the previous one: initial education,
primary (7 years of length), and secondary (5/6 years). A new educational law was
passed at the end of that year.
II.B) Stylised facts1
Before advancing in the analysis of factors associated with different youth
educational outcomes, it is useful to give an overview of basic indicators to briefly
1
describe the evolution of the Argentine educational system, widely analysed
elsewhere (Herrán, 2001; Giovagnoli and Kit 2004; Binstock and Cerruti, 2005; Kit,
España and Labate, 2005).
It is important to highlight that although Argentina is a developing country, the
educational sector ranks highly in comparison with other countries. The average
years of schooling of the population aged 15 and over in 2000 were 8.8, significantly
higher than the regional average of 5.9 years (Giovagnoli, Fizsbein Patrinos, 2004).
Argentina also compares well with East and Central Europe and East Asia, where
average educational attainment is 8.4 years and 7.6 years, respectively. (Barro and
Lee 2000).
Enrolment Patterns
According to recent data, the total number of students enrolled in initial, primary and
secondary education in 2004 scaled up to 9,931,029 (74% of the students are in the
public sector), 526,456 teachers (77% in public sector) and 36,333 schools (27,625
are in public schools) 2.
The current figures result from an expansive demand for education during the last
decades, with a higher percentage of young people enrolling in school, especially at
the secondary level during 1991 – 2001. In fact, Table 1 indicates that the enrolment
growth was 33 points higher than the population growth for young people aged 15 to
17.
EGB1, 4th to 6th grade of EGB2 and 7grade of the EGB3)-.Secondary level refers to people attending EGB3 8th grade or 9th grade and or Polimodal.
2
Table 1. Population and Enrolment Growth 1880 -1991 -2001
Age groups
Population Growth
Enrolment Growth
Population Growth
Enrolment Growth 6 to 8 years old 117,9 124,5 106,1 107,6 9 to 11 years old 130,2 132,9 104,2 105,4 12 to 14 years old 139,5 144,8 100,7 108,7 15 to 17 years old 125,1 148,5 108,5 141,5 Source: Giovagnoli and Kit, 2005. Calculations based on National Population Census
1991 – 2001 (1991 base 100) 1980 – 1991
(1980 base 100)
As observed, the enrolment growth has remained higher than the population growth
for all age groups. This occurred even during the 1980s, when population growth
rates recorded higher figures than the following decade, suggesting that the
educational system has proved responsive to the increasing demand. It was in the
early 1980s that the massive transfer of primary schools from the national to the
provincial government took place. What is worth noting is that enrolment rates have
increased significantly since then.
Non-attendance Rates and Age-grade Distortion
The examination of non-attendance rates by the age of the child - from 6 to 17 years
of age for the last three census: 1980, 1991 and 2001(see Figure 1) reveals that 39%
of people aged 15 in 1980 were out of school, while data for 2001 shows that the
Figure 1: Non-attendance rates- 6 to 17 years of age. Total country 0, 0 5, 7 4, 7 4, 3 4, 5 4,
8 6,3
13, 6 25, 8 39 ,4 50, 0 57, 0 5, 4 3, 2 2, 2 2, 2 2, 5 2,
8 4,1
11, 1 20, 6 33, 4 38, 9 47 ,4 3, 9 1, 5 1, 3 1, 2 1, 4 1, 5 2,
2 4,4
8, 1 13, 9 20, 7 27, 6 0,0 10,0 20,0 30,0 40,0 50,0 60,0
6 7 8 9 10 11 12 13 14 15 16 17
Years of Age
1980 1991 2001
Source: Kit and Scasso (2006) based on Censo Nacional de Población, Hogares y Viviendas, 1980, 1991, 2001
There has been, however, little change in “the trend” of non-attendance rates by age.
That is, a common characteristic among 1980, 1991, and 2001 census is that the
higher the school-age the higher the risk of teenagers being out of the system. For
instance, in 1980 the proportion of people aged 14 who were out of school was twice
that of those aged 13 (25.8% and 13.6% respectively). In 2001, 4.4% of the teenagers
(13 years of age) did not attend formal school, while this percentage reached 8.1% for
those who were 14 years of age and 14% for people aged 15. Even when the Federal
Education Law explicitly states mandatory education until 15 years of age, it is
clearly insufficient to ensure effective coverage. Furthermore, there are still
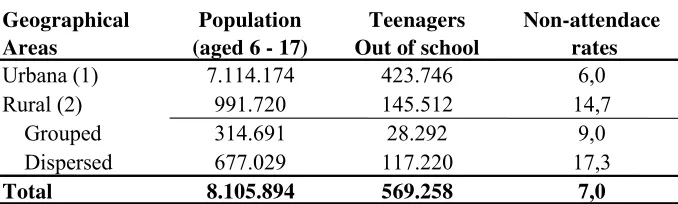
significant differences between geographical areas, as seen in Table 2: the percentage
of 6-17 year olds reporting to be out of school in 2001 is 10,3% higher in rural
dispersed areas than the national average. These differences are also seen among
provinces. In fact, figures in Table 1 in the Annex provide eloquent evidence that
Santiago del Estero, Misiones, Tucumán, Chaco, Formosa and Corrientes are
educationally disadvantaged compared with the rest of the country. In Santiago del
Estero, for instance, 16% of young people aged 6-17 are out of the formal education
system. In Santa Fe, by contrast, this figure is estimated to be at 8%. The situation is
young people in Santiago are not attending schools, following by slightly smaller
numbers in the case of Tucuman (40.7%), Misiones (39.1%) and Chaco (32.8%),
showing that educational disadvantage of youth will continue to concentrate in these
[image:11.595.94.433.200.302.2]particular provinces, unless important changes are introduced.
Table 2. Non-attendace rates by geographical areas. Year 2001
Geographical Areas
Population (aged 6 - 17)
Teenagers Out of school
Non-attendace rates
Urbana (1) 7.114.174 423.746 6,0
Rural (2) 991.720 145.512 14,7
Grouped 314.691 28.292 9,0
Dispersed 677.029 117.220 17,3
Total 8.105.894 569.258 7,0
Source: Own calculation based on Census 2001
(1) Urban population is defined as people living in towns bigger than 2,000 inhabits
(2) Rural population is devided between "Grouped" - towns smaller than 2,000 and "Dispersed" those spread in the countryside
Differences in non-attendance rates may be also observed across the household
income distribution. Census data does not provide a measure of income, thus, the
Official Permanent Household Survey (EPH) - October wave - is used instead.
The survey covers only major urban areas. Although these areas do not exactly match
the census’ total of urban areas, they are a quite good approximation of total urban
population of the country (compared urban figure in Table 2 with Table 3).
The construction of quintiles3 incomes displayed in Table 3 is based on the adjusted
household income to take into account the fact that food needs are different across
age groups within a given household. In the adjustment, the adult equivalent official
scale was applied. Following INDEC methodology, only households with complete
information reported about income were included in the computation.
3
As expected, the lower the quintiles, the higher the non-attendance rates for the
children4. On average, these rates are worse for men than women. This pattern
changes for the richest: the proportion of men outside the formal education system is
[image:12.595.90.449.190.324.2]lower than that of women in the quintiles 3, 4 and 5.
Table 3. Non-attendace and Attendace Rates with Overage by quintiles for men and women aged 6-17
AE Income
Quintiles Total Women Men Total Women Men
1 8,2% 7,9% 8,5% 35,8% 33,3% 38,4%
2 6,3% 5,3% 7,1% 29,0% 26,3% 31,7%
3 3,7% 4,0% 3,4% 23,5% 21,5% 25,6%
4 1,9% 2,4% 1,4% 18,0% 15,2% 20,6%
5 0,9% 0,9% 0,8% 12,3% 10,6% 13,9%
Total 5,1% 4,9% 5,2% 26,2% 23,9% 28,4%
*AE Income= Adult equivalent income. Total household income / total equivalent adults Source: Own calcluations based on EPH - 2000 October Wave
Non-attendace Rates Attendance with Overage
Even for those who are going to school, the micro-data from the household survey
reveals that almost one third of those attending are overage for their current school
grade. Table 3, second panel to the right, shows that correlation is strong between
age-grade distortion and income quintiles. In the lowest quintile, 36% of children are
attending below their age group, while this figure is only 12% in the richest quintile.
No matter which of the quintiles is considered, men perform worse than women, a
result widely found in the literature for developing and developed countries. Table 2
in the annex shows these indicators by simple age, stressing the rapid increase in
non-attendance rates from 15 years of age and upwards as well as the importance of the
percentage of young people overage with their class.
Age-grade distortion may reflect a number of factors, including delayed primary
school entry, grade repetition and/or schooling interruptions. Using school census
data from the annual collection carried out by the National Ministry of Education
since 1997, it is possible to evaluate trends in these basic indicators of repetition,
inter-annual drop out and promotion rates by grade.
Repetition, Dropout and Completion Rates
As is clear from Table 3.A in the Annex, repetition is quite common at the begging of
school (EGB1 and EGB2): around 9% of students repeated at least the first grade,
with a stable percentage between 1997 and 2003. More importantly, the probability
of repetition is decreasing across grades during primary school: the repetition rate is
10% for first grade and 4.3% for the six grade.
This last result points to the importance of exploring how early repetition rates are
related to subsequent educational outcomes, an issue that will be analysed in more
detail later in the paper .
Table 3.B (Annex) contains inter-annual drop out rates. The figures recorded for the
first grades tend to be lower than those recorded for higher levels of education (as
EGB3 and Polimodal). In fact, these rates show a steady rise from grades 8th onward,
reaching 27% for the last year of Polimodal. This indicates that drop out is occurring
mostly at secondary school. This picture is quite similar for different years, except
that since 1999, inter-annual rates recorded in grade 8th are much lower than before.
This may reflect in part the application of the new structure in education, allowing
the system to retain pupils one year more than previously.
Finally, completion rates -as expected - are relatively low in the advanced grades.
There is not much pattern across the years except for an improvement in the 8th
grades since 1997/8. In 1997, completion rate in 8th grade was 76%, while in 2001 it
reached a peak (80.3%). Most recent data show, however, that this trend is in reverse.
The current completion rate for 8th grade is again closer to previous figures (76.7%).
There is still a constant tendency of low completion rates in EGB3 and Polimodal,
and in some cases, the situation is actually worse. Furthermore, looking at various
source data to compare different birth cohorts since early in time, Binstok and Cerruti
(2005) remark that the high levels of schooling reached in the last two decades have
not been translated into equivalent rates of completion, thus the probability of
dropout from secondary school did not vary.
The next figure draws together some issues already discussed, identifying key zones
in schooling life (Kit et.al, 2005). It combines different information: (i) from census
data - population by age – which is quite stable during the around 650.000 births, (ii)
data from the education system: enrolment by grade and (iii) enrolment with the right
age by grade. The red area captures special enrolments (such as adult schooling), to
[image:14.595.92.485.243.437.2]see whether those who drop out of schools may enter the adult educational system.
Figure 3. Enrolment and population by age. Year 2001. Total country.
381.518 674.904 720.741 615.888 586.649 576.728 554.748 507.904 483.249 445.945 391.339 325.483 262.425 233.526 381.518 674.904
795.799 790.042 787.923 758.611
703.878 695. 451 722.994 635.713 557.556 448.016 382.229 862.875 0 200000 400000 600000 800000 1000000
Room4 Room 5 Grade 1 Grade 2 Grade 3 Grade 4 Grade 5 Grade 6 Grade 7 Grade 8 Grade 9 Grade 10 Grade 11 Grade 12
4 years old 5 years old 6 years old 7 years old 8 years old 9 years old 10 years old 11 years old 12 years old 13 years old 14 years old15 years old 16 years old 17 years old
Special s enrolmen t ¨Population by age Enrolment by grade Enrolment by grade Right age Retention zone
with overage Transition zone Lack of schooling zone
Source: Kit España and Labate - Censo Población 2001 and Relevamiento Anual de Matrícula y Cargos, 2001
As is clear from Figure 3, attendance is fairly universal in first grade, with high
coverage in the early schooling years, except for the case of children aged 4 who
should be attending kindergarden - room 4 (salita de 4).
During the first grades of primary school, enrolment is higher than population up to
10 years of age, as students fail and repeat their first grades. As remarked by the
authors, there is almost 19% of age-distortion.
Those who are aged 10 to 13 seem to stay in school, even when many children are
attending behind according to their ages. There is, however, an abrupt decrease in
enrolment from 14 years of age and onwards, defining Grade 9th to 12th as the most
risky zone in terms of schooling.
The next section seeks to go beyond aggregate data, examining the situation of youth
using a household survey dataset. The data will allow us to explore young people in
III.FAILURES IN SCHOOL PROGRESSION
III.A) The EEJ survey
Unlike much research on schooling, the EEJ survey enables tracing individual
education histories from early in their life in a retrospective way.
Tracking these paths is of fundamental importance when education is understood as a
cumulative process - past events have some lasting effect, although their value in
explaining output may diminish over time (Hanushek, 1979, 1986). Furthermore, the
empirical findings suggest that the differences of achievement in education among
children from dissimilar family backgrounds emerge very early in the life-cycle (see
Cameron and Heckman, 2001 and Carneiro and Heckman 2002,2003).
The EEJ survey includes a wide range of questions that allows us to follow student
progress in education. It was carried out during 2005 by the National Institute of
Statistics and Census – INDEC, jointly with CEDLAS5. A specific module to young
people (15 to 30 years old) living in Greater Buenos Aires was introduced into the
official current household survey (Encuesta Permanente de Hogares) with the aim of
capturing educational paths as well as labor market experiences.
As it has been applied within the EPH, it encompasses other variables, including
family background gathered through the official survey. Despite the lack of national
coverage, the selected area (Greater Buenos Aires - GBA) represents an important
part of whole population. In terms of the education system, according to figures
provided by the Ministry of Education, GBA accounts for 30% of total students in the
country (see: REDFIED Dirección Nacional de Información y Evaluación de la
Calidad Educativa. Relevamiento Anual 2004).
Educational paths
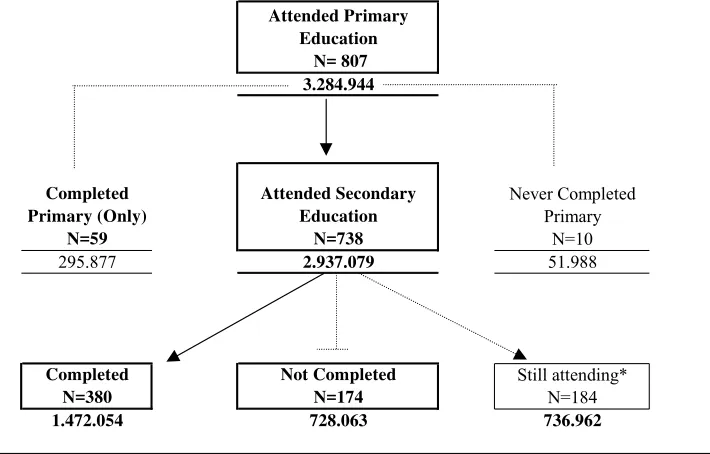
The next figure depicts different educational paths captured by the survey. The whole
sample reported having attended primary education, reflecting the improvements
Attended Primary Education
N= 807 3.284.944 Completed
Primary (Only) N=59
Attended Secondary Education
N=738
Never Completed Primary
N=10
295.877 2.937.079 51.988
Completed N=380
Not Completed N=174
Still attending* N=184
1.472.054 728.063 736.962
[image:16.595.100.455.112.339.2]Source: Authour´s elaboration based on EPH - EEJ Survey 2005. Greater Buenos Aires
Figure 4. Students´ Path for Individuals between 15 - 30 years of age in Greater Buenos Aires.
A very low proportion of the sample (1.6%) never finished primary school. Another
9% reported completing primary but never beginning secondary school. These two
sub-groups together will be referred as “never attended”, as their progress through
school stopped before entering secondary school. As we will see in the next section,
these two disadvantaged groups belong to the older cohorts. This is consistent with
the finding described in the previous section.
The vast majority of the sample, however, attended secondary education conditional
on having completed primary school. There are mainly three possible situations for
the “attended secondary education” group: (i) individuals who completed secondary
level, what this paper will refer to from now on as “completed”, (ii) individuals who
did not complete the level and dropped out before completion - “not completed” and
(iii) a group of young students who are still attending.
For the purpose of characterising dissimilar paths, the next section compares these
groups in several dimensions, giving special attention to the comparison among
“completed”, “not completed” and “never attended” groups.
5
III.B) Characterisation of dissimilar paths
The figures estimated using the EEJ survey in Table 4 by age groups seem consistent
with the already mentioned fact that chances of attending secondary school increased
significantly for younger cohorts6.
Table 4. Educational outcomes of young people classified by age-groups (%) Age groups Completed Not completed° Still attending Never attended
15-17 1.38 11.67 82.83* 4.11
18-24 55.45* 27.13 8.70 8.72
25-30 58.66* 23.44 2.26 15.64
Total 44.81* 22.16* 22.43* 10.59
° And is out of the educational system.
*Coefficient of variation less than 10%. The rest of the figures have a CV above 10%
While among the oldest people 16% have never attended secondary school, the next
cohort (18-24) recorded only half of this value. There is, however, quite similar
probabilities of non-completion between these two groups, suggesting no
improvements regarding finishing secondary school. What is striking is that 12% of
children in schooling age (15-17 years old) already drop out of secondary school.
This figure may be underestimated, as it can be noted that 83% of 15-17 year olds are
still attending, thus they had censored outcomes at the time the survey was collected.
When boys and girls are taken separately, girls show higher completion rates than
boys, independently of age group. There is, however, a higher proportion of women
who did not attend secondary school for the older cohorts. The opposite occurred for
the youngest cohort, in which women seem to have higher attendance than men in the
education system, indicating that in recent years females gain significantly relative to
males in attendance schooling.
6
These results are in line with those reported by the Ministry of Education, using 1998
data from an educational survey (also applied by INDEC through the EPH). That
survey covered most regions in the country.
Who are those following the risk-paths?
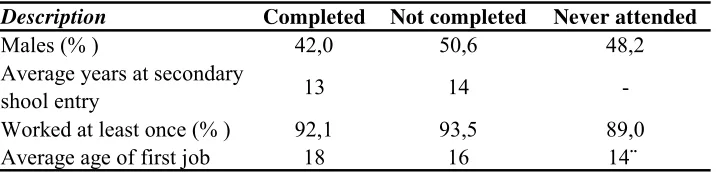
The better performance of women, conditional on having attendance, is also apparent
in Table 5, in which the majority (58%) of those who completed school are females.
If we focus our attention on the most groups at risk (never attended or not
completed), on average, they report to have started working earlier than those who
[image:18.595.92.450.325.411.2]completed.
Table 5. Individual characteritics
Description Completed Not completed Never attended
Males (% ) 42,0 50,6 48,2
Average years at secondary
shool entry 13 14
-Worked at least once (% ) 92,1 93,5 89,0
Average age of first job 18 16 14¨
¨ Coefficient of variation higher than 10%. The rest of the figures have a CV below 10%
The mean age of entry to secondary school for those who drop out is above the
official age: one year over (14 versus 13 years for those who finally completed
secondary).
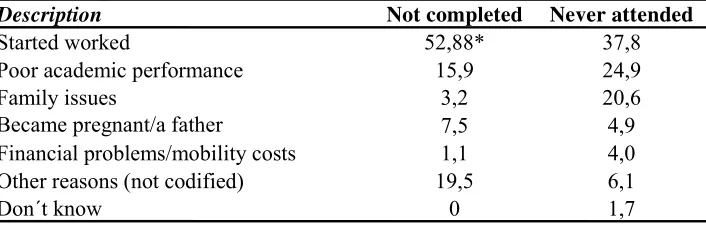
Reason reported for leaving secondary school before the completion of the
final year
The most frequent answers given by drop out respondents are associated with a labor
phenomenon: 52% consider it as the main reason for leaving school. Sidicaro and
Tenti Fanfani (1998) using a survey applied in 1995 found similar results for GBA.
Binstok and Cerruti (2005) do also remark this factor.
The poor academic performance appears to be the second main explicit factor,
Description Not completed Never attended
Started worked 52,88* 37,8
Poor academic performance 15,9 24,9
Family issues 3,2 20,6
Became pregnant/a father 7,5 4,9
Financial problems/mobility costs 1,1 4,0
Other reasons (not codified) 19,5 6,1
Don´t know 0 1,7
[image:19.595.97.450.116.229.2]*Coefficient of variation less than 10%. The rest of the figures have a CV above 10%
Table 6. Reason for not starting secondary school or leaving secondary before completion (%)
Among those who never started studying at secondary school, they point out mainly
three issues: work, poor academic performance and family problems. Presumably, a
poor academic performance can be understood as having failures during schooling.
The next sub-section explores specifically the relationship between being a grade
repeater and educational outcomes.
Failures during schooling
As remarked in section II using administrative aggregate school data, repetition is not
a rare phenomenon.
Our sample allows us to distinguish not only whether the student repeats or not, but
also which grade, and if he/she has failed more than once during schooling. If we
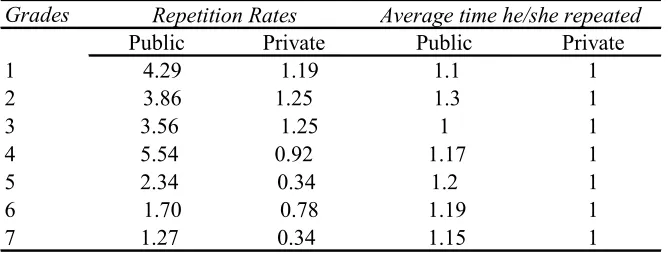
focus our attention on primary repetition, Table 7 shows that repetition rates are
substantially higher in public than in private primary schools. Estimated repetition
rate for the fourth grade in public schools, for instance, is more than five times higher
than that for private schools (5.54 % versus 0.92%). Furthermore, according to the
figures of average time of repetition, once the student repeated a grade during his/her
schooling, there are higher chances to repeat again if he/she attended a public school.
On the other hand, independently of the type of school, repetition happens more
frequently during the first four grades7.
7
Table 7. Repetition at primary school grades by type of school Whole sample
Grades
Public Private Public Private
1 4.29 1.19 1.1 1
2 3.86 1.25 1.3 1
3 3.56 1.25 1 1
4 5.54 0.92 1.17 1
5 2.34 0.34 1.2 1
6 1.70 0.78 1.19 1
7 1.27 0.34 1.15 1
Repetition Rates Average time he/she repeated
That repetition - especially during early grades- may affect subsequent educational
outcomes, is an issue scarcely analysed in the existing literature (Haddad, 1979).
For developing countries, very little is known about either the causes or the
educational effects of repetition (Gomes-Neto and Hanushek, 1994). In fact, to our
knowledge, there is only one recent empirical study (Manacorda, 2005) that provides
evidence of the causal effect of repetition on later educational outcomes in a
developing country. Only two other papers- albeit for US - focus on estimating how
well the same repeater children would have done had they been promoted (see Jacob
and Lefgren, 2004; Eide and Showlater, 2001).
The scarcity of these kinds of studies is based on the difficulties that student latent
school outcomes (i.e drop out) and the probability to repeat are likely to be
simultaneously determinate. To deal with this problem, specific econometric
techniques such as longitudinal data in which individuals are the unit of analysis or
experimental designs are required, both quite rare, especially in developing countries.
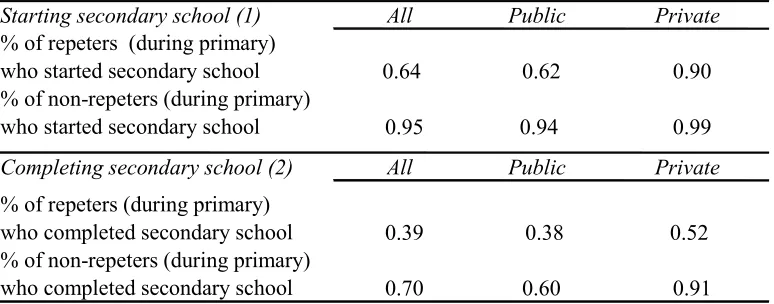
As a first crude approximation to the issue, simple tabulations of our data are
presented in Table 8. The results suggest that repeaters in primary schools are less
likely to start secondary education (conditional on having completed primary) than
non repeaters (64 % and 95%, respectively). These results are driven for the
outcomes in public primary schools, as chances of starting secondary school is
estimated in 94% for non-repeaters, while those who repeated at least once during
Furthermore, even for those who started secondary school, the chance of completion
[image:21.595.98.485.168.320.2]is much lower for repeaters (39%) than non repeaters (70%).
Table 8. Average outcomes for primary repeaters and non repeters by type of school
Starting secondary school (1) All Public Private % of repeters (during primary)
who started secondary school 0.64 0.62 0.90 % of non-repeters (during primary)
who started secondary school 0.95 0.94 0.99
Completing secondary school (2) All Public Private
% of repeters (during primary)
who completed secondary school 0.39 0.38 0.52 % of non-repeters (during primary)
who completed secondary school 0.70 0.60 0.91 (1) Whole sample excluding those who never finished primary
(2) Sample includes those who completed and those who drop out secondary school
Again, when these probabilities are computed separately for students who attended
public primary schools versus those from private schools, the latter group always has
much better outcomes.
These results must be taken with caution because unobservable factors could be
affecting both (outcomes and the likelihood of repetition). Furthermore, these results
are not controlled by other observable factors (such as parents’ education) that may
also affect the outcome. The later issue will be addressed in section III.
Youth perceptions on parents’ educational preferences
One of the unobservable factors which is quite difficult to measure is related to the
parental involvement with children’s education. We intended to get an idea of the
issue, by directly asking young people in the survey some questions about the
perceptions they have concerning their parents’ educational preferences and support8.
Table 9 contains unadjusted probabilities of starting secondary school (first panel),
and probabilities of not completing secondary (second panel) for categories of youth
8
perceptions on parental education support. The chance of starting secondary
education for those people who feel their parents were very concerned about their
education is estimated to be 93% , while the figure drops to 78% for those who do not
perceive that their parents worried about their schooling.
Looking at the second panel, the probability of completion is significantly higher for
those who feel supported than for people who perceive that their parents do not worry
[image:22.595.100.422.281.422.2]about their education (73% versus 16%).
Table 9. Youth perceptions on parental education support by gender
All Men Women
Starting secondary school (1)
A lot 0.93 0.91 0.94
More or less 0.79 0.86 0.71
Do not worried about 0.78 0.85 0.74
All Men Women
Completing secondary school (2)
A lot 0.73 0.76 0.70
More or less 0.34 0.24 0.42
Do not worried about 0.16 0.32 0
(1) Whole sample excluding those who never finished primary
(2) Sample includes those who completed and those who drop out secondary school
In both cases, the differences in probabilities among perception groups are lower in
men than in women, suggesting a more diverse treatment from parents to their
children among women than men.
Intergenerational transmission of education
Tables 10 and 11 present selected descriptive statistics on the intergenerational
transmission of education.
It is worth noting that the higher the parental education, the better the educational
outcome of youth. For example, when mothers have a university level, 94.3% of their
young people complete secondary. This proportion decreases to 45.6 % for children
whose mothers have just primary schooling completed. On the other hand, one third
secondary school, while 41.6% did not complete this level and 27.7 never received
[image:23.595.93.509.158.250.2]high level education9.
Table 10. Educational Outcomes and Mother´s education
Mother´s education Completed Not Completed Never Attended
Prim Incom or less 30.73 41.60 27.67
Prim Compl 45.59* 33.76 20.65
Sec Incomp 61.27 33.40 5.33
Sec Compl 75.98 22.45 1.57
Univ Incomp or completed 94.32* 5.68 0.00
*Coefficient variation less than 10%. The rest of the figures have an CV above 10%
Educational outcomes for young people
The Table 11 is a transition matrix, in which we estimated the probability that an
individual completes a certain educational level given the educational attainment of
his/her mother (it excludes those individuals who are still attending secondary
school).
Table 11. Mother Schooling and Child´s Schooling (transition matrix)
Mother /Child
Primary Incom
Primary Completed
Secondary Incomp
Secondary Completed
Terciary/Univ Incomp
Univ Completed
None 35.46 10.68 26.50 13.22 14.13 0.00
Primary Incom 5.09 20.87 42.52 20.18 9.12 2.22
Primary 2.14 18.63 32.61 21.46 18.36 6.79
Secondary 0.00 5.42 32.28 26.48 27.22 8.60
Secondary 0.00 1.58 22.61 18.61 52.07 5.12
Terciary/Univ 0.00 0.00 4.19 15.24 68.54 12.04
Univ Completed 0.00 0.00 6.45 7.54 62.54 23.47
These figures reflect one of the facts marked in the previous section: the increase in
educational attainment from the parents to the next generation. All of the children of
mothers without education have at least incomplete primary. There is, however, an
intergenerational persistence in educational status. Around 70% of children of
mothers with an incomplete primary education or less, never finish secondary school.
Conversely, 0% of children of mothers with a university completed have less than
completed primary school. This suggests that improving educational attainment of
9
[image:23.595.96.550.401.516.2]the current generation has a positive effect beyond its own welfare, extending the
chance of improvement of their future children.
Similarly, the analysis of the average years of schooling completed for young people
shows again that the higher the educational level completed by their mothers, the
greater the average years of schooling of the child, revealing the intergenerational
persistence in education opportunities (see Table 4 in the Annex).
While descriptive statistics on educational outcomes presented in this section are very
informative, there are well known limits to what can be inferred simply from cross
tabulations. The next section uses multivariate analysis to estimate adjusted
probabilities of starting secondary education as well as probabilities of completion
schooling, simultaneously controlling for a widely range of factors that may be
correlated with these probabilities
III.C) The Econometric Model and Empirical Results
This section of the paper estimates the relationship of educational outcomes to
individual and school factors, controlling for a number of other variables. We will
analyse, for example, the effect of early failure on the probability of starting and
completing secondary education.
Yet these statistical models can only suggest - not prove - causal connections. As
Rumberger, R. (2001) remarks, “it is better to think of these factors as predictive of
dropping out (completion) or increasing the risk of dropping (but not that these
factors cause dropout) ” (ibidem page 5)
The Econometric Model
Since the dependent variables of interest are binary in nature, the econometric model
is a simple limited dependent variables model, where the individual and school
characteristics are associated with the probability that a given individual starts
secondary school or conditional on it, completes that educational level.
Let y represent any given binary outcome for the dependent variables of interest, and
X represent the vector of measures of some characteristics. Then we presume that
E(y|X) = Prob(y=1|X) = F(X) (1) There are many options for estimating the effect of X on y. We have chosen to use
logit regression, where F(X) is assumed to be the standard logistic function. In this
case, one can also easily calculate marginal effects for a continuously valued
explanatory variable, Xk:
∂P(y=1|X)/∂Xk = βkf(Xβ) (2)
where f(.)=∂F(.)/∂Xβ.
In the case of discrete explanatory variables, the reported “marginal” effect is actually
its average effect:
Prob(y=1|Xk=1) - Prob(y=1|Xk=0) = F(Xβ| Xk=1) - F(Xβ| Xk=0) (3)
Note that because of the non-linearity of the logistic function, these are more
complicated calculations than would seem. In particular, both the marginal and
average effects in the logit framework depend on the values of the X variables.
The y variables examined in this paper are: (a) a measure for starting secondary
school – which equals one if the individual started secondary school (given that
he/she has finished primary) and equals zero otherwise; (b) a measure for completing
secondary school (given that he/she has started it) which equals 1 whether the
individual has finished school, and equals 0 otherwise (that is reported being a drop
out) 10. For the former outcome (a) the whole sample of young people is used in the
estimation (excluding 10 observations which are those individuals who never finished
primary school and are not currently receiving any formal education). For the
examination of the second outcome (b), a sub-sample is used including all people
who started secondary, completed or not completed (independently of the age)11.
10
In the survey, we also asked when they dropped out: 53% dropped out before 2000, while 25% did it between 2001 and 2003, suggesting permanent drop out behaviour.
11
X contains variables on failure (such as having repeated during primary – 1st to 3rd
grades or 4th to 7th) or during secondary school, along with important individual and
school-level control variables, fully described in the Annex - Part II.
Some characteristics, such as having parents with high education level, are
associated with a decreased risk of not starting (or not completing) secondary school.
Conversely, other characteristics, like “having textbooks while studying” are factors
that promote successful development and buffer the effects of risk factors (Jessor
1993).
An advantage of this dataset, rarely found in other empirical studies, is that most
school characteristics and socio-economic conditions of individuals at the time that
schooling choices were made are known.
For instance, we know variables from the supply side: whether textbooks during their
studies (books) or a specific scholarship during secondary school (scholarship) were
available, if the individuals had a private teacher during primary schooling (private
teach) or whether he/she started working before 13 years of age (worked_before13);
we also have information about the same basic features of their primary and
secondary school, such as whether it is private (religious or not religious/public);
non-extended or extended schools (sch_simple); and whether schools were located in
Conurbano or in the City of Buenos Aires (sch_conurbano)12.
would the “full-sample” logit yield consistent parameter estimates. In terms of econometric structure, the problem is similar to that which occurs with a mis-classified binary dependent variable. See discussion by Hausman, Abrevaya and Scott-Morton (1998). There are, however, other costs when we exclude this group. One alternative estimation procedure to accommodate this kind of data is to fit a model that takes into account both uncensored and censored observation, as for instance, a censored-normal regression. That model was also estimated –see Annex - Table 6 - using years of schooling (instead of binary outcomes) for the whole sample in which censoring values may vary from observation to observation. The same qualitative results were obtained than in the case of using our restricted sample.
12
We asked questions related to the demand side aspect, such as parents’ education,
even when individuals are not presently living with their parents. Different binary
variables with the maximum education of their parents were constructed
(adu_max1_p, adu_max2_p, adu_max3_p). In order to counteract the missing data, a
dummy variable for those parents with unknown education was constructed. As a
sensitivity check, the estimation was redone after deleting those observations where
edu_max0_p= 1. The results were qualitatively the same as those reported.
Finally, cohort effects using dummy variables for various age groups are also
included in the regressions, as the sample involves people who, for example, could
have started secondary school during the eighties while others have done so very
recently. Thus, these variables could presumably be capturing the effects of changes
in the macroeconomic environment as well as the effect of increased supply of
schooling over time. For instance, it could be the case that younger cohorts are
achieving significantly more chances to start secondary school than older ones due to
improvements in the supply of schooling.
The empirical results
Probabilities of starting secondary school
Table 12 summarises the results for the first outcome under analysis: the adjusted
probability of starting secondary school. As observed, this probability for the average
person in our sample is very high: 98%.
The direction of the estimated coefficients for different factors is what we could
expect. The fourth column shows the results translated into marginal probabilities
evaluated at the means of the separate variables. Specifically, the relationship
between chances of attending secondary education and failures during primary
schooling (in comparison with those who never failed) is negative, holding the other
variables constant. Note that the result for repetition at least once during 4th to 7th
year is in addition to any repetition effect that would arise if a student who suffered
from 4th to 7th also suffered from 1st to 3rd grade. The effects are cumulative, so a
student suffering both would be predicted to be 20% less likely to attend secondary
Those young people whose parents have low education (versus those with parents
with high education) are less likely to attend school, even controlling for school
factors. This may suggest that the lasting effect of low education levels is seen from
the intergenerational nature of the transmission of human capital from parents to
children; no attendance for this generation hurts not just this generation but also
[image:28.595.94.436.231.542.2]future generations (Harbison and Hanushek, 1992).
Table 12.Logit model of Starting Secondary School
Variables Coefficient z statitics
Marginal
probability* Mean
repetition1_3 -2,31 -5,99 -0,12 0,08
repetition4_7 -1,85 -4,01 -0,08 0,06
male 0,01 0,02 0,00 0,46
edu_max0_p -2,44 -2,90 -0,15 0,03
edu_max1_p -2,31 -3,06 -0,12 0,09
edu_max2_p -1,95 -3,10 -0,04 0,46
books 0,55 1,50 0,01 0,80
worked_before13 -1,04 -2,69 -0,03 0,12
private_teach 0,14 0,28 0,00 0,14
shc_public -1,49 -1,87 -0,02 0,72
sch_simple 0,05 0,07 0,00 0,86
sch_conurbano -0,37 -0,71 -0,01 0,76
xcohort2 -1,19 -2,42 -0,03 0,30
xcohort3 -1,60 -3,61 -0,04 0,36
_cons 7,34 5,99
Sample size 797 Mean probability 0,981 Log pseudolikelihood=-138,96 Wald chi2(18) = 133,24
Note: Huber/White/sandwich estimator of variance was used.
*Estimated marginal probabilities are calculated at means of variables and holding constant other factos contained in the logit equation of starting secondary schoo. For discrete, marginal probability is the change of dummy variable from 0 to 1
It is worth noting that gender does not seem to have an important role in the
probability of attendance, especially once cohort effects are included as control
variables. The coefficient for “textbook availability” even when its sign shows a
positive effect, seems not to be significant in explaining the probability of starting
secondary school. The same occurs with “having a private support during primary
schooling”. Variables that characterise primary schools (public versus private; simple
differences on access to secondary education, controlling for repetition and other
factors.
Taken as a whole, these results are consistent with the vast literature on the subject of
the economics of education, which shows very strong family background effects on
educational achievement, and less strong effects of school variables. In fact, that
discussion started with the Coleman report for US schools, an extraordinarily
influential study in the policy and academic circles, which assessed the factors behind
student achievement.
Not surprisingly, for young people who started working before 13 years of age, the
probability of continuing at secondary level is lower than for those who did not have
a job during their childhood. This relationship, however, could be spurious, due to the
possible endogeneity in the working variable.
Finally, older cohorts, as expected, are significantly less likely to start secondary
school compared to the youngest cohort, even controlling for specific individual and
school characteristics.
Probabilities of Secondary School Completion
In this sub-section, we analyse the relationship between probabilities of secondary
school completion and individual and schools factors. The regression results are
reported in Table 13.
As in the case of chances of starting secondary school, probabilities of completion are
directly related to the level of parents’ education. This may reflect parental views on
the importance of schooling. The strong link between both suggests a long term effect
of improved education.
Regarding variables associated with failures during school years (repetition_pri and
repetition_sec), they seem to have a strong correlation with completion probabilities,
even controlling for many observed factors. Given the data at hand, it is not possible
to evaluate whether or not repetition works as a strategy for improving learning and
completion. That is, in the case of repeaters, we cannot say much about what would
instrumental variables, it could be possible to address the real effect of repetition on
completion. The instrument gives variation in repetition variable that is exogenous to
any unobservable factors that are correlated with both repetition and educational
[image:30.595.96.479.192.547.2]outcome. This issue will be addressed in a future research.
Table 13. Logit model of Completion Secondary School
Variables Coefficient z statitics
Marginal
probability Mean
repetition_pri -1,006 -2,810 -0,215 0,110
repetition_sec -1,137 -4,440 -0,231 0,269
male -0,477 -2,030 -0,088 0,446
edu_max0_p -1,363 -1,660 -0,311 0,016
edu_max1_p -1,182 -2,830 -0,261 0,074
edu_max2_p -0,989 -3,890 -0,185 0,437
books 0,788 2,720 0,160 0,814
worked_before13 -0,804 -2,180 -0,169 0,088
schoolarship -0,116 -0,300 -0,022 0,108
sch_same -0,470 -1,640 -0,079 0,807
sch_priv_rel 0,931 2,250 0,143 0,177
sch_priv_nonrel 0,800 1,950 0,124 0,152
sch_languages 0,712 1,880 0,114 0,171
sch_simple 0,030 0,080 0,005 0,823
sch_conurbano -0,550 -2,150 -0,094 0,704
shc_public -0,712 -2,220 -0,121 0,686
xcohort2 0,562 1,950 0,099 0,388
xcohort3 0,978 3,200 0,172 0,440
Constant 1,942 3,140
Sample size 554
Mean probability 0,760 Log pseudolikelihood= -254,33 Wald chi2(18) = 120
Note: Huber/White/sandwich estimator of variance was
Males are significantly less likely to complete secondary school than women, holding
other factors constant- including type of secondary and primary school as well as
cohort effects. Interestingly, coefficients associated with cohorts effects show that
for older cohorts, chances to complete secondary are higher than for the youngest
cohort (base category). In fact, those who were born between 1975 and 1980
(presumably entering secondary school by the end of the eighties) are significantly
more likely to finish successfully than those who were born between 1986 and 1990
macroeconomic conditions that could have affected school-work decisions among
young people. It could be the case, however, that results reflect sample selection bias
(because those who are still attending secondary schooling are excluded from the
estimation). As a crude approximation to this issue, Table 6 in the Annex shows
censored normal regression results using the whole sample (including as censored
observations those who are still attending), and years of schooling as a dependent
variable. As can be seen, results are consistent with the hypothesis that older cohorts
had better schooling outcomes.
Young people that started working before 13 years of age are less likely to complete
his/her education than those who never worked before that age13. Not completion –
that is being out of school – may also negatively affect other aspects of their own
lives or of society as a whole. As remarked by Wolfe (1995) quoting Spiegelman
(1968), time spent in school appeared to be directly and negatively related to crime;
that is, adolescents involved with schooling had a lower probability of committing a
crime.
Contrary to the findings related to access to secondary school, textbooks availability
seems to have a significant and positive effect on student probabilities of completion.
Then, those who declared to have had books to study have 16% more chances of
finishing school than those who reported a lack of books during schooling. This result
is neither new nor surprising. Indeed, the empirical literature for high school, using
data sets from a variety of countries, points out the result. Textbooks availability
could also reflect parents’ educational preferences and support. If this is the
underlying cause, different policies can be applied to actively involve parents with
their daughter/ sons’ education.
Completion probabilities do not appear to be significantly different for a student who
received a scholarship during secondary schooling in comparison with a student who
never had a scholarship. This does not mean scholarships do not have any effect on
student educational outcomes, but instead that controlling for socio-economic and
13
schools factors, the effect is not statistically different between a young person who
has a scholarship and a person who did not receive it.
Regarding school characteristics, there are some systematic higher probabilities of
completion for students who attended private secondary school, holding constant
other factors such as type of primary school attended. In particular, young people
who went to a religious private school are 14% more likely to finish secondary than
students who went to a public institution, controlling for changing schools during
secondary. The exact reason for this is unclear. It could reflect better strategies in
private schools for retaining students, or it could just be that parents with higher
preferences for their child’s schooling decide to send their children to private schools.
What is striking is that the effect appears to be significantly different from zero even
when we controlled for type of primary school and parental education.
The rest of the parameters estimated have the expected signs, except for those who
attended simple school (who seem to be more likely to finish than those attending a
full time school). The result, however, is not significantly different from zero at the
10 percent level.
Profiles: probabilities of different students
In this section, estimated coefficients of the previous model are used to predict
probabilities of completion for students with different backgrounds.
The first column of Table 14 shows variables that are changed one at a time in order
to construct different students profiles and compute their probabilities.
A young individual who has a low-risk profile is described as a person whose parents
have at least completed secondary education, has the textbooks to study and did not
repeat during primary school. The rest of the variables are hold at their mean values.
The probability of completion for this person is in fact greater than the average:
Table 14. Preditions of the completion secondary school probabilities for different profiles
Variables
repetition_pri No Yes Yes Yes
books Yes Yes No No
edu_max2_p No No No Yes
edu_max3_p Yes Yes Yes No
Pr(y=1|x) 0.875 0.720 0.539 0.303
Confidence
Intervals [0.831,0.92] [ 0.57, 0.87] [ 0.31,0.76] [ 0.12,0.48] Note: Confidence intervals by delta method
There is, however, 15% less probability of completion for a teenager with similar
characteristics except that s/he had at least one failure during primary.
Adding the effect of not having textbooks during secondary schooling, the chance of
completion is reduced to 54%. There is, instead, only 30% probability to complete
secondary for young people with no textbooks, failures during their primary school, and
parents with middle education.
It is important to bear in mind that all results are a first approximation to the issue of
determinants to access and complete secondary, and they are subjected to some caveats.
Because of endogeneity issues discussed before, we cannot really argue that teenagers
who had not repeated during primary would have finished secondary school. Related to
the first issue, it might be the case that there is a third unobservable variable – such as
teacher motivation or detailed pedagogical strategies in some schools –affecting both:
repetition and chances of completing secondary level education and resulting in a biased
estimate of the coefficients.
IV.CONCLUDING COMMENTS
The examination of basic indicators on access to education using census data shows
that the country has made great progress toward increasing enrolments during the
eighties, which was a time of increasing population growth. Since then, enrolment
rates have been higher than population rates, with the former being 33 points above
than the latter for teenagers aged 15-17.
There are, however, still significant differences between geographical areas within
Corrientes are clearly educationally disadvantaged. On the other hand, the percentage
of 6-17 year olds reporting to be out of school in 2001 is 10,3% higher in rural
dispersed areas than the national average (17.3% versus 7%, respectively).
Even within urban areas, the average non-attendance rate hides significant
differences among household income quintiles. While less than 1% of young people
in the richest quintile are not going to school, the figure climbs to 8.2% for those in
the poorest quintile.
Beyond the expansion of schooling, the research findings reveal that for those who
are in school, especially in first grades, around 20% are attending with an age-grade
distortion. Again, significant differences are observed among income quintiles
(12.3% for the richest quintile, versus 35.8% for the poorest).
Even with failures, what matters is whether or not the student completes its
schooling. The official figures collected in the schools by the Ministry of Education
provide evidence of small improvements on the completion rates during the last ten
years. Despite rates that seem to show a slight increase after the application of the
new Federal Law, the trend did not hold through time. In fact, the most recent data
show that only 76.8% of the students completed the mandatory education period.
Using the EEJ survey, we were able to have a first crude approximation to the issue.
According to young people’s perceptions, their parents´ educational preferences and
support constitute an important positive factor to school completion. In fact, when
unconditional probabilities of completion were estimated, it was seen that chances of
completion for students with parents´ support were almost 4 times higher than those
students who felt their parents did not worry about their education. Parents´
preferences are intrinsically linked with their own education. Even when we observed
an increase in educational attainment from the parents to the next generation, the
transition matrix showed that there is an intergenerational persistence in educational
success, suggesting a long term effect of improved education. Figures give evidence
that around 70% of children of mothers with an incomplete primary education or less,
It is also important to highlight that early failures are closely linked with future
educational outcomes, and could be identified as a negative risk factor. Noticeable
differences on completion secondary schools were estimated between those who
ANNEX
Part 1: Tables
Data from Census
Provinces Total 6 a 11 12 a 14 15 a 17
Ciudad de Buenos Aires 5,2 1,0 2,7 15,0
Buenos Aires 6,4 1,4 3,4 20,6
24 partidos del Gran Buenos 6,4 1,6 3,4 20,1
Resto de Buenos Aires 6,5 1,0 3,4 21,4
Catamarca 7,1 1,4 4,7 22,8
Córdoba 9,6 1,0 8,1 29,5
Corrientes 11,8 3,0 11,0 33,6
Chaco 13,9 4,0 13,2 38,2
Chubut 6,0 0,8 3,4 19,9
Entre Ríos 9,7 1,3 7,7 30,2
Formosa 10,6 2,5 9,3 32,2
Jujuy 7,3 1,3 6,0 21,8
La Pampa 7,9 1,1 5,0 25,8
La Rioja 8,4 1,8 6,7 26,9
Mendoza 8,9 1,2 6,4 28,7
Misiones 15,4 5,1 16,3 39,1
Neuquén 7,0 0,9 4,9 23,3
Río Negro 6,9 0,8 4,6 22,7
Salta 8,6 2,1 6,8 25,6
San Juan 9,2 1,8 7,1 27,9
San Luis 8,5 1,9 6,7 26,6
Santa Cruz 3,5 0,5 1,7 13,1
Santa Fe 8,3 1,1 5,0 26,5
Santiago del Estero 16,1 3,6 16,7 44,9
Tierra del Fuego 2,5 0,3 1,2 10,0
Tucumán 14,1 2,4 14,4 40,7
[image:36.595.91.483.197.577.2]Source: INDEC. Dirección Nacional de Estadísticas Sociales y de Población. Dirección de Estadísticas Sectoriales based on special tabulations from the Census 2001. See INDEC pages for details.
Data from Permanent Household Survey (EPH)
Table 2. Non-attendace ratesand Attendace Rates with Overage. Urban Areas For Men and Women aged 6 to 17
Age Total Women Men Total Women Men
6 1,0% 0,6% 1,4% 0,2% 0,1% 0,2%
7 0,7% 0,9% 0,4% 10,4% 9,2% 11,5%
8 0,6% 0,3% 1,0% 15,2% 15,3% 15,2%
9 0,3% 0,3% 0,4% 17,4% 15,7% 19,2%
10 1,1% 1,0% 1,2% 20,7% 19,0% 22,5%
11 0,8% 1,1% 0,6% 23,9% 22,6% 25,1%
12 1,4% 1,4% 1,5% 31,9% 30,2% 33,6%
13 2,0% 1,9% 2,1% 35,3% 33,8% 36,8%
14 4,6% 5,1% 4,2% 35,4% 31,3% 39,1%
15 8,3% 8,2% 8,4% 44,0% 38,7% 48,8%
16 16,8% 15,8% 17,8% 45,9% 40,9% 51,0%
17 24,9% 22,7% 27,3% 44,3% 39,6% 49,6%
Total 5,1% 4,9% 5,3% 26,2% 24,0% 28,3%
Source: Own calcluations based on EPH - 2000 October Wave
Data from REDIFIED
Table 3.A. Repetition rates
Levels
EGB 1y2 2003 2002 2001 2000 1999 1998 1997
1° 9,97 9,95 9,94 10,38 9,93 9,51 9,00
2° 6,98 7,05 7,05 7,25 7,06 6,76 6,76
3° 6,19 6,17 6,15 6,38 6,10 6,26 5,64
4° 5,88 5,53 5,20 5,56 5,23 5,02 4,55
5° 5,12 4,70 4,30 4,72 4,61 4,20 3,77
6° 4,31 3,82 3,60 3,87 3,78 3,44 2,97
EGB 3
7° 6,63 5,70 5,07 5,14 4,41 3,48 2,64
8° 11,76 10,35 9,70 10,81 10,69 11,42 11,63
9° 9,80 8,85 8,01 9,26 9,51 9,87 12,11
Polimodal
1° 10,29 8,42 7,24 8,23 8,09 8,95 9,51
2° 7,44 6,40 5,31 5,73 3,95 4,76 4,86
3° 1,03 0,55 0,78 0,83 0,99 0,95 1,06
Source: Based on data from Red Federal de Información Educativa. Ministry of Education.
Years
Table 3.B. Interannual dropout
Levels
EGB 1y2 2003 2002 2001 2000 1999 1998 1997
1° 2,57 3,12 3,18 2,51 2,48 2,34 2,42
2° 0,74 1,31 1,25 1,12 1,18 1,27 1,47
3° 0,86 1,36 1,35 1,15 1,29 1,24 1,32
4° 1,33 1,79 1,73 1,59 1,59 1,56 1,76
5° 1,75 2,21 2,11 2,02 2,06 2,11 2,41
6° 3,67 3,31 3,61 5,46 3,34 3,06 3,65
EGB 3
7° 2,14 1,64 1,76 0,31 -0,94 -2,51 -1,91
8° 10,47 9,87 10,00 10,03 10,34 12,23 11,58
9° 13,39 11,31 11,86 14,88 14,13 13,05 19,81
Polimodal
1° 17,51 14,18 12,24 12,59 11,06 9,66 8,65
2° 13,74 11,66 9,62 9,94 7,53 8,36 8,72
3° 27,19 22,29 22,11 33,94 24,85 24,66 25,53
Source: Based on data from Red Federal de Información Educativa. Ministry of Education.
[image:38.595.92.507.343.530.2]