Influence of the PEO length in gas separation properties of segregating aromatic-aliphatic copoly(ether-imide)s.
A. Tena1, A. Marcos-Fernández1,2, A.E. Lozano1,2, J. de Abajo1,2, L. Palacio1, P. Prádanos1, A. Hernández1*
1
Smap UA-UVA_CSIC, Universidad de Valladolid, Facultad de Ciencias, Real de Burgos s/n, 47071 Valladolid, Spain
2
Instituto de Ciencia y Tecnología de Polímeros, CSIC, Juan de la Cierva 3, 28006 Madrid, Spain
Summary:
A complete series of aliphatic-aromatic copoly(ether-imide)s has been synthesized in this work. All these copoly(ether-imide)s had the same structure, BPDA-PEOX-ODA, but different lengths of PEO in the final polymer. These copolymers have been thermally treated and characterized by several techniques. A direct relationship between the temperature of treatment, the improvement of phase segregation, and permeability has been demonstrated.
The Maxwell model has been applied to predict permeability (for CO2, CH4 and N2) and it has been found that when the segregated PEO can be considered to be amorphous – it is at high temperatures when crystallinity disappears – the model fits reasonably well. This confirms that the aliphatic and aromatic portions of the copolymer behave
approximately as a bi-phase of disperse domains within a continuous matrix.
Results show that permeability is higher when the PEO chains are longer – when there
is no crystallinity, or any kind of internal bonds, distorting the results – while selectivity doesn´t depend on the PEO length in the copolymer. Remarkable are the results for the CO2/N2 gas pair, with selectivity-versus-permeability very near to the Robeson‘s upper bound at 30 ºC and even in closer proximity to the corresponding trade off line for higher permeation temperatures.
Keywords: Membranes; Polymers; Separations; Selectivity; Copoly(ether-imide); carbon dioxide (CO2).
*tonhg@termo.uva.es
*Manuscript
1. Introduction
The liberation to the atmosphere of big amounts of greenhouse gases in a short period
can lead to global warming. Over a 60 % of the global greenhouse effect is attributable to carbon dioxide (Yamasaki, 2003). There are several sources — such as power plants, steel, cement production plants or chemical industry— where CO2 is generated. Among these, coal-fired power plants are the main emitters of CO2 and are responsible for nearly a 30% of the total CO2 release. It has been estimated that about half of the electricity will be generated by coal-fired power plants at least until 2035 (EIA, 2011).
This will cause more CO2 liberated causing a serious intensification of climate change. Hence, it is necessary to develop new technologies to curb as far as possible the emissions of greenhouse gases.
One of the preferred methods to control CO2 emission is its capture and storage (CCS), including separation, transportation and storage stages (EIA, 2011). Around a 70 to 80 % of the total costs of CCS is represented by the CO2 capture. The three main options for CO2 capture from power plants are: pre-combustion, oxy-fuel combustion, and post-combustion capture (Figueroa et al., 2008; Ho et al., 2009; Yang et al., 2008). Post-combustion capture is the simplest and most suitable way to perform carbon dioxide capture for newly-built as well as for existing coal-fired power plants (Herzog, 2001).
Post-combustion capture is fundamentally a separation of CO2 from flue gas — generally consisting in N2, CO2, O2 and H2O —, and conventional gas separation technologies, such as chemical absorption, pressure swing adsorption, and membrane separation, could be applied. Of course the separation technique to be used is determined by its effective price (Davison, 2007; Hoffmann et al., 2008; Klemeš et al., 2007). The amount of carbon dioxide emitted and captured are, of course, relevant figures in order to make an adequate decision.
main cost item corresponds to energy consumption. Very different is the situation of gas separation processes using polymeric membranes that are by nature quite flexible processes. Whenever CO2/N2 selectivity exceeds 30, permeability of membrane has more influence on the cost than energy consumption which is very low (Merkel et al., 2010). Moreover, it has been shown that, if the cost of the membrane is low, it is cost-effective to select a material with high selectivity; while if the price of the membrane is high a polymer with a higher CO2 permeability is more economically effective (Ho et al., 2008; Yang et al., 2011). All these factors concerning the membrane material leave a very wide range of improvement open in terms of operational cost.
It is also convenient, in order to get appropriate membranes for gas separation, to start with a suitable polymeric material, with adequate flow and good mechanical and thermal resistance. Of course when dealing with CO2 capture, the polymer membrane must have a high affinity for carbon dioxide, so polymers with adequate permeability values are necessary (Bounaceur et al., 2006; Favre, 2007).
Glassy polymers and in particular polyimides are well known for their excellent thermal oxidative stability, good organic solvent resistance and exceptional mechanical properties, along with an extraordinary ability to separate complex mixtures of gases in diverse applications (Bessonov, 1987; Ghosh, 1996; Wilson, 1990). Thus, among all the polymeric membranes, it has been widely demonstrated that the use of aromatic
polyimides is one of the best alternatives. Typically these materials have a high selectivity while having a not always high enough permeability (Ayala et al., 2003;
Tanaka et al., 1989).
flexible chain structure, gas transport is easy giving a good permeability to the copolymer (Barbari et al., 1988; Li et al., 1997).
The use of polyethylene oxide (PEO) compounds for separating CO2 from other light gases is known (Hirayama et al., 1999; Kawakami et al., 1982) to give high CO2 permeability. The interaction between CO2 and oxyethylene groups has been discussed and used for the development of CO2 selective membranes by many authors (Car et al., 2008; Lin and Freeman, 2004; Reijerkerk et al., 2010). In view of this, the use of block-copolymers combining aromatic polyimides and PEO, appears to be a successful route (Okamoto et al., 1995; Okamoto, 1993; Suzuki et al., 1998). In effect, these compounds have good permselectivities (permeability-selectivity) results for the couple CO2/N2. This was attributed mainly to the high solubility-selectivity due to strong interactions between the oxyethylene group and CO2 (Tena et al., 2012b; Tena et al., 2012c).
In order to optimize the necessary properties, a good balance between the hard and soft block parts of the copolymer is needed. Previous studies from our group reported that when the copolymer has a percentage of PEO around 50% it has the best properties attending to the necessary mechanical resistance that should be compromised by too high PEO contents (Tena et al., 2012a). Moreover, the crystallinity of polyether segments is known to increase when the length of PEO increases leading to a decrease in gas sorption because the crystalline phase acts as a non-sorbing and impermeable
barrier reducing the permeability severely. Therefore, in addition to the percentage of PEO, the length of its chain has also an important effect on the permeation properties of
the copolymer.
different temperatures on PEO segregation and permselectivity will be also analyzed here.
The properties of these copolymers have been analyzed by standard techniques of characterization (DSC, TGA, TMA, mechanical properties and densitometry) and by SAXS. The properties of permeation have been evaluated at temperatures from 30 °C to 50 °C, a temperature high enough so that all samples had the polyethylene oxide chains in an amorphous state. Finally, we have used the Maxwell`s model to predict the permeability to different gases.
2. Experimental
2.1. Chemicals
3,3′,4,4′-biphenyltetracarboxylic dianhydride (BPDA), and 4,4'-oxydianiline (ODA)
were purchased from Sigma-Aldrich Co. These products were purified by sublimation at high vacuum just before being used. Bis(2-aminopropyl) poly(ethylene oxide) with nominal molecular weight of 900 and 2000 g/mol were kindly donated by Huntsman (Holland) (PEO-900 and PEO-2000 from here on). α,ω-Diamine-poly(ethylene oxide) with nominal molecular weight of 6000 g mol-1 was kindly donated by Kawaken Fine Chemicals Co., Ltd. (Tokyo, Japan), (PEO-6000 from here on). The polyethers were
dried at 70 ºC in vacuum for 5 hours and stored in a desiccator at vacuum until use. Hexamethylenediisocyanate (HDI) was purchased from Sigma-Aldrich and purified by
distillation at vacuum before use. Anhydrous N-methylpyrrolidinone (NMP), to be used as polymerization solvent, was purchased from Sigma-Aldrich Co.
Figure 1. Chemical structure of the monomers.
2.2. Synthesis of copoly(ether-imide)s
The polymerization reaction was carried out in a three-neck flask, under N2 atmosphere and mechanical stirring, following this procedure: PEO (x mmol) was dissolved in
Polyether chains included in the synthesized copolymers were: PEO900, PEO900+HDI, PEO2000, PEO2000+HDI, PEO900+PEO2000 (50/50 w/w), and PEO6000. After some minutes of stirring at room temperature, the aromatic diamine (ODA) (z mmol) in a
weight ratio 2:1 (polyether chain : aromatic diamine), was added to the solution to give a final concentration of 20 mL solvent for 10 meq of amino group. When the solid aromatic diamine was dissolved the precise stoichiometric amount of the BPDA aromatic dianhydride was added at once. The reaction was stirred at room temperature for 12 hours.
From here on the copolymers to be studied will be named by adding cPI to the name of the PEO entering the composition, i.e.: cPI-PEO900, cPI-PEO900+HDI, cPI-PEO2000, cPI-PEO2000+HDI, cPI-PEO900+PEO2000 and cPI-PEO6000.
2.3. Preparation of the copolymers dense films
The resultant viscous copolyamic acid solution was diluted with NMP to attain an appropriate viscosity for casting, filtered through a nominal #1 fritted glass funnel, degassed, and cast onto a levelled glass plate. The resulting film was covered with a conical funnel to avoid too fast evaporation of the solvent, dried at 80 ºC overnight, and treated at 120 ºC for 6 hours in a vacuum oven. For the pure aromatic homopolymer (BPDA-ODA), the procedure was similar but the final heat treatment was carried out at
200 °C in a vacuum oven for 24 hours. Films with 40-60 m in thickness were obtained. The additional thermal treatments (see Figure 2) for the copolymeric films were carried
out under inert atmosphere.
Figure 2. Thermal treatments.
2.4. Characterization Methods
Attenuated total internal reflectance-Fourier transform infrared analyses (ATR-FTIR) were performed at room temperature using a PerkinElmer Spectrum One infrared
A Thermal Analysis Q500 instrument was used for thermogravimetric analysis (TGA).
Disc samples cut from films with weights between 5 and 15 mg were tested. When
running dynamic scans, it was done in Hi-Resolution mode, where the heating rate is automatically adjusted in response to changes in the rate of weight loss, which results in improved resolution, with an initial heating rate of 10ºC/min under a flux of nitrogen.
Differential scanning calorimetry (DSC) analyses were carried out in a Mettler Toledo (DSC 822e) calorimeter equipped with a liquid nitrogen accessory. Disc samples cut from films weighting 5–15 mg were sealed in aluminium pans. Samples were heated with the following cyclic method in order to monitor the changes in thermal properties with thermal treatment: from 25 ºC, the sample was heated at 10ºC/min to a target temperature; once reached, the sample was cooled at the maximum cooling rate accessible for the instrument to -90 ºC, held at this temperature for 15 min to equilibrate and reheated at 10 ºC/min to the next target temperature. The procedure was followed until the last treatment temperature was reached and a final run from -90 ºC to 80 ºC was performed. In this way, in each heating run, the thermal properties for the copolymers after ―instantaneous‖ treatment to the previously reached temperature were
obtained.
Thermomechanical (TMA) tests were performed in a Rheometric Scientific instrument
model DMTA V. Rectangular test pieces of 3 mm width and 20 mm length were cut from films. A distance of 10 mm was set between fixation clamps. Runs were carried
out from ambient temperature at 10 ºC/min with a static stress of 3 MPa.
The densities () of the dense membrane films were determined using a CP225D
Sartorius balance, provided with an immersion density kit.
approximately 7 ºC between the temperature reading at the hot stage display and the real temperature at the sample.
2.5. Gas Permeation and Selectivity
The permeability, P, for several gases (namely: O2, N2, CH4 and CO2) was determined by using a permeator with constant volume and variable pressure which uses the ‗‗time-lag‘‘ operation method. The measurements were carried out at 3 bar at temperatures set
from 30 to 50 ºC. The equations used and the mode of operation of the equipment, as well as an outline of it, has been described previously(Tena et al., 2010).
3. Results and Discussion
3.1 Copoly(ether-imide)s imidization
Poly(ethylene oxide) chains are prone to oxidation (Scheirs et al., 1991), and therefore, a great care was taken to carry out the imidization. The films were heated at 120 ºC for 6 h. After 6 h heating at 120 ºC, the solvent was almost completely removed as proved by thermogravimetric analysis. All the copolymers resulted to be insoluble in DMAc (dimethylacetamide), NMP, Hexane, Toluene, THF (tetrahydrofuran), and CH2Cl2 (dichloromethane) after this process.
Infrared spectra were recorded to check for the progress of imidization. As for other
described copoly(ether imide)s (Marcos-Fernández et al., 2010; Tena et al., 2012b; Tena et al., 2012c), it was possible to observe the IR bands centered around 1774, 1713, 1372 and 738 cm-1, typical for imidized samples, and the peaks appearing around 2800 cm-1, due to the aliphatic polyether segments. There were no noticeable differences between the copolymers with different polyether lengths, or between samples containing PEO and the samples with PEO+HDI.
low temperatures has already been found by us for copoly(ether-imide)s based on PEO segments (Marcos-Fernández et al., 2010; Tena et al., 2012b) and PPO segments (paper in preparation). Also, two works of Okamoto et al., studying similar
copoly(ether-imide)s to the ones presented here, stated that a thermal treatment at 170 ºC completely imidize the precursor poly(amic acid)s to polyimides (Okamoto et al., 1995) although they did not show any IR spectra to prove the imidization state of the copolymers.
3.2 Thermal Stability
Thermogravimetric analysis was performed to evaluate the thermal stability of the synthesized copolymers treated at 120 ºC during 6 hours (Figure 3).
Figure 3. TGA curves in dynamic conditions for the synthesized copolymers.
The behaviour is similar for the different samples. The initial loss from ambient temperature to 100 ºC, can be attributed to the adsorbed water in the sample.A second step approximately from 100 to 250 ºC is due to residual solvent in the film, with a weight loss of 1 to 1.7%. The third step is thought to be due to the contribution of the poly(ethylene oxide) included in the copolymer composition, and it is therefore assigned to the loss of polyether block sequences plus the hexamethylenediisocianate in the case of the copolymers where the polyether chain was extended. The final stage of weight loss is due to the thermal decomposition of the remaining aromatic polyimide segments. For all copolymers, the residual carbon content at 800 ºC was 25-35 %.
The mass loss in this third step for the different copolyimides is close to the percentage of polyether blocks in the feed (see Table 1), proving that it is related to the degradation of this part of the copolymer, as already found previously in other similar copolymers (Marcos-Fernández et al., 2010; Tena et al., 2012b; Tena et al., 2012c). From Figure 3, it is clear that the polyether extended copolymers PEO900+HDI and cPI-PEO2000+HDI start to degrade at lower temperatures (circa 250 ºC) than the other copolymers (circa 350 ºC). This is due to the lower stability of the urea groups formed by the reaction of the HDI. This relatively low thermal stability of the urea groups is
Table 1.-Results obtained by TGA for the prepared copolymers.
Thus, TGA analysis confirmed that the aliphatic-chain thermal stability is much lower than the thermal stability of the aromatic polyimide segments, and therefore a selective degradation of this part of the chain can be performed in these copolymers.
3.3 Calorimetric Studies
The samples were heated in a DSC instrument with a cyclic method in order to monitor the changes in the thermal properties of the films with the thermal treatment. When the polyether moiety is able to crystallize, the melting enthalpy can be used to evaluate the
percentages of amorphous-crystalline PEO in the copolymers (Marcos-Fernández et al., 2010). No transition related to the aromatic polyimide hard segments was detected by
DSC in any case.
A curve with the developed crystallinity for PEO vs. temperature thermal treatment can be built for all copolymers. The melting enthalpy of PEO was taken from literature as 8.67 kJ/mol (Van Krevelen, 1990). In Figure 4 crystallinity is shown for all the copolymers thermally treated at different temperatures.
Figure 4. Crystallinity of the aliphatic part of the copolymers. The copolymers that do not appear don‘t have any crystallinity.
as shown by TGA. From these data it is clear that lengths over 2000 g mol-1 are necessary to develop crystallinity and longer chains develop higher crystallinities.
The samples with extended polyether, cPI-PEO900+HDI and cPI-PEO2000+HDI, have a very characteristic behavior that differs from that shown by PEO900 and cPI-PEO2000. When the polyether chain is extended with HDI, although all the copolymers contain very similar weights of polyether, the molar ratio of the aromatic reactants over the aliphatic ones increases for the copolymers with extended polyether chains, leading to longer aromatic polyimide blocks. This, in turn, leads to an increase in the incompatibility of the blocks and therefore to a better phase separation, as indicated by the higher crystallinity achieved for polyether extended copolymers. In fact, for cPI-PEO900+HDI, crystallinity appears at 200 ºC whilst the parent copolymer cPI-PEO900 remains amorphous at all thermal treatments, and for cPI-PEO2000+HDI, crystallinity is significant from the beginning, and increases further with thermal treatment, with values that are very similar to those for the cPI-PEO6000.
However, when treated at high temperatures, a different behavior is found for polyether extended copolymers. cPI-PEO900+HDI starts to lose crystallinity above 230 ºC and it completely disappears at 260 ºC, whereas cPI-PEO2000+HDI reaches a pseudo plateau between 200 and 240 ºC and above this temperature crystallinity still has a small increase. Although the trend is just the reverse for these two copolymers, the origin of
the behavior is the same. Above 230-240 ºC the urea groups connecting the extended polyether chains start to deteriorate, as shown by TGA, and when this occurs, polyether
chains with free chain ends are produced. The chains with low polyether molecular weight, 900 g mol-1, are unable to crystallize and plasticize the PEO phase, decreasing crystallinity until its disappearance, whereas chains with higher molecular weight, 2000 g mol-1, have less restrictions to crystallize and crystallinity increases (it is worth to point out that the starting bis(2-aminopropyl)poly(ethylene oxide) of 2000 g mol-1 is highly crystalline).
permeation measurement (from 30 to 50 ºC). For all the copolymers, except for cPI-PEO6000, the melting point measured by DSC is below 30 ºC after thermal treatment at any temperature, and therefore, PEO chains will be amorphous. For copolymer
PEO6000, the melting point reaches a value of 43 ºC after thermal treatment at 300 ºC (approximately 40 ºC after treatment at 250 ºC), thus, when measuring permeation properties at 50 ºC, PEO chains will be amorphous, but at 30 ºC, part of the these PEO chains could still be crystallized.
In figure 5 we can see the changes in the polyether Tg for the different treatment temperatures. Only minor variations are seen, and Tg remains almost unchanged with thermal treatment except for copolymers PEO900+HDI and PEO2000+HDI.
Figure 5. Tg of the aliphatic part of copolymers after ‗‗instantaneous‖ treatment for the copolymers treated at 160 ºC.
For these two HDI extended copolymers, when urea groups start to degrade for treatments above 220 ºC, Tg increases. This could be interpreted as an increase in the mixing of the rigid polyimide segments in the polyether phase. This increase in Tg is very noticeable for copolymer PEO900+HDI, and coincident with the decrease in crystallinity of the PEO phase. For copolymer PEO2000+HDI the change coincides also with the small increase in crystallinity produced by urea groups degradation, but because of the ability of the PEO chains of 2000 g mol-1 to crystallize, the mixing of the aromatic polyimide segments in the PEO phase is very limited and the increase in Tg is very small. If we compare the Tg values after treatment at 200 ºC, where the Tg is practically constant for all the copolymers and the copolymers with extended polyether chain have not started to degrade, it follows the expected trend for the copolymers with un-extended polyether chain, the longer the PEO chain, the lower the Tg:
(PEO6000) < (PEO2000) < (PEO900)
similar to the value for PEO6000, and for PEO900+HDI is around 6 ºC higher, probably due to the restrictions imposed by hydrogen bonds between the urea groups, present in a higher concentration in PEO900+HDI compared to PEO2000+HDI. Yet, Tg for PEO900+HDI is almost 10 ºC lower than for copolymers with PEO2000.
Thus, from these results, it can be affirmed that for all the copolymers studied, at a temperature of permeation of 50 ºC, the polyether segments were totally amorphous and well above their Tg.
3.4. Thermomechanical Analysis
Thermomechanical analysis was carried out in order to detect the glass transition temperature of the aromatic polyimide hard segments, which could not be detected by DSC. It was assumed that a good estimation of Tg corresponds to the temperature when strain is 10 times that of the sample at 100 ºC. This criterion could be accepted at least for comparative purposes (Marcos-Fernández et al., 2010). The so-obtained results for samples treated at 160ºC for 2 hours in order to develop a phase separated structure are shown in Figure 6.
Figure 6. Tg for the aromatic polyimide segments as a function of the PEO length for the copolymers treated at 160 ºC.
All samples have similar content in PEO, but because of the stoichiometry, the longer the polyether chain, the longer the aromatic polyimide would be, and therefore, the higher the of the aromatic polyimide segments, as shown in Figure 6. The order is:
(cPI-PEO900)< (cPI-PEO900+2000)< (cPI-PEO2000)< (cPI-PEO6000)
length decreases (HDI content increases). In these copolymers, although the longer polyimide segments lead to a better phase-separated polyether phase (and bigger domains, as it will be shown latter in SAXS), apparently, the polar urea groups in the
polyether chains also produce some mixing in the polyimide phase lowering the Tg. This decrease is of the some order than the increase due to the longer polyimide chains for copolymer cPI-PEO900+HDI, and the Tg value is approximately the same as for the copolymer with the parent polyether, PEO900, whereas for copolymer cPI-PEO2000+HDI is slightly higher and Tg value is slightly lower than for the copolymer with the parent polyether, cPI-PEO2000.
For all the copolymers, the Tg of the aromatic polyimide is well above ambient temperature, although lower than the corresponding Tg for a pure aromatic polyimide homopolymer (270 ºC(Okamoto et al., 1995), 287,3 ºC (Zhang et al., 1999), 305 ºC (Marcos-Fernández et al., 2010)), due to the much lower polymerization degree and, consequently, lower length of the aromatic polyimide segments in the copolymer as compared to the corresponding homopolymer.
3.5. Density
The densities () of the dense membrane films were determined according to the equation:
0
air
air liq
W
W W
(1)
where is the density of the film, Wair and Wliq are the weights of the film in the air and
immersed in an auxiliary liquid (in these measurements, isooctane was used because
(cPI-PEO900)=1.308 > (cPI-PEO900+2000)=1.303 > (cPI-PEO2000)=1.294 >
(cPI-PEO6000)=1.281 > (cPI-PEO2000+HDI)=1.276) > (cPI-PEO900+HDI)=
1.266
It is clear that the longer the polyether chain, that is, the better the phase separation, the lower the density should be but, actually, the differences within the copolymers are very small as shown in Figure 7. Copolymers with extended polyether chains, with long polyether chains and well developed phase separation – as well as cPI-PEO6000 – should give low densities. These copolymers should give big free volumes and thus gas should pass through the membrane quite easily if there were no cristallinity (cPI-PEO6000) and/or hydrogen bonding (HDI extended copolymers).
Figure 7. Density as a function of the polymer length.
Note that density decreases when increases and TgAldecreases. The lower densities
and lower TgAl appear due to the ability of the polar groups placed throughout the
polymer chains to increase the intermolecular forces increasing the free volume along with the mobility of the PEO chains.
3.6. Small-Angle X-ray Scattering
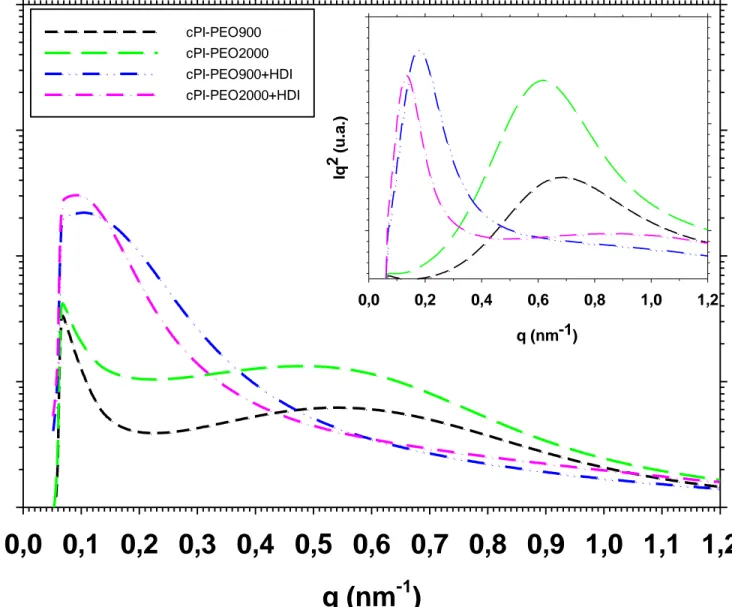
From the curves of scattered intensity I versus the scattering vector (q = 4π(sinθ)/λ, λ = wave length, 2θ = scattering angle), two parameters can be evaluated: the relative invariant, Q‘, as the integral below the curve Iq2
vs. q, which is related to the extent of the phase separation; and the maximum on the scattering curve, qmax, related to the size scale, L, of the separated phases, calculated also from the curve Iq2 vs. q. The equations used and the mode of operation of the equipment, as well as an outline of it has been explained in previous studies(Tena et al., 2012b).
polyether extended copolymers, cPI-PEO900+HDI and cPI-PEO2000+HDI, the maximum in the scattered intensity is located close to the beam stop (see inset in Figure 8 were these peaks appear clearer).
Figure 8. Intensity (logarithmic scale) vs q curves for copolymers PEO900, cPI-PEO2000, cPI-PEO900+HDI and cPI-PEO2000+HDI. In the insert, the Iq2 vs q curves for the same copolymers are presented.
In Figure 9, the relative invariant (Q‘) is plotted versus treatment temperature. Copolymers with the extended polyethers were heated up to 250ºC (before degradation of the urea groups), whereas the others until 300ºC. For copolymer cPI-PEO-900, Q‘
does not change significantly with temperature, with only a small increase above approximately 165ºC. For this copolymer, with the shortest polyether chain and the
shortest polyimide segments of those synthesized here, the segments are partially mixed, as seen in the DSC results, and the phase separated structure almost doesn‘t improve with thermal treatment. For copolymers cPI-PEO2000, cPI-PEO900+2000 and cPI-PEO6000, at a certain temperature (approximately 180, 170 and 150ºC respectively), Q‘ increases noticeably up to the final heating temperature, showing a
notorious improvement on their phase separated structure. The same improvement is found for the polyether extended copolymers PEO900+HDI and cPI-PEO2000+HDI, starting in both cases at approximately 180ºC up to the final heating temperature. This improvement is coincident with the increase in PEO crystallinity seen by DSC and, as already mentioned, it is also coincident with the release of the residual solvent in the films.
Figure 9. Changes in the relative invariant for the synthesized copolymers treated at
120ºC.
scale of the segregated phases, thus, Iq2 vs. q curve was used to calculate L attending to the higher accuracy in determining the maximum on this curve.
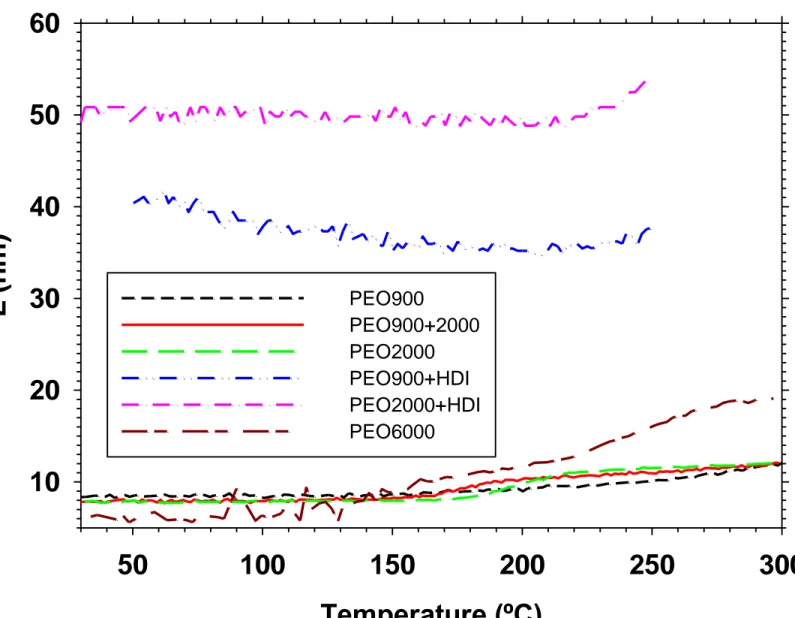
As shown in Figure 10, changes in L take place almost simultaneously to changes in Q‘. Big differences are found referring to L between the copolymers with the extended polyether chains and those with the parent polyethers. For copolymers cPI-PEO900, cPI-PEO2000, cPI-PEO900+2000 and cPI-PEO6000, L is initially similar for all of them, circa 8 nm, and on heating, grows to a value around 12 nm (i.e. an approximate 50% increment), except for cPI-PEO6000, for which the value reached is almost 19 nm (around 300% increment). This longer L value means bigger PEO domains that are able to crystallize extensively as seen by DSC. Therefore, there is not a trend between L value and polyether length, and only for polyether PEO6000, the L value is clearly above the others. Apart from the strong increase on L for copolymer cPI-PEO6000, it is worth to comment that for copolymer cPI-PEO900, although Q‘ has a very small increase with temperature, L value changes as much as for copolymers cPI-PEO2000 and cPI-PEO900+PEO2000.
Copolymers with extended polyether chains have a very high L value from the start, around 40 nm for cPI-PEO900+HDI and 50 nm for cPI-PEO2000+HDI, and when Q‘ increases, the increase in L is very modest, around 8% for both. This large L corresponds to very large PEO domains, and that is the reason why cPI-PEO2000+HDI
can reach also very high values of PEO crystallinity, of the order of cPI-PEO6000.
Figure 10. Evolution of L as a function of temperature for the synthesized copolymers.
From SAXS data it can be concluded that thermal treatment improves the phase separated structure except for cPI-PEO900, where the segments are mixed in a substantial extent. For this copolymer, however, a significant change in long spacing takes place with thermal treatment. The size scale of the phase separated structure after thermal treatment is similar for copolymers with parent copolyethers PEO900 and PEO2000, and is much bigger for copolymer based on polyether PEO6000. For copolymers with extended polyether chains, the size scale of the phase separated
polyimide segment length, thus, chain extension of relatively short polyether chains is a very effective way to modify the phase separated structure of the copolymers.
3.7. Permeability properties
3.7.1. Behaviour with the thermal treatment
As seen for other aliphatic-aromatic copoly(ether imide)s (Tena et al., 2012c), the results show an improvement in permeation properties after thermal treatment while selectivity remains substantially constant, so that there is a direct relationship between: treatment temperature, phase segregation and permeation properties as can be seen in Figure 11 for the sample cPI-PEO900+2000.
Figure 11. Evolution of the permeability (a) and selectivity (b) as a function of the treatment temperature for cPI-PEO900+2000.
In the case of samples with extended polyether chain, the picture is somewhat different. Figure 12 shows the comparative behavior of sample cPI-PEO900+2000 with samples cPI-PEO900+HDI and cPI-PEO2000+HDI. As already seen, segregation increases with heat treatment, but by TGA and DSC it was clear that at certain temperature, urea groups decompose. When polyether extended copolymers are heated at 200ºC for 2 hours in an oven, urea groups would decompose, producing some mixing of segments and some loss of polyether chains that lead to the observed decrease in CO2 permeability.
Figure 12. CO2 permeability as a function of the thermal treatment.
3.7.2. Behaviour with the measurement temperature
condensation. In this sense it is very important to know the properties of the polymers that have a strong influence on the process of separation, such as the free volume. When a polymer is in the crystalline state, the gases hardly penetrate across this structure
because the chain movements are very limited giving quite low permeability. The crystals would operate as a non-sorption, impermeable barrier and reduce the permeability severely. On the other hand, when the melting temperature, Tm, is surpassed, the polymer is amorphous, making chains more mobile and thus favoring the permeation of gases through the samples. Therefore, in samples that present or may present crystallinity at work temperature, it is advisable to conduct a study of their behavior as a function of measurement temperature.
Taking into account the temperature dependence for the diffusion and sorption coefficients, the temperature effect on gas permeability follows an Arrhenius law (Kesting and Fritzsche, 1993):
(2)
where EP is the activation energy of permeation. In Figure 13 the Arrhenius‘ increase of permeability with the measurement temperature is shown for several gases and the cPI-PEO6000 sample. Several intermediate permeabilities at temperatures from 30 ºC to 50 ºC are shown in the Figure. The activation energy of permeation is shown in Figure 14 as a function of the PEO length. It seems clear that cpI-PEO-6000 has lower activation energy than expected. This could be attributable to its residual crystallinity.
Figure 13. CO2 permeability as a function of permeation temperature for cPI-PEO6000 membranes treated at 160ºC.
Figure 14. Activation energy as a function of the molecular weight of PEO (a) and for the longest PEO copolymers (b). In the (a) figure only cPI-PEO2000+HDI, among the copolymers with the longest PEO chains, is shown.
Some authors have recently assumed that there should be a maximum length over which permeability decreases (Hangzheng et al., 2010; Yave et al., 2010). As mentioned
above, the amount of crystalline PEO in these samples is important especially for the longest PEO chains (especially cPI-PEO6000). Could this crystallinity be the cause of such an apparent decrease in permeability for copolyetherimides containing very long PEO chains?
In order to analyze the influence of crystallinity in an eventual decrease of permeability for long PEO chains. It is worth to note that at 50 ºC all residual crystallinity would be eliminated for all the copolymers studied guaranteeing that all they are in amorphous state.
Figure 15 shows the results obtained, at the lowest (30 ºC) and the highest (50 ºC) permeation temperature, for the permeability of CO2 (the trend is similar for all gases tested). The results at 30 °C show that there is a maximum length over which permeability decreases as seen in literature. However, the results at 50 °C show that there is a monotonous increase of permeability for increasing PEO lengths. This is clear for samples containing only pure PEO. For samples with HDI in its structure permeabilities are lower than for the sample cPI-PEO6000. For the polymers with chain extender (HDI) the restriction of chain motion due to possible hydrogen bonds in
between urea groups in the soft segments would produce a reduction in the permeability values. The existence of these hydrogen bonds that restrict polyether chain mobility has
already been proved in aromatic isocyanate chain extended polyethers (Marcos-Fernández et al., 1997).
Figure 15. CO2 permeability (a) and selectivities (b) for some gas pairs as a function of the PEO length, for HDI extended copolymers (treated at 160 ºC) and for the rest of copolymers (treated at 250 ºC).
Therefore it seems clear that when permeation is measured at a high enough temperature to have only amorphous PEO longer chains improves the passage of gases.
performance. Referring to selectivities, it seems clear that they can be considered almost constant; what means that for these block-copolymers, the aromatic part determines the selectivity of the sample (as mentioned in this study the proportion of PEO is almost
constant). This leads to a clear possibility of controlling permeability without damaging selectivity by simply increasing the length of PEO chains. On the other hand by varying the aromatic part, higher selectivity could, of course, be obtained. Naturally, for the copolymers that are already amorphous at 30 ºC, permeability increases with the permeation temperature while selectivity decreases only very slightly.
3.7.4. Permselective properties as a function of the PEO percentage
For all samples the content of PEO is quite similar, ranging from 42 to 45 %, (between 42 and 49 % considering the HDI+PEO content— see Table 1). Consequently the effect of the polyether proportion should be very small in permeability. Here results for both the permeation temperatures of 30 and 50 °C are considered too.
Figure 16a shows the evolution of permeability as a function of the percentage of total polyether in the final polymer. It seems clear that the amount of total polyether or PEO doesn‘t play a decisive role for this narrow range of percentages, and therefore it is the
length of the PEO chains the key parameter.
In the case of samples with chain extender (HDI), that have the highest percentages of polyether in the sample, it can be seen that they don‘t show the best permeabilities. The
reduction of mobility of the chains causes lower permeability (Marcos-Fernández et al., 1997) and activation energies as seen in Figure 14.
Figure 16. CO2 permeability (a) and selectivities (b) for some gas pairs as a function of the PEO percentage for HDI extended copolymers (treated at 160 ºC) and for the rest of copolymers (treated at 250 ºC).
It has been carried out an analysis of the influence of the percentage of polyether on the selectivity for different gas pairs. Figure 16b shows the selectivity for the synthesized
of polyether. A comparison of selectivity with those of the pure aromatic polyimide, and pure PEO shows that for the couples O2/N2 and CO2/CH4 selectivities are between those of both BPDA-ODA and pure PEO. In the case of couples CO2/N2 and CH4/N2, the samples showed exceptional results, surpassing the selectivities of BPDA-ODA and pure PEO.
3.7.5. Robeson’s plot
After confirming that the working temperature and the length of the PEO chains, for similar percentages of polyether, play key roles in permeation properties, these permselective properties are themselves considered here on. A visual way of representing the permeability values obtained for different gases are the Robeson‘s representations (Robeson, 1991, 2008). In these representations the distance to the so called upper bond gives us an idea of the permeation properties of the samples.
In addition to our copolymers, we have represented the values for pure PEO at 35 ºC (Lin and Freeman, 2004) and for BPDA-ODA (synthesized in our lab) at 30 ºC. The representative points for our copolymers should be in between these two values. As it‘s well known, the Robeson‘s upper bounds depend on the measurement temperature (Rowe et al., 2010). This is also taken into account when comparing data at 30 and at 50 °C.
Figure 17. Robeson‗s plot for O2/N2. Full circles correspond to a temperature of permeation of 30 ºC; while hollow ones were measured at 50 ºC.
Figure 18. Robeson‗s plot for CO2/CH4. Full circles correspond to a temperature of permeation of 30 ºC; while hollow ones were measured at 50 ºC.
Figure 19. Robeson‗s plot for CO2/N2. Full circles correspond to a temperature of permeation of 30 ºC; while hollow ones were measured at 50 ºC.
In these Figures, the crosses correspond to BPDA-ODA and the stars to pure PEO. The full circles represent the measurements at 30 °C and the hollow circles represent the
measurements at 50 °C. The best permeabilities at 30 °C were given by the cPI-PEO2000 sample; whereas for 50 ºC, the best results are shown by cPI-PEO6000. As already mentioned, the high permeability for cPI-PEO6000 is due to the elimination of all crystallinity in this copolymer at 50 °C. Therefore the high length of cPI-PEO6000 leads to higher permeability.
For couples O2/N2 and CO2/CH4 (Figure 17 and 18), the results are far from their respective upper bound. For the couple CO2/N2 the polymers showed an excellent performance (see Figure 19). Whereas when the measuring temperature was 30 ºC the polymers showed values close to the Robeson‘s limit, when the measurement temperature was 50 ºC results clearly are even closer to the upper bound for this temperature. For the couple CH4/N2 the polymers showed a reverse selectivity getting reasonably good figures. For this couple, there is not a Robeson‘s plot thus a tentative limit (drawn by us) is shown in Figure 20 (Tena et al., 2012c).
3.7.6. Permeability prediction
The permeability for the samples BPDA-ODA-PEO with different PEO lengths in the polymer may be predicted by the Maxwell equation as exposed below (Maxwell, 1954):
(3)
where Peff is the effective permeability, PC and PD are the permeability of the continuous
state is used as the permeability of the soft segments (continuous phase) (Lin and Freeman, 2004) and the permeability of BPDA-ODA to the hard segments (disperse phase).
Figure 21. Predicted values for CO2 and N2 permeability (a) and CO2/N2 selectivity (b) using Maxwell equation along with the corresponding experimental results.
Figure 21 shows the prediction of permeability and selectivity prediction for the CO2/N2 gas pair according to the Maxwell model. The model shows a good fit for permeability, although samples with high crystallinity showed a slightly poorer fit, and the polymers with longer PEO have the highest crystallinity. On the other hand, the phase segregation
was better for longer PEO chains, thus the model should be better adapted. Referring to selectivity, the fit was acceptable for all samples. This model brings new evidence of the
importance of crystallinity in the samples, so for that to get the best fit, it is necessary that the samples are in amorphous state and phase segregation be as high as possible.
4. Conclusions
A series of copoly(ether-imide)s with approximately 45% weight of polyether in the final copolymer presenting good gas separation properties have been prepared. These copolymers have been synthesized by the reaction between an aromatic dianhydride (BPDA), an aromatic diamine (ODA) and a diamine terminated poly(ethylene oxide) having a different molecular weight (900, 2000 and 6000 g / mole), or diisocyanate (HDI) extended poly(ethylene oxide) 900 and 2000 with the aim of obtaining a greater length of PEO (approximately 6000 g/mol) but with less tendency to crystallization.
TGA analysis confirmed the weight amount of PEO in the copolymers and showed that the polyether moiety can be eliminated selectively by thermal treatment. Thermal treatment decreased the Tg value for the polyether phase in the completely amorphous copolymers or increased its crystallinity for the copolymers with polyether crystallization capability except for copolymer with the shortest PEO, cPI-PEO900 for which no change in thermal properties was observed. For the chain extended polyethers,
separation in these copolymers. TMA data complemented DSC data and a Tg well above ambient temperature for the aromatic polyimide phase was measured. This Tg increased with the increase of PEO length due to the increase in the aromatic polyimide
segment length, but for the copolymers with chain extended polyethers, the value was lower than expected, probably due to some mixing of soft segments in the hard segment phase promoted by the urea groups.
SAXS analysis confirmed the existence of a phase separated morphology in these copolymers that improved when they were thermally treated at increasing temperatures below the temperature of the onset of decomposition. After initial treatment temperatures that released the remaining solvent in the imidized copolymers, a fast improvement in the phase separation was produced at higher temperatures.. The size scale of the phase separated structure was initially similar for the copolymers based on the parent polyethers, around 8 nm, and increased simultaneously with the improvement in the phase separation up to a value of 12 to 19 nm. For the copolymer with chain extended polyethers, long spacing was much higher, 40 to 50 nm, with almost no change with treatment temperature. The large size of the phases would explain the DSC results for these copolymers.
Gas permeability for the synthesized copolymers was directly related to the phase separated structure present in the material, with an increase in permeability when
treatment temperature, and phase separation, was increased. For copolymers with chain extended polyethers, the degradation of the urea groups led to an increase of segregation
but with considerable internal bonding that led to a decrease in permeability. At the same time, selectivity was almost unaffected and remained constant at any treatment temperature. In this way, we could conclude that chain enlarging with HDI is not efficient in increasing permeability.
sufficiently high so that all the PEO is in amorphous state, 50 °C. Thus, it was observed that the greater the length of PEO the higher permeability was observed, because the PEO is in purest state. For samples with HDI results were lower than for the sample
with PEO6000 owing to the hydrogen bridges forming urea structures. The results of selectivity for all PEO lengths were similar.
Analyzing the results in terms of percentage of PEO in the samples, the highest results were found for 43.5 % for the measurement at a temperature of 30 °C, which corresponds to the sample PEO2000, and to values close to 45 % when as the temperature is 50 ºC, which coincides with the sample PEO6000. This again highlights the importance of crystallinity, when all the poly(ethylene oxide) is in amorphous state, the best values are for the longest PEO, the 6000 in this case.
Regarding the Robeson‘s plots, the best results were found for the CO2/N2 gas couple.
At 30 °C the results are quite close to the Robeson upper bound, and in the case of the measures at 50 °C the permselectivity closely approaches the limit for this temperature. In conclusion it seems clear that this type of polymer is suitable for separations where CO2 is involved, and especially for the separation CO2/N2. This separation has a great importance in the greenhouse effect and makes these membranes good candidates for their application at industrial level. An interesting application of CO2/N2 separation is in the purification of coal gas. In this process the working temperatures are high, so this
type of materials is presented as an attractive alternative.
We have compared the results with those calculated by using the Maxwell‘s model. In this case also the percentage of amorphous PEO should be used and crystallinity has to be taken into account for low permeation temperatures. The samples with a low or negligible crystallinity showed a good fit. The need to take into account the truly amorphous portion of PEO makes necessary to optimize both the amount of poly(ethylene oxide) in the sample and the operating temperature for a specific length and amount of PEO.
We are indebted to the Spanish Junta de Castilla León for financing this work through the GR-18 Excellence Group Action and to the Ministry of Science and Innovation in Spain for their economic support of this work (MAT2008-00619/MAT,
MAT2010-20668/MAT, MAT2011-25513/MAT and CIT-420000-2009-32). We also acknowledge financial support from the programme Consolider Ingenio 2010 (project CSD-0050-MULTICAT).
Authors thank the access to the beamline BM16 at the European Synchrotron Radiation Facility (ESRF) in Grenoble (France). We are grateful to Dr. Ana Labrador and Dr. François Fauth for their help at BM16 station at the ESRF. The help provided by Sara Rodriguez in measuring gas permeability and selectivity is greatly appreciated. A. Tena thanks CSIC for a predoctoral JAE fellowship.
6. References.
Ayala, D., Lozano, A.E., De Abajo, J., García-Perez, C., De La Campa, J.G., Peinemann, K.V., Freeman, B.D., Prabhakar, R., 2003. Gas separation properties of aromatic polyimides. Journal of Membrane Science 215, 61-73.
Baltá-Calleja, F.J., Vonk, C.G., 1989. X-ray scattering of synthetic polymers. Elsevier. Barbari, T.A., Koros, W.J., Paul, D.R., 1988. Gas transport in polymers based on bisphenol-A. Journal of Polymer Science, Part B: Polymer Physics 26, 709-727.
Bessonov, M.T.K., M.M.; Kudryavtsev, V.V.; Laius, L.A., 1987. Polyimides: Thermally Stable Polymers. Consultants Bureau, New York.
Bounaceur, R., Lape, N., Roizard, D., Vallieres, C., Favre, E., 2006. Membrane processes for post-combustion carbon dioxide capture: A parametric study. Energy 31, 2220-2234.
Brandrup, J.I., E.H.; Grulke, E.A., 1999. Polymer handbook, 4th edition ed. John Wiley & Sons Inc, New York.
Car, A., Stropnik, C., Yave, W., Peinemann, K.V., 2008. Pebax®/polyethylene glycol blend thin film composite membranes for CO2 separation: Performance with mixed gases. Separation and Purification Technology 62, 110-117.
Casado-Coterillo, C., Soto, J., T. Jimaré, M., Valencia, S., Corma, A., Téllez, C., Coronas, J., 2012. Preparation and characterization of ITQ-29/polysulfone mixed-matrix membranes for gas separation: Effect of zeolite composition and crystal size. Chemical Engineering Science 73, 116-122.
Davison, J., 2007. Performance and costs of power plants with capture and storage of CO2. Energy 32, 1163-1176.
EIA, U.S., 2011. International Energy Outlook Washington, DC.
Figueroa, J.D., Fout, T., Plasynski, S., McIlvried, H., Srivastava, R.D., 2008. Advances in CO2 capture technology—The U.S. Department of Energy's Carbon Sequestration Program. International Journal of Greenhouse Gas Control 2, 9-20.
Ghosh, M.K.M., K.L., 1996. Polyimides: Fundamentals and Applications. Marcel Dekker, New York.
Hangzheng, C., Youchang, X., Tai-Shung, C., 2010. Synthesis and characterization of poly (ethylene oxide) containing copolyimides for hydrogen purification. Polymer 51, 4077-4086.
Herzog, H.J., 2001. What future for carbon capture and sequestration? Environmental Science and Technology 35, 148-153.
Hirayama, Y., Kase, Y., Tanihara, N., Sumiyama, Y., Kusuki, Y., Haraya, K., 1999. Permeation properties to CO2 and N2 of poly(ethylene oxide)-containing and crosslinked polymer films. Journal of Membrane Science 160, 87-99.
Ho, M.T., Allinson, G.W., Wiley, D.E., 2008. Reducing the Cost of CO2 Capture from Flue Gases Using Pressure Swing Adsorption. Industrial & Engineering Chemistry Research 47, 4883-4890.
Ho, M.T., Allinson, G.W., Wiley, D.E., 2009. Factors affecting the cost of capture for Australian lignite coal fired power plants. Energy Procedia 1, 763-770.
Hoffmann, S., Bartlett, M., Finkenrath, M., Evulet, A., Ursin, T.P., 2008. Performance and Cost Analysis of Advanced Gas Turbine Cycles With Pre-Combustion CO[sub 2] Capture. ASME Conference Proceedings 2008, 663-671.
Kawakami, M., Iwanaga, H., Hara, Y., Iwamoto, M., Kagawa, S., 1982. Gas permeabilities of cellulose nitrate/poly(ethylene glycol) blends membranes. Journal of Applied Polymer Science 27, 2387-2393.
Kesting, R.E., Fritzsche, A.K., 1993. Polymeric gas separation membranes. Wiley. Klara, J.M., Capicotto, P.J., Pinkerton, L.L., Schoff, R.L., Vaysman, V., 2009. Cost and Performance Baseline For Fossil Energy Plants, in: Laboratory, N.E.T. (Ed.).
Klemeš, J., Bulatov, I., Cockerill, T., 2007. Techno-economic modelling and cost functions of CO2 capture processes. Computers & Chemical Engineering 31, 445-455.
Li, Y., Ding, M., Xu, J., 1997. Gas separation properties of aromatic polyetherimides from 1,4-bis(3,4-dicarboxyphenoxy)benzene dianhydride and 3,5-diaminobenzic acid or its esters. Journal of Applied Polymer Science 63, 1-7.
Lin, H., Freeman, B.D., 2004. Gas solubility, diffusivity and permeability in poly(ethylene oxide). Journal of Membrane Science 239, 105-117.
Marcos-Fernández, A., Lozano, A.E., González, L., Rodríguez, A., 1997. Hydrogen Bonding in Copoly(ether−urea)s and Its Relationship with the Physical Properties. Macromolecules 30, 3584-3592.
Marcos-Fernández, A., Tena, A., Lozano, A.E., de la Campa, J.G., de Abajo, J., Palacio, L., Prádanos, P., Hernández, A., 2010. Physical properties of films made of copoly(ether-imide)s with long poly(ethylene oxide) segments. European Polymer Journal 46, 2352-2364.
Maxwell, J.C., 1954. A treatise on electricity and magnetism, vol. 1. Dover Publications Inc, New York.
Merkel, T.C., Lin, H., Wei, X., Baker, R., 2010. Power plant post-combustion carbon dioxide capture: An opportunity for membranes. Journal of Membrane Science 359, 126-139.
with piperazine-promoted potassium carbonate. International Journal of Greenhouse Gas Control 2, 539-552.
Okamoto, K.I., Fujii, M., Okamyo, S., Suzuki, H., Tanaka, K., Kita, H., 1995. Gas permeation properties of poly(ether imide) segmented copolymers. Macromolecules 28, 6950-6956.
Okamoto, K.U., N.; Okamyo, S.; Tanaka, K.; Kita, H., 1993. Selective permeation of carbon dioxide over nitrogen through polyethyleneoxide-containing polyimide membranes. Chemistry Letters 5, 225-228.
Qin, F., Wang, S., Kim, I., Svendsen, H.F., Chen, C., 2010. Study of the Heat of Absorption of CO2 in Aqueous Ammonia: Comparison between Experimental Data and Model Predictions. Industrial & Engineering Chemistry Research 49, 3776-3784.
Reijerkerk, S.R., Knoef, M.H., Nijmeijer, K., Wessling, M., 2010. Poly(ethylene glycol) and poly(dimethyl siloxane): Combining their advantages into efficient CO2 gas separation membranes. Journal of Membrane Science 352, 126-135.
Robeson, L.M., 1991. Correlation of separation factor versus permeability for polymeric membranes. Journal of Membrane Science 62, 165-185.
Robeson, L.M., 2008. The upper bound revisited. Journal of Membrane Science 320, 390-400.
Rowe, B.W., Robeson, L.M., Freeman, B.D., Paul, D.R., 2010. Influence of temperature on the upper bound: Theoretical considerations and comparison with experimental results. Journal of Membrane Science 360, 58-69.
Scheirs, J., Bigger, S.W., Delatycki, O., 1991. Characterizing the solid-state thermal oxidation of poly(ethylene oxide) powder. Polymer 32, 2014-2019.
Suzuki, H., Tanaka, K., Kita, H., Okamoto, K., Hoshino, H., Yoshinaga, T., Kusuki, Y., 1998. Preparation of composite hollow fiber membranes of poly(ethylene oxide)-containing polyimide and their CO2/N2 separation properties. Journal of Membrane Science 146, 31-37.
Tanaka, K., Kita, H., Okamoto, K., Nakamura, A., Kusuki, Y., 1989. Gas permeability and permselectivity in polyimides based on 3,3',4,4'-biphenyltetracarboxylic dianhydride. Journal of Membrane Science 47, 203-215.
Tena, A., Fernández, L., Sánchez, M., Palacio, L., Lozano, A.E., Hernández, A., Prádanos, P., 2010. Mixed matrix membranes of 6FDA-6FpDA with surface functionalized γ-alumina particles. An analysis of the improvement of permselectivity for several gas pairs. Chemical Engineering Science 65, 2227-2235.
Tena, A., Lozano, A.E., Palacio, L., Marcos-Fernández, A., Prádanos, P., de Abajo, J., Hernández, A., 2012a. Gas separation properties of systems with different amounts of long poly(ethylene oxide) segments for mixtures including carbon dioxide. International Journal of Greenhouse Gas Control send it.
Tena, A., Marcos-Fernández, A., Lozano, A.E., de la Campa, J.G., de Abajo, J., Palacio, L., Prádanos, P., Hernández, A., 2012b. Thermally treated copoly(ether-imide)s made from bpda and alifatic plus aromatic diamines. Gas separation properties with different aromatic diamimes. Journal of Membrane Science 387–388, 54-65.
Tena, A., Marcos-Fernandez, A., Palacio, L., Cuadrado, P., Pradanos, P., De Abajo, J., Lozano, A.E., Hernandez, A., 2012c. Phase Segregation and Gas Separation Properties of Thermally Treated Copoly(ether-imide) from an Aromatic Dianhydride, an Aromatic Diamine and Various Aliphatic Diamines. Industrial & Engineering Chemistry Research.
Van Krevelen, D.W., 1990. Properties of polymers third edition. Elsevier, Amsterdam, p. 120
Yamasaki, A., 2003. An Overview of CO2 Mitigation Options for Global Warming-Emphasizing CO2 Sequestration Options. Journal of chemical engineering of Japan 36, 361-375.
Yang, H., Fan, S., Lang, X., Wang, Y., Nie, J., 2011. Economic Comparison of Three Gas Separation Technologies for CO2 Capture from Power Plant Flue Gas. Chinese Journal of Chemical Engineering 19, 615-620.
Yang, H., Xu, Z., Fan, M., Gupta, R., Slimane, R.B., Bland, A.E., Wright, I., 2008. Progress in carbon dioxide separation and capture: A review. Journal of Environmental Sciences 20, 14-27.
Yave, W., Szymczyk, A., Yave, N., Roslaniec, Z., 2010. Design, synthesis, characterization and optimization of PTT-b-PEO copolymers: A new membrane material for CO2 separation. Journal of Membrane Science 362, 407-416.
Figure 1. Chemical structure of the monomers.
o
o
o o
o
o
o NH2
H2N
BPDA
ODA
Aromatic Diamine
Dianhydride
Aliphatic Diamine
H
2N
O
O
NH
2n
PEO X Diamine Terminated
Where X = 900 and 2000
O
C
N
CH
2N
C
O
6
HDI
Chain Extender
H
2N
O
O
NH
2n
α,ω-Diamine-poly(ethylene oxide) PEO6000
O C N CH
2N C O
6
Figures TENA et al FINAL.pptx
Figure 2. Thermal treatments.
Time (minutes)
0
500
1000
1500
2000
2500
T
emp
er
at
u
re
(
ºC
)
0
50
100
150
200
250
300
80 ºC
12 hours
6 hours
2 hours
180 ºC
200 ºC
250 ºC
120 ºC
Vacuum
2 hours 2 hours
Figure 3.TGA curves in dynamic conditions for the synthesized copolymers.
Temperature (ºC)
0
100
200
300
400
500
600
700
800
We
ig
h
t
(%
)
20
30
40
50
60
70
80
90
100
Figure 4. Crystallinity of the aliphatic part of the copolymers. The copolymers that do not
appear don’t have any crystallinity.
Treatment Temperature (ºC)
100
150
200
250
300
350
Cr
y
s
ta
ll
in
it
y
(
%
)
0
10
20
30
40
Figure 5. T
gof the aliphatic part of copolymers after
‘‘instantaneous” treatment for the
copolymers treated at 160 ºC.
Treatment Temperature (ºC)
100
150
200
250
300
350
T
gAl
(ºC
)
-70
-60
-50
-40
-30
-20
-10
0
cPI-PEO900
Figure 6. T
gfor the aromatic polyimide segments as a function of the PEO length for the
copolymers treated at 160 ºC.
PEO M
W(g/mol)
0
1000
2000
3000
4000
5000
6000
7000
T
gA
r
(º
C
)
150
160
170
180
190
200
210
220
230
cPI-PEO2000
cPI-PEO2000+HDI
cPI-PEO6000
cPI-PEO900+HDI
cPI-PEO900
Figure 7. Density as a function of the polymer length.
Longitud PEG vs Tg aromatica Longitud PEG vs Tg aromatica Longitud PEG vs Tg aromatica Longitud PEG vs Tg aromatica Longitud PEG vs Tg aromatica Longitud PEG vs Tg aromatica
PEO M
W(g/mol)
0
1000
2000
3000
4000
5000
6000
7000
Den
si
ty
(
g
·cm
-3
)
1.20
1.25
1.30
1.35
1.40
cPI-PEO900+2000
cPI-PEO2000
cPI-PEO2000+HDI
cPI-PEO6000
Figure 8. Intensity (logarithmic scale) vs q curves for copolymers PEO900,
cPI-PEO2000, cPI-PEO900+HDI and cPI-PEO2000+HDI. In the inse
r
t, the Iq
2vs q curves
for the same copolymers are presented.
q (nm-1)
0,0 0,2 0,4 0,6 0,8 1,0 1,2
Iq
2 (u
.a
.)
q (nm
-1)
0,0 0,1 0,2 0,3 0,4 0,5 0,6 0,7 0,8 0,9 1,0 1,1 1,2
I
(u
.a
.)
Figure 9. Changes in the relative invariant for the synthesized copolymers treated at
120ºC.
Temperature (ºC)
50
100
150
200
250
300
Q
'
(a
.u
.)
cPI-PEO900
Figure 10. Evolution of L as a function of temperature for the synthesized copolymers
.
Temperature (ºC)
50
100
150
200
250
300
L
(
n
m)
10
20
30
40
50
60
PEO900
Figure 11. Evolution of the permeability (a) and selectivity (b) measured at 30ºC as a
function of the treatment temperature for cPI-PEO900+2000.
Treatment Temperature (ºC)
100 120 140 160 180 200 220 240 260
Pe
rme
a
b
il
it
y
(
Ba
rr
e
r)
0,1 1 10 100
CO2 CH4 O2 N2
Treatment Temperature (ºC)
100 120 140 160 180 200 220 240 260
Se
le
c
ti
v
it
y
(
d
ime
n
s
io
n
le
s
s
)
1 10 100
O2/N2 CO2/N2 CH4/N2 CO2/CH4
Figure 12. CO
2permeability measured at 30ºC as a function of the thermal treatment.
Treatment Temperature (ºC)
100
120
140
160
180
200
220
240
260
CO
2
Pe
rme
a
b
il
it
y
(
Ba
rr
e
r)
10
15
20
25
30
PEO2000+HDI
PEO900+HDI
Figure 13. CO
2permeability as a function of permeation temperature for cPI-PEO6000
membranes treated at 160ºC.
1000/T (K-1)
3.0
3.1
3.2
3.3
L
n
P
erm
eabi
li
ty
-1
0
1
2
3
4
5
CO2
CH4
O2
N2
cPI-PEO6000
PEO Mw(g/mol)
0 1000 2000 3000 4000 5000 6000 7000 Ea
(
k
J
/mo
l)
-60 -50 -40 -30 -20 -10
CO
2CH
4O
2N
2N2 O2 CH4 CO2
-E
a
(
k
J
/m
o
l)
0 20 40 60
cPI-PEO6000 cPI-PEO900+HDI cPI- PEO2000+HDI