PLEASE SCROLL DOWN FOR ARTICLE
Access details: Access Details: [subscription number 931319204]
Publisher Psychology Press
Informa Ltd Registered in England and Wales Registered Number: 1072954 Registered office: Mortimer House,
37-41 Mortimer Street, London W1T 3JH, UK
Developmental Neuropsychology
Publication details, including instructions for authors and subscription information:
http://www.informaworld.com/smpp/title~content=t775653638
Verbal and Nonverbal Fluency in Spanish-Speaking Children
Esmeralda Matute; Monica Rosselli; Alfredo Ardila; Guadalupe MoralesOnline publication date: 08 June 2010
To cite this Article Matute, Esmeralda , Rosselli, Monica , Ardila, Alfredo and Morales, Guadalupe(2004) 'Verbal and
Nonverbal Fluency in Spanish-Speaking Children', Developmental Neuropsychology, 26: 2, 647 — 660
To link to this Article: DOI: 10.1207/s15326942dn2602_7
URL: http://dx.doi.org/10.1207/s15326942dn2602_7
Full terms and conditions of use: http://www.informaworld.com/terms-and-conditions-of-access.pdf
This article may be used for research, teaching and private study purposes. Any substantial or systematic reproduction, re-distribution, re-selling, loan or sub-licensing, systematic supply or distribution in any form to anyone is expressly forbidden.
Verbal and Nonverbal Fluency
in Spanish-Speaking Children
Esmeralda Matute
Neuroscience Institute University of Guadalajara, MexicoMónica Rosselli
Department of Psychology Florida Atlantic UniversityAlfredo Ardila
Department of Science and Communication Disorders Florida International University
Guadalupe Morales
Neuroscience Institute University of Guadalajara, MexicoFluency measures are commonly used in clinical developmental neuropsychology to assess executive functions. Little is known about the effect of age on performance in these tests. This article analyzes the effect of age on measures of verbal (semantic and phonologic) and nonverbal (semantic and nonsemantic) fluency in 171 children (81 boys, 90 girls) between ages 6 and 15. Participants were selected from public and pri-vate schools in Guadalajara and Tijuana, Mexico. A significant age effect was found on all tests but no interaction between age and type of test was found. Significant cor-relations among the 4 fluency tasks ranged from .36 to .46. Results are consistent with the findings of normative studies carried out in other countries and support the cross-language validity of verbal fluency tests.
Requests for reprints should be sent to Mónica Rosselli, Department of Psychology, Florida Atlan-tic University, 2912 College Avenue, Davie, FL 33314–7714. E-mail: [email protected]
Verbal and nonverbal fluency tests have been commonly used in neuropsychology to assess executive functioning (Baldo, Shimamura, Delis, Kramer, & Kaplan, 2001). Both tasks are believed to depend on executive control because goal-di-rected tasks require an organized search (Spreen & Strauss, 1998; Temple, 1997; Welsh, Pennington, & Groisser, 1991). Although some studies have identified the developmental progression of fluency skills through childhood and adolescence, little is known about the effects of age on performance in verbal and nonverbal flu-ency tests among school children.
Performance on verbal and nonverbal fluency tasks reflects a combination of cognitive skills requiring the generation of items within a specific category (words or designs) and within a time limit. These procedural constraints compel the par-ticipant to use a self-generated strategy that allows the finding of the relevant items (Baldo et al., 2001; Bruyer & Tuyumbu, 1980; Parks et al., 1988; Perret, 1974; Ramier & Hecaen, 1970; Ruff, Allen, Farrow, Niemann, & Wylie, 1994). Within a particular category irrelevant items must be inhibited (Anderson, Anderson, Northam, Jacobs, & Catroppa, 2001; Lezak, 1995).
A moderate correlation has been found between verbal and nonverbal tests sug-gesting that these two measures tap similar although not identical functions (Regard, Strauss, & Knapp, 1982). Neuroimaging studies have also supported the similarities in brain activation in the performance of fluency tasks. Parks et al. (1988) reported significant activation of the frontal lobes when performing verbal fluency tasks and Elfgree and Risberg (1998) described similar activation with design fluency tests. Some studies using regional cerebral blood flow measures, however, have reported that not only frontal but also temporal activation is observed while performing se-mantic fluency tests. Positron emission tomography (PET) studies have demon-strated that the frontal lobe is active in phonemic generation, and the temporal lobe is more active in the semantic generation of words (Warburton et al., 1996).
The most common verbal fluency test is the Controlled Oral Word Association Test (COWAT; Lezak, 1995; Spreen & Strauss, 1998). Most commonly two condi-tions are used: (a) letter (phonemic association) fluency (the participant generates words that begin with a particular letter, or phoneme, usually F, A, and S), and (b) category (semantic association) verbal fluency (the participant produces words corresponding to a specific semantic category; e.g., animals, fruits, clothes, or veg-etables). Typically, the score is the number of correct words produced in 1 min. A normal adult can produce about 12 words beginning with a specific letter, and about 16 words corresponding to a semantic category within 1 min (Spreen & Strauss, 1998). Cross-cultural studies have found validity for verbal fluency tests in speakers of languages other than English; for example, Spanish (Ardila & Rosselli, 1994), Finnish (Klenberg, Korkman, & Lahti-Nuuttila, 2001), and He-brew (Axelrod, Tomer, Fisher, & Aharon-Peretz, 2001). The level of difficulty, however, depends on the selected letter and the semantic category that is used. A very strong educational effect has been demonstrated in both conditions for adults,
especially in the phonemic condition (Ostrosky, Ardila, & Rosselli, 1999; Rosselli, Ardila, & Rosas, 1990). Ardila, Ostrosky-Solis, Rosselli, and Gomez (2000) found that educational level accounted for 38.5% of the variance in the phonemic condi-tion and 23.6% of the variance in the semantic condicondi-tion. A moderate correlacondi-tion (around .30–.50) between scores in both conditions has been reported (Ardila, Galeano, & Rosselli, 1998; Ardila, Rosselli, & Bateman, 1994).
Design fluency is measured by an individual’s ability to generate a series of novel (i.e., no repeated) designs (Regard et al., 1982). In the free condition, the par-ticipant is asked to “invent” drawings that represent neither actual objects nor nameable abstract objects. Participants are given 5 min to make as many different kinds of drawings as possible. In the so-called fixed condition, acceptable draw-ings are limited to four lines, straight or curve (Jones-Gotman & Milner, 1977; Lezak, 1995). Another design generation test is the Five-Point test in which there is a structured background that consists of squares with five dots. The examiner asks the participant to make as many different figures as possible within 5 min by con-necting the dots with straight lines (Lezak, 1995).
Most studies using fluency tests have been done in adults and only a small num-ber of studies have looked at the performance of children on these neuro-psychological tests. Moreover, the majority of the studies using pediatric popula-tions have analyzed the effect of age on verbal fluency tests (e.g., Ardila & Rosselli, 1994; Crockett, 1974; Gaddes & Crockett, 1975; Halperin, Healey, Zeitchik, Ludman, & Weinstein, 1989; Kolb & Whishaw, 1985). Few of the studies have focused on the age differences over design fluency scores. In general, devel-opmental studies of verbal fluency tasks have shown that verbal fluency develop-ment is positively related to age. By age 6 the child can generate about 10 animal names in 1 min, by age 9 about 13, and by age 12 about 15 animal names. Letter fluency increases on average from about 3.5 at the age of 6 to about 8 at the age of 12. Cohen, Morgan, Vaughn, Riccio, and Hall (1999) reported that in normal chil-dren letter fluency scores improve significantly between 6 and 12 years of age. Welsh, Groisse, and Pennington (1988) claimed that functions assessed by phone-mic verbal fluency tests are one of the latest prefrontal measures to mature. These findings have not been consistently established by all researchers. Anderson et al. (2001), for example, failed to find a significant effect of age on verbal fluency scores in an Australian sample aged 11 to 17 years. Some studies have found that verbal fluency approaches adult levels by age 10 (e.g., Regard et al., 1982), whereas others suggest that verbal fluency continues to develop into adolescence or even into early adulthood (Klenberg et al., 2001). Thus, it is clear that verbal flu-ency tests are sensitive to neurodevelopment, although it is not yet clear at what age performance on these tests reaches adult levels (Cohen et al., 1999).
Developmental data for nonverbal fluency tests are more limited. Regard et al. (1982) analyzed the effect of age on verbal and nonverbal fluency tests in 80 right-handed children from Grades 5 to 7. They observed that fluency tests are age
but not gender dependent. The authors reported a modest correlation between the fluency tests and standard measures of intelligence such as Vocabulary and Block Design. Jones-Gotman (1990) provided normative data for 5- to 14 year-old chil-dren on nonverbal fluency tests. The author found that the mean number of accept-able drawings produced in 5 min increases from about 3.2 at the age of 6 to about 9.5 at the age of 11 to 14 years old. Other studies (e.g., Levin et al., 1991; Wood-ward, Axelrod, & Henry, 1992) have found similar results.
Recent research has explored the development of executive functioning skills in children using verbal and nonverbal fluency tests. Korkman, Kemp, and Kirk (2001) measured design fluency and verbal fluency in 800 children from the United States ages 5 to 12. The authors found an age-related increase in both measures. Age effects were more accentuated in the range of 5 to 8 years. The design fluency but not the ver-bal fluency test had a plateau at age 11. Verver-bal fluency showed a significant increase in the age range from 11 to 12, suggesting that the functions assessed by this test de-velop beyond age 11. Similar results were found by Klenberg et al. (2001) in a Finn-ish sample. These authors reported significant effects of age on three fluency mea-sures: semantic fluency, phonemic fluency, and design fluency. They concluded fluency tests are reliable measures of executive functioning in children, and that some of the abilities measured by these tests continue to develop after age 12.
The inclusion of valid and reliable measures of verbal executive skills in clinical and research protocols using school children samples is essential for the interpreta-tion of deviainterpreta-tions in clinical populainterpreta-tions (Anderson et al., 2001). Given that in the field of neuropsychology very few studies examine the normative equivalence of the verbal fluency tests with individuals who are not English dominant, a Span-ish-speaking sample study would contribute to a better understanding of linguistic effect on these tests. The purpose of this study was therefore to identify the age ef-fects on measures of verbal and nonverbal fluency skills between 6 and 15 years in a Spanish-speaking sample.
Because fluency tasks are valid and reliable measures of executive functing (Korkman et al., 2001), developmental rates on fluency tests need to be studied us-ing a normal pediatric sample. Understandus-ing the age effect on these measure-ments is important for the interpretation of the normal development and matur-ational changes of executive functions among school-age children. We have yet to determine whether the developmental progression of verbal and nonverbal fluency tasks are equivalent and uniform or whether each one of these tasks demonstrates its own developmental progression. The results from this study could be used by clinical child neuropsychologists to identify deviations from expected matur-ational patterns in populations with brain damage and those with learning disabili-ties. Finally, this study represents the first step toward the creation of norms for the neuropsychological assessment of Spanish-speaking populations, specifically Mexican children. Previous studies have used English-speaking samples. Having
Spanish-only groups will increase the validity of fluency tests and contribute to a better understanding of pediatric cross-cultural neuropsychology.
METHOD
Participants
One hundred and seventy-one children (81 boys, 90 girls) from five age groups (6–7, 8–9, 10–11, 12–13, and 14–15 years) were selected from public and private schools in middle-class neighborhoods in Guadalajara and Tijuana, Mexico. The mean educational levels of the public school children’s fathers and mothers were 10.75 years (SD= 3.83) and 10.18 years (SD= 3.60), respectively. The mean edu-cational levels of the private school children’s fathers and mothers were 14.71 years (SD= 3.09) and 15.18 years (SD= 1.97), respectively. The sample included 160 right-handed and 11 left-handed children (Table 1). All participants were screened for a history of neurological or psychiatric problems, mental retardation, and learning disabilities using a structured interview for parents included in the Evaluación Neuropsicológica Infantil (ENI; a neuropsychological battery for Spanish-speaking children; Matute, Rosselli, Ardila, & Ostrosky, unpublished). The parents were also interviewed, and those parents and children who met inclu-sion criteria signed informed consent forms. Although no formal testing was done to rule out intellectual disability or learning disabilities, we screened for grade re-tention and found no chronological age–grade level disparity. The children’s read-ing and math performance agreed with their chronological grade levels accordread-ing to school records. Each child received a small gift (e.g., a box of crayons, candy) after participation in the study.
Materials
Two verbal (semantic and phonemic) and two graphic (semantic and nonsemantic) fluency tests were administered to each child (ENI battery; Matute et al., in press). Each fluency test included the following subtests.
TABLE 1
General Characteristics of the Sample
Age 6–7a 8–9b 10–11c 12–13d 14–15e Totalf
Boys 7 17 27 19 11 81
Girls 11 13 24 21 21 90
Left-handers 0 1 3 3 4 11
Right-handers 18 29 48 37 28 160
an= 18.bn= 30.cn= 51.dn= 40.en= 32.fN= 171.
1. Verbal fluency.
1.1. Semantic fluency. Children were instructed to name all fruits they could in 1 min. The score was the total number of correct fruit names.
1.2. Phonemic fluency. Children were instructed to say as many words start-ing with M as they could in 1 min, omittstart-ing all proper nouns (names of people, places, etc.) as well as morphological variations of the same word. The score was the total number of correct words.
2. Graphic fluency.
2.1. Semantic fluency (meaningful figures). Children were instructed to draw as fast as possible (within 3 min) all the different meaningful figures they could on a page featuring 35 contiguous 1-in. squares in a 5 × 7 array. The exam-iner instructed the child to make each drawing as simple as possible. One point was given for a drawing of a shape that represented something definite. The points were added to obtain the total score.
2.2. Nonsemantic fluency (geometric designs). Children were instructed to draw, as fast as possible, linear geometric figures using five points within a square presented in a sheet of paper containing a 7 × 5 array of 35 dot matrices (adapted from Regard et al., 1982) but only 3 min were allowed as in Lee et al. (1994) and Spreen and Strauss (1998). All 35 dot matrices were identical and contained five symmetrically arranged dots; four of them were black and each one of them was located in a different corner. The fifth point was white and was located at the center of the square. All lines must connect dots and at least one has to touch the white dot. Those figures that were not formed by four lines or those in which the white dot was not connected were scored as intrusions, whereas those that the child had made previously were scored as perseverations. One point was given to each draw-ing made with four lines.
Procedures
Children were randomly selected from various classrooms and their parents were contacted and interviewed. Children with no history of school failure and no his-tory of neurological or psychiatric disorders were chosen and tested at their schools or homes in one single session. Verbal fluency tests were administered first, followed by graphic fluency tests in the following order: fruits names, M-ini-tial words, meaningful figures, and geometric designs.
Statistical Analyses
A multivariate analysis of variance (MANOVA) was performed using age (6–7, 8–9, 10–11, 12–13, and 14–15-year-old groups) and fluency task type (verbal flu-ency tests and graphic tests) as the independent variables and fluflu-ency test scores as the dependent variables. Effects and interactions of age and fluency test type were
analyzed. Afterward, the overall MANOVA (Hotelling’s T) was calculated. Univariate analyses were obtained for each of the four dependent measures. Partial eta squares were used to estimate the effect size measure for the univariateFs. Once it was determined that differences existed among the means, multiple com-parisons between age groups were done using Bonferroni post hoc corrections to determine which means differed. The level of confidence was set at .005 for all comparisons. Pearson’s correlation coefficients were obtained to determine the as-sociations between different fluency test scores.
RESULTS
Table 2 presents the means and standard deviations for all age groups on the four fluency dependent measurements. The overall multivariate Hotelling’sTtest for age was found to be statistically significant,F(4, 166) = 7.89,p< .001. Significant effects of age were seen in all subtests. The effect size measured by the partial eta squared demonstrated that 28% of the total variability of the verbal semantic flu-ency task and 27% of the total variability of the verbal phonemic fluflu-ency task can be attributed to age effect, whereas for the graphic tests the contribution of age was lower but also important in magnitude (22% for the graphic semantic test and 18% for the graphic nonsemantic test). The overall effect of the type of fluency task was statistically significant (Hotelling’s Trace value = 2.30),F(3, 166) = 126.02,p= .001. This test effect was independent from the age group effect. The interaction between age and type of test was not significant (Hotelling’s Trace value for the in-teraction = 0.62),F(12, 166) = 0.84,p= .60.
Table 3 shows the post hoc comparisons of adjacent and nonadjacent age groups in each of the fluency tests. The mean differences were significant only in
TABLE 2
Means, Standard Deviations, Univariate Analyses, and Size Effects for All Fluency Measures
Age
Verbal Semantic
Verbal Phonemic
Graphic Semantic
Graphic Nonsemantic
6–7 9.83±3.67 5.83±2.77 13.50±4.51 6.17±4.16 8–9 11.17±2.70 7.23±3.02 13.87±4.39 8.30±4.40 10–11 12.39±2.56 8.61±2.79 15.94±4.74 9.06±4.15 12–13 13.47±2.87 9.27±3.44 16.70±5.03 11.42±5.27 14–15 15.69±3.13 12.53±4.38 21.66±6.64 13.78±6.25 Total 12.78±3.66 8.96±3.85 16.57±5.75 10.06±5.39
F 15.81 15.37 11.70 9.65
p 0.001 0.001 0.001 0.001
Size effecta 0.28 0.27 0.22 0.19
aPartial eta.
654
Fluency Test
Age Group (A)
Age Group (B)
Mean Difference
(A – B)
Standard
Error p
Semantic verbal 6–7 8–9 –1.33 0.86 = 1.00 10–11 –2.56 0.79 = 0.015 12–13 –3.64 0.82 < 0.001 14–15 –5.85 0.85 < 0.001 8–9 10–11 –1.23 0.66 = 0.680 12–13 –2.31 0.70 = 0.012 14–15 –4.52 0.73 < 0.001 10–11 12–13 –1.08 0.61 = 0.789 14–15 –3.30 0.65 <0.001 12–13 14–15 –2.21 0.68 = 0.016
Phonemic 6–7 8–9 –1.40 0.99 = 1.000
10–11 –2.77 0.91 = 0.028 12–13 –3.44 0.94 = 0.004 14–15 –6.70 0.98 < 0.001 8–9 10–11 –1.37 0.76 = 0.751 12–13 –2.04 0.80 = 0.122 14–15 –5.30 0.84 < 0.001 10–11 12–13 –0.67 0.70 = 1.00
14.15 –3.92 0.75 < 0.001 12–13 14.15 –3.26 0.79 < 0.001 Semantic graphic 6–7 8–9 –0.37 1.53 = 1.00
10–11 –2.44 1.41 = 0.852 12–13 –3.20 1.45 = 0.297 14–15 –8.16 1.51 < 0.001 8–9 10–11 –2.07 1.18 = 0.814 12–13 –2.83 1.24 = 0.238 14–15 –7.79 1.30 < 0.001 10–11 12–13 –0.76 1.086 = 1.00
14–15 –5.72 1.160 < 0.001 12–13 14–15 –4.96 1.219 < 0.001 Graphic nonsemantic 6–7 8–9 –2.13 1.46 = 1.00
10–11 –2.89 1.34 = 0.335 12–13 –5.26 1.39 = 0.002 14.15 –7.61 1.45 < 0.001 8–9 10–11 –.76 1.13 = 1.00
12–13 –3.12 1.18 = 0.094 8–9 14–15 –5.48 1.25 < 0.001 10–11 12–13 –2.37 1.03 = 0.241 14–15 –4.72 1.11 < 0.001 12–13 14–15 –2.36 1.16 = 0.451
the older adjacent groups for phonemic fluency and semantic graphic fluency tasks. Sixteen out of 24 comparisons between groups that differed by more than 2 years of age (e.g., 6–7 vs. 10–11) were significant Most of the comparisons be-tween the oldest groups were significant.
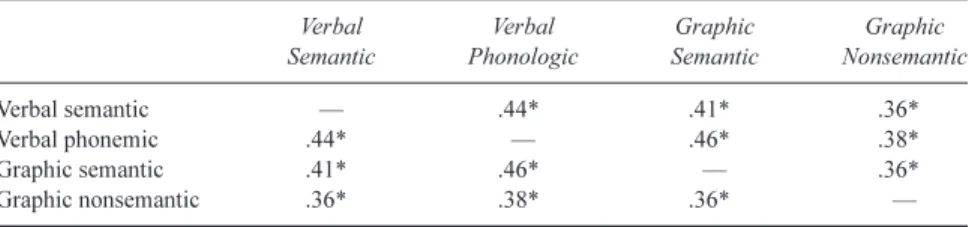
Table 4 presents the intercorrelations among the four testing conditions. All correlations were statistically significant at the .01 level. All correlations were about .35 to .45.
DISCUSSION
Our results show a significant age effect for all verbal and graphic fluency mea-sures. All fluency test scores increased between ages 6 and 15. The greatest change in all verbal and nonverbal test scores, however, occurred between ages 10 and 15. The changes in scores across the different age groups were significant for all flu-ency tasks but the rate of development of semantic and nonsemantic fluflu-ency tasks is not completely equivalent for the four tasks. In the graphic tasks, the effect of age was 22% for the semantic fluency task and 18% for the nonsemantic fluency task, whereas the effect of age for the semantic verbal fluency task was 28% and for the phonemic fluency task 27%. Dissociations in the rate of development of these executive function tests have been previously reported (Anderson et al., 2001; Korkman et al., 2001; Regard et al., 1982). The significant effect of the type of fluency task found in our results was independent from the age effect. This sug-gests differences in the degree of difficulty of the fluency tasks across ages.
In our study the children of all age groups together had higher scores in the se-mantic conditions than in the nonsese-mantic conditions (verbal fluency tests:M dif-ference = 3.81,SE= 0.29,t= 12.94,p= .001; graphic fluency tests:Mdifference = 6.29,SE= 0.48,t= 13.51,p= .001). Similar results were found by Regard et al. (1982). Moreover, the fact that our older group (14–15-year-olds) reached the level of adults with low levels of education reported by Spreen and Strauss (1998) in the semantic verbal fluency tasks but not in the verbal phonemic tasks confirms
previ-TABLE 4
Intercorrelations Among the Different Fluency Tests
Verbal Semantic
Verbal Phonologic
Graphic Semantic
Graphic Nonsemantic
Verbal semantic — .44* .41* .36*
Verbal phonemic .44* — .46* .38*
Graphic semantic .41* .46* — .36*
Graphic nonsemantic .36* .38* .36* —
*p< .01 (two-tailed).
ous findings (Korkman et al., 2001) that the latter is an executive function that con-tinues to develop beyond age 12.
The age effect found in our study is also influenced by level of education. As a matter of fact, our sample of children differed not only in age, but also in educa-tional level. Whereas the youngest group had 2 or 3 years of education, the oldest group had about 8 to 9 years of education. A significant impact of school years at-tended and literacy in neuropsychological test performance in different cognitive domains has been documented (e.g., Ardila, Rosselli, & Rosas, 1989; Rosselli et al., 1990), so differences between the age groups in this study may be both age and education related. Due to the fact that participants in the youngest group were in first or second grade, participants in the second age range were in third or fourth grade, and so on, it is impossible in this sample to separate the contribution of age and education differences on fluency test performance. As age and educational level in childhood are often associated variables, the assessment of neurologically intact unschooled participants would be needed to separate their effect.
Our results are congruent with other verbal fluency normative studies con-ducted in Spanish (e.g., Ardila & Rosselli, 1994) and English (Crockett, 1974; Gaddes & Crockett, 1975; Halperin et al., 1989; Kolb & Whishaw, 1985). An average 6-year-old child can generate about 10 words within a semantic category in 1 min, as opposed to about 15 words in 12-year-old children. Phonemic flu-ency increases in average from about 3.5 words at the age of 6 to about 8 words at the age of 12. Our results in the graphic fluency tests, however, are not easy to compare with available normative data. Our semantic graphic fluency condition is not frequently mentioned in the literature. Our nonsemantic fluency measure (five-point test) is frequently mentioned and norms are available for different age groups (e.g., Jones-Gotman, 1990; Levin et al., 1996; Regard et al., 1982; Wood-ward et al., 1992), but our test used 3 min instead of 1 min as in Korkman et al. (2001) or 5 min as in Regard et al. (1982), and therefore results are difficult to compare.
The similarities observed in the verbal fluency tests across different normative studies, carried out in different countries (e.g., United States, Canada, Mexico, Co-lombia) and using different languages (English, Spanish) support the cross-cul-tural validity of verbal fluency tests. If appropriate semantic categories are selected and significant variables are controlled (e.g., age and education) similar perfor-mance can be anticipated in individuals from different cultures (Acevedo et al., 2000; Ardila, 2002). By the same token, phonemic fluency tests can be assumed to be a valid instrument across cultures if significant variables (e.g., the writing sys-tem, the frequency of words beginning with a particular phoneme, the participant’s level of education, etc.) are controlled. Axelrod et al. (2001) presented evidence for the utility of Hebrew-language versions of phonemic fluency measures in young adults using the lettersshin, yud,andmem.When comparing performance in
ferent languages the issue of frequency of words beginning with a specific pho-neme and the orthographic idiosyncrasies of each language may impact perfor-mance.
The generalization of the results of this study is limited by two shortcomings. First the fluency measures used in this study are unpublished and therefore have not been previously validated. However, similar verbal and nonverbal fluency measurements have been used by other authors who have demonstrated the reli-ability and validity of these measures (Korkman, Kemp, & Kirk, 1998, 2001; Lezak, 1995; Spreen & Strauss, 1998). Moreover there is evidence of the cross-language validity of verbal fluency tests (Ardila & Rosselli, 1994; Axelrod et al., 2001; Klenberg et al., 2001). A second limitation of this study is that a cross-sectional design was used to address a developmental (i.e., longitudinal) question. There might be a confound between age and other unmeasured vari-ables. Although longitudinal studies probably offer the most valuable designs in studies of developmental change for specific aspects of behavior, cross-sectional studies may offer an opportunity to study cognitive domains of development (Anderson et al., 2001; Korkman, 2001; Rosselli, Ardila, Bateman, & Guzman, 2001). Moreover, comparisons between studies with cross-sectional designs and studies with longitudinal designs will provide a better understanding of the ef-fect that different variables could have on these measures.
Comparative developmental studies can provide a better understanding not only about basic characteristics of cognitive development, but also about the effect of cultural and linguistic variables. Looking into the future, more research is needed to obtain a better understanding of commonality and differences in neuropsycho-logical test performance and developmental characteristics.
ACKNOWLEDGMENTS
Our sincere gratitude goes to Kevin Keating and Fernando Leal for their valuable suggestions and editorial support; to Teresita Montiel, Olga Inozemtseva, Noemí Pinto, Ana Paula Medrano, and Rebeca Ackerman for their help in the data collec-tion; and to Daniel Zaraboso and Teresita Montiel for their help with the statistical analysis.
REFERENCES
Acevedo, A., Loewenstein, D. A., Barker, W. W., Harwood, D. G., Luis, C., Bravo, M., et al. (2000). Category fluency test: Normative data for English and Spanish speaking elderly.Journal of the Inter-national Neuropsychological Society, 6,760–769.
Anderson, V. A., Anderson, P., Northam, E., Jacobs, R., & Catroppa, C. (2001). Development of execu-tive functions through late childhood and adolescence in an Australian sample.Developmental Neuropsychology, 20,385–406.
Ardila, A. (2003). Culture in our brains: Cross-cultural differences in the brain–behavior relationships. In A. Toomela (Ed.),Cultural guidance in the development of the human mind: Advances in child de-velopment within culturally structured environments(Vol. 7, pp. 63–86). Westport, CT: Greenwood. Ardila, A., Galeano, L. M., & Rosselli, M. (1998). Toward a model of neuropsychological activity.
Neuropsychology Review, 8,171–190.
Ardila, A., Ostrosky-Solis, F., Rosselli, M., & Gomez, C. (2000). Age related cognitive decline during normal aging: The complex effect of education.Archives of Clinical Neuropsychology, 15,495–514. Ardila, A., & Rosselli, M. (1994). Development of language, memory and visuospatial abilities in 5- to
12-year-old children using a neuropsychological battery. Developmental Neuropsychology, 10,
97–120.
Ardila, A., Rosselli, M., & Bateman, J. R. (1994). Factorial structure of cognitive activity.Behavioral Neurology, 7,49–58.
Ardila, A., Rosselli, M., & Rosas, P. (1989). Neuropsychological assessment in illiterates: I. Visuo-spatial and memory abilities.Brain and Cognition, 11,147–166.
Axelrod, B., Tomer, R., Fisher, T., & Aharon-Peretz, J. (2001). Preliminary analysis of the Hebrew Ver-bal Fluency measures.Applied Neuropsychology, 8,248–251.
Baldo, J. V., Shimamura, A. P., Delis, D. C., Kramer, J., & Kaplan, E. (2001). Verbal and design fluency in patients with frontal lobe lesions.Journal of the International Neuropsychological Society, 7,
586–596.
Bruyer, R., & Tuyumbu, B. (1980). Fluence verbale et lesions du cortex cerebrale: Performances et types d’erreurs [Verbal fluency and lesions of the cerebral cortex: Performance and type of errors].
Encephale, 6,287–197.
Cohen, M. J., Morgan, A. M., Vaughn, M., Riccio, C. A., & Hall, J. (1999). Verbal fluency in children: Developmental issues and differential validity in distinguishing children with attention-deficit hy-peractivity disorder and two subtypes of dyslexia. Archives of Clinical Neuropsychology, 14,
433–443.
Crockett, D. J. (1974). Component analysis of within correlations of language-skill tests in normal chil-dren.Journal of Special Education, 8,361–375.
Elfgren, C., & Risberg, J. (1998). Lateralized blood flow increases during fluency tasks: Influence of cognitive strategy.Neuropsychologia, 36,505–512.
Gaddes, W. H., & Crockett, D. J. (1975). The Spreen–Benton aphasia tests, normative data as a measure of normal language development.Brain and Language, 2,257–280.
Halperin, J. M., Healey, J. M., Zeitchik, E., Ludman, W. L., & Weinstein, L. (1989). Developmental as-pects of linguistic and mnesic abilities in normal children.Journal of Clinical and Experimental Neuropsychology, 11,518–528.
Jones-Gotman, M. (1990). Presurgical psychological assessment in children: Special tests.Journal of Epilepsy, 3,93–102.
Jones-Gotman, M., & Milner, B. (1977). Design fluency: The invention of nonsense drawings after fo-cal cortifo-cal lesions.Neuropsychologia, 15,653–674.
Klenberg, L., Korkman, M., & Lahti-Nuuttila, P. (2001). Differential development of attention and ex-ecutive functions in 3- to 12-year-old Finnish children. Developmental Neuropsychology, 20,
407–428.
Kolb, B., & Whishaw, I. Q. (1985).Fundamentals of human neuropsychology(2nd ed.). New York: Freeman.
Korkman, M. (2001). Introduction to the special issue on normal neuropsychology development in the school age years.Developmental Neuropsychology, 20,325–330.
Korkman, M., Kemp, S. L., & Kirk, U. (1998).NEPSY: A developmental neuropsychological assess-ment.San Antonio, TX: Psychological Corporation.
Korkman, M., Kemp, S. L., & Kirk, U. (2001). Effects of age on neurocognitive measures of children ages 5 to 12: A cross-sectional study of 800 children from the United States.Developmental Neuropsychology, 20,331–354.
Lee, G. P., Loring, D. W., Newell, J., & McCloskey, L. (1994). Figural fluency on the Five Point Test: Preliminary normative and validity data.International Neuropsychological Society Program and Abstracts, 1,51.
Levin, H. S., Culhane, K. A., Hartmann, J., Haword, H., Ringholtz, G., Ewing-Cobbs, L., et al. (1991). Developmental changes in performance on tests of purported frontal lobe functioning. Developmen-tal Neuropsychology, 7,377–395.
Lezak, M. D. (1995).Neuropsychological assessment(3rd ed.). New York: Oxford University Press.
Matute, E., Rosselli, M., Ardila, A., & Ostrosky, F. (in press).Evaluacion Neuropsicologica Infantil (ENI).Guadalajara, Mexico: Universidad de Guadalajara.
Ostrosky, F., Ardila, A., & Rosselli, M. (1999). “Neuropsi”: A brief neuropsychological test battery in Spanish with norms by age and educational level.Journal of the International Neuropsychological Society, 5,413–433.
Parks, R. W., Loewenstein D. A., Dodrill, K. L., Barker, W. M., Yoshii, F., Chang, J. Y., et al. (1988). Cerebral metabolic effects of verbal fluency tests: A PET scan study.Journal of Clinical and Experi-mental Neuropsychology, 10,565–575.
Perret, E. (1974). The left frontal lobe of man and the suppression of habitual responses in verbal cate-gorical behavior.Neuropsychologia, 12,323–330.
Ramier, A. M., & Hecaen, H. (1970). Role respectif des attaintes frontales et la lateralisation lesionelle dans le deficits de la “fluence verbale” [The specific role of frontal lesions and the lateralization of the lesion in verbal fluency].Revue Neurologique, 123,17–22.
Regard, M., Strauss, E., & Knapp, P. (1982). Children’s production on verbal and non-verbal fluency tasks.Perceptual and Motor Skills, 55,839–844.
Rosselli, M., Ardila, A., Bateman, J. R., & Guzman, M. (2001). Neuropsychological test scores, aca-demic performance and developmental disorders in Spanish-speaking children.Developmental Neuropsychology, 20,355–374.
Rosselli, M., Ardila, A., & Rosas, P. (1990). Neuropsychological assessment in illiterates: II. Language and praxic abilities.Brain and Cognition, 12,281–296.
Ruff, R. M., Allen, C. C., Farrow, C. E., Niemann, H., & Wylie, T. (1994). Figural fluency: Differential impairment in patients with left versus right frontal lobe lesions.Archives of Clinical Neuro-psychology, 9,41–55.
Schonfeld, A. M., Mattson, S. N., Lang, A. R., Delis, D. C., & Riley, E. P. (2001). Verbal and nonverbal fluency in children with heavy prenatal alcohol exposure.Journal of Studies on Alcohol, 62,
239–246.
Schwartz, S., & Baldo, J. (2001). Distinct patterns of word retrieval in right and left frontal lobe pa-tients: A multidimensional perspective.Neuropsychologia, 39,1209–1217.
Spreen, O., Risser, A. H., & Edgell, D. (1995).Developmental neuropsychology.New York: Oxford University Press.
Spreen, O., & Strauss, E. (1998).A compendium of neuropsychological tests(2nd ed.). New York: Ox-ford University Press.
Temple, C. (1997).Developmental cognitive neuropsychology.East Sussex, England: Taylor & Fran-cis.
Warburton, E., Wise, R. J. S., Price, C. J., Weiller, C., Harad, U., Ramsay, S., et al. (1996). Noun and verb retrieval in normal subjects studies with PET.Brain, 119,159–179.
Welsh, M. C., Groisser, D., & Pennington, B. F. (1988). A normative development study of measures hypothesized to tap prefrontal functioning.Journal of Clinical and Experimental Neuropsycho-logy, 10,79.
Welsh, M. C., Pennington, B. F., & Groisser, D. (1991). A normative-developmental study of executive function: A window on prefrontal function in children. Developmental Neuropsychology, 7,
131–149.
Woodward, J. L., Axelrod, B. N., & Henry, R. R. (1992). Interrater reliability of scoring parameters for the Design Fluency Test.Neuropsychology, 6,173–178.