Contrast-induced acute kidney injury in cirrhotic patients.
A retrospective analysis
Wajima Safi,* Isabel Rauscher,** Andreas Umgelter*
* II. Medizinische Klinik, ** Nuklearmedizinische Klinik. Klinikum rechts der Isar der Technischen Universität München, Germany.
ABSTRACT
Background. The nephrotoxic potential of intravenous iodinated contrast (IC) is controversial. Cirrhotic patients are often submitted to imaging procedures involving IC and small changes in renal function may have detrimental effects. Material and methods. Retrospective analysis of hospitalized patients with elec-tive imaging by either contrast-enhanced CT or MRI. Contrast induced acute kidney injury (CI-AKI) was diagnosed if there was either an increase of SCr by 25% or by 44 μmol/L or a decrease of estimated glo-merular filtration rate by 25% by day 3. Results. Between 2004 and 2012 152 patients (female: 30.3%, age: 60 ± 10.8 years, MELD 13 ± 6) were included in this study of which 84 (55.3%) had received IC and 68 (44,7%), who served as controls, MRI with gadolinium based contrast (non-IC). Baseline paremeters were well matched except for age (61.7 vs. 56.9) years in the IC vs. non-IC groups, p = 0.005). 15 patients (17.9%) receiving IC and 4 patients (5.9%) not receiving IC (p = 0.026) reached the composite end-point for CI-AKI. In multivariable regression analysis INR [B = 0.252 (95% CI: 0.108-0.397), p = 0.001]; IC [B = 0.136 (95% CI: 0.023-0.248), p = 0.019] and serum sodium [B = 0.011 (95% CI: 0.001-0.023); p = 0.080] were independently associated with changes of SCr. In conclusion IC may cause renal dysfunction in cirrhotic patients. Patients subjected to imaging using IC should be closely monitored.
Key words. Contrast-induced acute kidney injury (CI-AKI). Cirrhosis. Acute kidney injury (AKI). Renal failure. Computed tomography.
Correspondence and reprint request: P.D. Dr. med Andreas Umgelter II. Medizinische Klinik. Klinikum rechts der Isar.
Ismaninger Str. 22. 81675 München. Germany. Tel: +49 89 41405460. Fax: +49 89 41404884 E-mail: [email protected]
Manuscript received: February 05, 2015. Manuscript accepted: March 04, 2015. BACKGROUND
Renal dysfunction is common in cirrhotic pa-tients, occurring in approximately 20% of all hospi-talized patients with cirrhosis and it is associated with significant morbidity and mortality.1,2 At the
same time, cirrhotic patients are likely to be subject-ed to imaging procsubject-edures and expossubject-ed to iodinatsubject-ed contrast material (IC). IC has long been recognized as a potential risk factor for acute kidney injury (AKI), which, in this setting, is termed contrast-in-duced acute kidney injury (CI-AKI).
Portal hypertension via mechanisms involving ni-tric oxide causes splanchnic vasodilation resulting
in reduced peripheral vascular resistance, reduced mean arterial pressure and arterial underfilling. In an effort to compensate for the reduced perfusion pressure, endogenous vasoconstrictor mechanisms are activated that result in increased renal tubular reabsorption of sodium and renal vasoconstriction. With advancing hemodynamic disturbance and neu-ro-humoral activation renal vasoconstriction in-creases until finally glomerular filtration dein-creases and overt renal failure develops.3 Renal failure in
cirrhotic patients may occur spontaneously or may be triggered by a variety of hemodynamic stress fac-tors such as hemorrhage, infection, overdiuresis or by drug toxicity.4,5
IC toxicity is thought to occur mainly at the out-er renal medulla.6-8 This is a region with limited
blood supply and intense tubular transport activity in the medullary thick ascending limb of the loop of Henle. The passage of IC further increases metabol-ic activity of the outer renal medulla and draws upon renal auto-regulatory mechanisms to increase blood-flow. We hypothesize that in cirrhotic patients the additional circulatory demand could overwhelm
renal hemodynamic auto-regulation and trigger kid-ney dysfunction. Several recent studies have ques-tioned the role of intravenous IC as a cause of renal dysfunction.9 One previous study in 31 cirrhotic
pa-tients exposed to IC in a tightly monitored sur-rounding did not show any untoward effect of IC on glomerular filtration rate but an increase of renal plasma flow at 48 hours after IC exposure.10 Other
authors suggest that IC is a trigger of AKI in cirrhotic patients.11 Therefore, the aim of our study
was to analyze retrospectively whether there is an association between IC and renal dysfunction in cirrhotic patients undergoing contrast-enhanced computed tomography or magnetic resonance imag-ing to investigate if IC was associated with renal dysfunction.
MATERIAL AND METHODS
All CT- and MRI studies performed in our institu-tion from January 2004 until December 2012 in cir-rhotic patients were included in this study if clinical and laboratory follow-up-data with parameters of re-nal function were available in the hospitals patient data management system on the day of the proce-dure before contrast exposure and for the 7 days fol-lowing. If the patient received multiple imaging procedures only the first examination recorded was used. In all IC-enhanced CT scans iomeprol (Imeron 400®) was used as contrast agent, in MRI gadolin-ium (Gadovist®). Demographic and clinical parame-ters were extracted from the electronic medical records. As renal impairment is common in cirrhotic patients and often multifactorial, we aimed at elimi-nating confounders by limiting our analysis to non-emergent examinations in stable patients. Patients with current infection or hemorrhage were exclud-ed, as were patients treated in the ICU and those who underwent subsequent imaging with jodinated contrast during the following 30 days. Various clini-cal parameters were defined as follows: Patients were classified as diabetic if they received medical treatment for this condition, as ascitic if imaging in-dicated more than negligible ascites, history of alco-hol consumption was registered as indicated by the patients and HCC was diagnosed if imaging results were typical (arterial hypervascularity in the arteri-al phase and washout in the portarteri-al phase).
For a sensitive detection of renal impairment af-ter contrast exposition, we chose a combined
end-point established previously.12 As summarized by
the KDIGO guidelines on contrast-induced acute kidney injury13 the end-point was fulfilled if there
was either an increase in creatinine by 44 μmol/l or by 25% of baseline serum creatinine (SCr) or a drop in estimated glomerular filtration rate (eGFR) (as assessed by the MDRD4 equation) by 25% of base-line14 within 72 h of contrast exposure. As
second-ary end-points, maximum SCr values between 72 and 168 h and at day 30 were evaluated.
Statistical analysis
Group comparisons were performed between pa-tients receiving IC and those who did not and be-tween patients who reached the combined end-point and those who did not. Categorical baseline parame-ters were presented as frequencies and percentages and compared using the chi-square-test. Continuous variables were visually assessed for normal-distribu-tion using histograms. That condinormal-distribu-tion being ful-filled, t test was used to compare means and data is presented as mean ± standard deviation. Parame-ters that did not follow a normal distribution were compared using the Mann-Whitney U test for unre-lated samples and the Wilcoxon sign rank test for paired samples, respectively. This data is presented as median (25-75th percentiles).
The association of clinical and laboratory param-eters with changes of serum-creatinine between baseline and 72 h was investigated with univariate analysis of variance. Parameters unevenly distribut-ed in the group comparisons or displaying a possible association in univariate analysis with a p < 0.100 were inserted into a multivariable regression analysis with backward exclusion (limit p < 0.100 and change of serum-creatinine as the dependent variable.
All reported P values are two-sided and have not been adjusted for multiple testing. All analyses were performed with the use of SPSS software, version 22 for Mac.
RESULTS
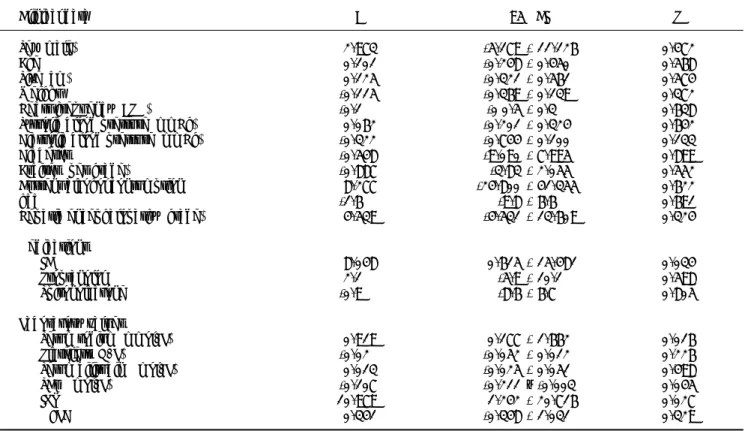
Table 1. Baseline parameters of patients with and without iodinated contrast.
Clinical data IC (n = 84) No IC (n = 68) p
Sex (male), n (%) 57(67.9) 49(72.1) 0.575
Age (years) 61.7 ± 11.2 56.9 ± 9.6 0.005
Size (cm) 172.4 ± 9.0 173.1 ± 9.3 0.700
Weight (kg) 71.4 ± 14.9 74.3 ± 16.2 0.282
Heart frequency (BPM) 78.1 ± 14.8 76.5 ± 13.0 0.571
Systolic blood pressure (mmHg) 114.6 ± 17.1 117.7 ± 22.1 0.446
Diastolic blood pressure (mmHg) 65.4 ± 11.1 68.4 ± 12.3 0.223
Diabetes, n (%) 20(24.1) 17(25.4) 0.857
Ascites, n (%) 51(63.8) 37(56.1) 0.343
Current alcohol consumption, n (%) 18(21.4) 14(20.6) 0.589
HCC, n (%) 24(28.9) 21(30.9) 0.793
Hepatic encephalopathy, n (%) 20(25.4) 9(13.2) 0.122
Medication
Propranolol, n (%) 25(31.3) 29(43.3) 0.132
Laboratory values
Spironolactone, n (%) 39(48.1) 41(60.3) 0.139
Serum sodium (mmol/L) 135.8 ± 5.2 135.6 ± 4.8 0.807
Platelets (G/L) 110(76-189) 113(69-150) 0.675
Serum bilirubin (μmol/L) 31.6(17.5-65.0) 28.2(17.5-50.9) 0.461
Scr (μmol/L) 79.6(61.9-106.1) 79.6(64.1-106.1) 0.321
INR 1.34 ± 0.32 1.45 ± 1.43 0.228
MELD 13.8 ± 5.1 13.7 ± 6.1 0.910
SCr: serum creatinine. HCC: hepatocellular carcinoma. INR: international normalized ratio. MELD: Model of End-Stage Liver Disease. Values presented as mean ± SD or median (25-75thpercentiles).
Table 2. Differences at baseline between patients developing CI-AKI and those who did not.
Clinical data CI-AKI (n = 19) No CI-AKI (n = 133) p
Sex (male), n (%) 12(63.2) 94(70.7) 0.505
Age (years) 58.2 ± 10.5 59.7 ± 10.8 0.550
Size (cm) 171.4 ± 5.2 173.9 ± 9.5 0.553
Weight (kg) 67.1 ± 10.4 73.8 ± 16.0 0.126
Heart frequency (BPM) 83.0 ± 18.2 76.8 ± 14.0 0.212
Systolic blood pressure (mmHg) 111.1 ± 18.2 116.6 ± 14.0 0.428
Diastolic blood pressure (mmHg) 59.4 ± 10.7 67.6 ± 12.0 0.053
Diabetes, n (%) 4(21.1) 33(25.2) 0.696
Ascites, n (%) 14(80.4) 74(57.4) 0.135
Current alcohol consumption, n (%) 5(26.3) 27(20.3) 0.256
HCC, n (%) 3(16.7) 42(31.6) 0.194
Hepatic encephalopathy, n (%) 5(29.4) 24(19.5) 0.702
Medications
Propranolol, n (%) 7(36.8) 47(36.7) 0.992
Spironolactone, n (%) 9(47.4) 71(54.6) 0.554
Laboratory values
Serum sodium (mmol/L) 135.2 ± 4.7 135.8 ± 5.1 0.659
Platelets (G/L) 77(62-145) 116(76-169) 0.110
Serum bilirubin (μmol/L) 65(26-99) 27(17-48) 0.006
SCr (μmol/L) 71(62-88) 80(62-106) 0.174
INR 1.54 ± 0.58 1.36 ± 0.35 0.063
MELD 16.3 ± 6.3 13.3 ± 5.4 0.032
between patients receiving these preventive meas-ures, and those who did not (3/20 or 15% vs. 12/64 or 18%, respectively, p = 0.702).
Baseline parameters of both groups (those receiv-ing IC or not) are presented in table 1.
The composite end-point for CI-AKI was reached by 15 patients (17.9%) receiving IC and 4 patients (5.9%) not receiving IC (p = .026). The mean increase in SCr in patients reaching the combined endpoint after exposure to IC was 36 ± 20 μmol.
Median (25-75th percentiles) SCr values on day 3 were 80 (62-106) μmol/L for patients receiving IC
and 80 (70-97) μmol for patients receiving no
IC (p = 0.810). On day 7 (n = 122) respective values
were 88 (62-106) μmol/L and 80 (62-97) μmol/L
(p = 0.595) and on day 30 (n = 92) 75 (62-108)
μmol/L and 84 (71-106) μmol/L (p = 0.586).
Of all patients reaching the composite end-point, 5 patients in the IC group and 1 patient in the group
without IC had peak SCr-levels of 133 μmol/L or
higher (p = 0.158).
30-day-mortality was 10/116 (7.9%) in patients not fulfilling the criteria for CI-AKI and 3/18 (16.7%) in those fulfilling the criteria (p = 0.227). In patients reaching a peak SCr level of 133 μmol/L
or higher, 30-day-mortality was 3/6 (50%) compared to 10/138 (7.2%) in the other patients (p = 0.0003).
Differences at baseline between patients reaching the composite end-point and patients who did not are presented in table 2.
Results of univariate linear regression with changes of SCr between day 1 and day 3 as depend-ent variable are presdepend-ented in table 3.
In multivariable linear regression with change in serum creatinin as dependent variable, and iodinat-ed contrast, diastolic blood pressure, serum sodium, baseline creatinine and INR as independent varia-bles, the stepwise backward variable exclusion revealed that INR [unstandardized regression coefficient (B) = 0.252 (95% CI: 0.108-0.397); p = 0.001]; IC [B = 0.136 (95% CI: 0.023-0.248), p = 0.019] and serum sodium [B = 0.011 (95% CI: 0.001-0.023); p = 0.080] were independently associated with changes of SCr between baseline and day 3.
DISCUSSION
The nephrotoxic potential of IC used to be widely accepted in the medical literature and conse-quently acute kidney injury after intravascular
Table 3. Univariate regression analysis with changes of SCr as dependent variable.
Clinical data B 95% CI P
Sex (male) 2.973 -5.179 - 11.126 0.472
Age 0.101 -0.248 - 0.450 0.568
Size (cm) 0.125 -0.321 - 0.561 0.574
Weight -0.115 -0.369 - 0.139 0.372
Heart frequency (BPM) -0.1 -0 0.5 - 0.3 0.638
Systolic blood pressure (mmHg) 0.062 -0.201 - 0.324 0.642
Diastolic blood pressure (mmHg) -0.322 -0.744 - 0.100 0.133
Diabetes -0.548 -9.090 - 7.995 0.899
Ascites (per grade) -0.887 -3.83 - 2.055 0.552
Current alcohol consumption 8.277 -24.800 - 41.355 0.622
hcc -1.6 -9.8 - 6.6 0.691
Hepatic encephalopathy (grade) 4.539 -4.531 - 13.609 0.324
Medications
IC 8.048 0.615 - 15.481 0.034
Propranolol 2.1 -5.9 - 10.1 0.598
Spironolactone -0.9 -8.6 - 6.7 0.805
Laboratory values
Serum sodium (mmol/L) 0.919 0.177 - 1.662 0.016
Platelets (G/L) -0.02 -0.052 - 0.012 0.226
Serum bilirubin (μmol/L) 0.013 -0.025 - 0.051 0.498
SCr (μmol/L) -0.107 -0.211 – -0.003 0.045
INR 10.979 1.242 - 20.716 0.027
MELD 0.341 -0.348 - 1.031 0.329
iodinated contrast material exposure has often been regarded as contrast-material induced nephropa-thy.15 Early studies on the subject however
evaluat-ed high-osmolar contrast mevaluat-edia that are no longer used or arterial interventions that may lead to renal dysfunction through other mechanisms. Furthermore many clinical studies lack control groups. Therefore the association of IC with AKI may have been spuri-ous and the clinical relevance has been questioned.9,16
More recent analyses failed to prove an association be-tween intravenous IC and renal impairment. Paradoxi-cally two large monocentric trials found an even higher incidence of AKI in patients undergoing unen-hanced CT compared to those receiving IC.17,18 After
propensity score matching, both studies found no in-creased risk of AKI for patients receiving IC. In sub-group analysis of patients with impaired renal baseline function, one of the studies found a higher risk for AKI after IC,17 whereas the other did not.18
In our present study cirrhotic patients receiving IC were more likely to reach a sensitive combined end-point for kidney dysfunction than patients who underwent imaging without IC, namely MRI with gadolinium-based contrast agents. As the binary combined end-point could not be approached by binary logistic regression due to the small number of events, linear regression analysis with changes of SCr between baseline and day 3 as dependent variable was performed. IC was independently associated with increases of serum creatinine in multivariable analysis. The incidence of renal impairment after IC in our study was higher than that reported in a recent meta-analysis on CI-AKI.15 As our study was
a retrospective analysis, selection bias may have contributed to the difference in outcome. However groups were well matched for all analyzed baseline-parameters except for age. In univariate as well as multivariate analysis age was not associated with changes in SCr.
Several risk factors for post-CT AKI in non-cir-rhotic patients have been previously determined.17
Of all tested parameters only IC and INR emerged as independently associated with changes of SCr in the present study. Furthermore, serum sodium showed a trend towards an independent association with the end-point. Interestingly, other parameters associat-ed with cirrhotic circulatory dysfunction (such as diastolic blood pressure, heart frequency and as-cites) were eliminated from the analysis.
Some possible risk factors for AKI in cirrhotic pa-tients, such as sepsis, infection or hemorrhage, have been excluded as possible confounders in our study. There were also no type 1 diabetics.
Acute kidney injury in cirrhosis may be due to a
variety of mechanisms1 and it often is caused by
multiple factors.19 Without further data, such as
urinalysis, urinary biomarkers of tubular injury or data on tubular sodium excretion, we cannot specu-late on the exact causes of renal impairment in our study. The circulatory disturbance of cirrhosis, as well as inflammatory stimulation due to by bacterial translocation, may pre-dispose cirrhotic patients to develop kidney injury. In this situation IC may merely act as a final trigger for AKI. As in our study we present a highly selected cohort of patients who are hemodynamically stable and devoid of apparent infection, the actual risk of CI-AKI may be higher in real-life patients with acute decompensation of cirrhosis.
Cirrhotic patients have a reduced muscle mass and reduced levels of SCr. SCr levels thus overesti-mate renal function in cirrhotic patients. Cystatin C has been proposed as a more reliable parameter of GFR.20,21 However, current consensus definitions for
AKI as well as hepatorenal syndrome and of CI-AKI rely on absolute values or relative changes of SCr and the fact that absolute values of SCr did not ex-actly reflect GFR is of minor importance to our in-vestigation.
There are debates concerning the amount of changes in SCr required for a diagnosis of CI-AKI and the timing of measurement. The acute kidney injury network (AKIN) proposed an absolute in-crease of SCr of 26.4 μmol/L or a relative increase of 50% of SCr as threshold for the diagnosis of CI-AKI, or a reduction in urine output (documented oliguria of < 0.5 mL/kg/h for > 6 h) within 48 h.22 We could
not obtain reliable data on urine output for our pa-tients, thus we had to restrict our analysis to changes in SCr. An earlier consensus statement on CI-AKI proposed a 25% relative increase of serum creatinine as a threshold for a diagnosis of CI-AKI.23
As this definition is still widely used and has been the basis of many published trials, it was also used in our study, even if the clinical relevance of such subtle changes of serum creatinine may be ques-tioned. To reduce false-positive diagnoses of CI-AKI, we chose a higher threshold for absolute increases of SCr of 44 μmol/L, as it has been calculated that
increases of 26.4 μmol/L may only be relevant of
they occur within 24 h after IC.24 In the majority
of cases of CI-AKI, however, SCr peaks 3-5 days after the procedure.25
examined the prognostic relevance of AKIN-criteria in cirrhotic patients with various causes of kidney dysfunction. In these studies a significant reduction of survival at 90 days became evident only if kidney dysfunction resulted in peak SCr levels of 133 μmol/L and higher.26,27 In the longer term, however, even
AKI with peak SCr < 133 μmol/L heralds progres-sive deterioration of renal function.11
Our results are not in the line of recent large ret-rospective analyses comparing patients undergoing contrast enhanced CT to patients undergoing non-enhanced CT.17,18 In published studies patients
re-ceiving IC are often compared to patients with unenhanced CT examinations. Unenhanced CT is an inferior imaging modality for most indications. As such it is often deliberately chosen as second best for patients thought to be at high risk of renal fail-ure if exposed to IC. This may be a cause for selec-tion bias due to undocumented confounders in those studies. The fact that the groups receiving no IC in these studies paradoxically had a higher incidence of renal dysfunction, a difference that was abol-ished after propensity score matching, gives more weight to this assumption. In our study, therefore, we chose patients with MRI examination as controls. Our cohort of patients was also relatively homoge-neous which may have reduced background noise and may have facilitated the detection of small changes in renal function. Gadolinium may be even more nephrotoxic than IC in equivalent x-ray attenuating doses. However, several reports have shown that low doses such as those used for MRI are safe even in patients with renal impairment.12
Overall we believe that patients receiving MRI may be a more appropriate control group to detect the nephrotoxic potential of IC than patients receiving unenhanced CT.
The only single randomized trial of IC exposure in cirrhotic patients published so far also did not de-tect a decrease of average GFR. This was interpreted as evidence against an untoward effect of IC on kid-ney function in cirrhotic patients.10 However,
aver-age GFR was little affected in our study as well, whereas the incidence of CI-AKI was significantly higher in patients receiving IC. An explanation for this may be that the effects of IC may depend on co-factors such as the circulatory and renal predisposi-tion of the patients. The incidence of CI-AKI is too low to be explained just by a linear dose-dependent effect. Thus, if analyzed by means of average, the de-terioration of GFR in some patients may be offset by improvements in GFR in others. This does not prove that CI-AKI does not occur.
In summary, we find a higher incidence of renal dysfunction in cirrhotic patients receiving IC com-pared to patients undergoing gadolinium-enhanced MRI examinations. A third of these episodes result-ed in peak SCr levels above 133 μmol/L. In multivar-iable regression analysis, IC remained associated with increases of SCr. Overall, we could not deter-mine a significant effect of CI-AKI on mortality. In patients with peak SCr levels above 133μmol/L mor-tality was significantly higher than in all other pa-tients. We conclude that cirrhotic patients exposed to IC should be closely monitored for AKI and that other triggers for AKI should be avoided around the imaging procedure. Prospective trials should cor-roborate this data and investigate risk factors for CI-AKI in cirrhotic patients.
ABBREVIATIONS
• AKI: acute kidney injury.
• CI-AKI: contrast induced nephropathy.
• eGFR: estimated glomerular filtration rate.
• HCC: hepatocellular carcinoma.
• IC: iodinated contrast.
• INR: international normalized ratio.
• MDRD: modification of diet in renal disease.
• MELD: Model of End-Stage Liver Disease.
• SCr: serum-creatinine.
COMPETING INTERESTS
The authors declare no competing interest. No external funding was received for this study. All work was done with departmental funding as part of the authors’ regular employment at a university hospital.
REFERENCES
1. Garcia-Tsao G, Parikh CR, Viola A. Acute kidney injury in cirrhosis. Hepatology 2008; 48: 2064-77.
2. Ginès P, Schrier RW. Renal failure in cirrhosis. N Engl J Med 2009; 361: 1279-90.
3. Arroyo V, Gines P, Gerbes AL, Dudley FJ, Gentilini P, Laffi G, Reynolds TB, et al. Definition and diagnostic criteria of refractory ascites and hepatorenal syndrome in cirrhosis. International Ascites Club. Hepatology 1996; 23: 164-76. 4. Gines P, Guevara M, Arroyo V, Rodes J. Hepatorenal
syn-drome. Lancet 2003; 362: 1819-27.
5. Martín-Llahí M, Guevara M, Torre A, Fagundes C. Prognos-tic Importance of the Cause of Renal Failure in Patients with Cirrhosis. Gastroenterology 2011; 140: 488-96. 6. Brezis M, Rosen S. Hypoxia of the renal medulla—its
impli-cations for disease. N Engl J Med 1995; 332: 647-55. 7. Heyman SN, Rosen S, Rosenberger C. Renal parenchymal
8. Heyman SN, Rosenberger C, Rosen S, Khamaisi M. Why is diabetes mellitus a risk factor for contrast-induced neph-ropathy? Biomed Res Int 2013; 2013: 123589.
9. Davenport MS, Cohan RH, Khalatbari S, Ellis JH. The Chal-lenges in Assessing Contrast-Induced Nephropathy: Where Are We Now? Am J Roentgenol 2014; 202: 784-9. 10. Guevara M, Fernández-Esparrach G, Alessandria C, Torre
A, Terra C, Montañà X, Piera C, et al. Effects of contrast media on renal function in patients with cirrhosis: a pro-spective study. Hepatology 2004; 40: 646-51.
11. Tsien CD, Rabie R, Wong F. Acute kidney injury in decom-pensated cirrhosis. Gut 2013; 62: 131-7.
12. Stacul F, van der Molen AJ, Reimer P, Webb JAW, Thomsen HS, Morcos SK, Almén T, et al. Contrast induced nephropa-thy: updated ESUR Contrast Media Safety Committee guidelines. Eur Radiol 2011; 21: 2527-41.
13. Improving Global Outcomes (KDIGO). Acute Kidney Injury Work Group. KDIGO Clinical Practice Guideline for Acute Kidney Injury. Kidney Int 2012; Suppl. 2: 1-138.
14. Jabara R, Gadesam RR, Pendyala LK, Knopf WD, Chronos N, Chen JP, Viel K, et al. Impact of the definition utilized on the rate of contrast-induced nephropathy in percuta-neous coronary intervention. Am J Cardiol 2009; 103: 1657-62.
15. Kooiman J, Pasha SM, Zondag W, Sijpkens YWJ, van der Molen AJ, Huisman MV, Dekkers OM. Meta-analysis: Serum creatinine changes following contrast enhanced CT imag-ing. Eur J Radiol 2012; 81: 2554-61.
16. Bruce RJ, Djamali A, Shinki K, Michel SJ, Fine JP, Pozniak MA. Background fluctuation of kidney function versus con-trast-induced nephrotoxicity. Am J Roentgenol 2009; 192: 711-8.
17. Davenport MS, Khalatbari S, Dillman JR, Cohan RH, Caoili EM, Ellis JH. Contrast Material–induced Nephrotoxicity and Intravenous Low-Osmolality Iodinated Contrast Material.
Radiology 2013; 267: 94-105.
18. McDonald RJ, McDonald JS, Bida JP, Carter RE, Fleming CJ, Misra S, Williamson EE, et al. Intravenous contrast materi-al-induced nephropathy: causal or coincident phenome-non? Radiology 2013; 267: 106-18.
19. Thabut D, Massard J, Gangloff A, Carbonell N, Francoz C, Nguyen-Khac E, Duhamel C, et al. Model for end-stage liv-er disease score and systemic inflammatory response are major prognostic factors in patients with cirrhosis and acute functional renal failure. Hepatology 2007; 46: 1872-82.
20. Orlando R, Mussap M, Plebani M, Piccoli P, De Martin S, Flo-reani M, Padrini R, et al. Diagnostic value of plasma cysta-tin C as a glomerular filtration marker in decompensated liver cirrhosis. Clin Chem 2002; 48: 850-8.
21. De Souza V, Hadj-Aissa A, Dolomanova O, Rabilloud M, Rog-nant N, Lemoine S, Radenne S, et al. Creatinine- versus cystatine C-based equations in assessing the renal func-tion of candidates for liver transplantafunc-tion with cirrhosis.
Hepatology 2014; 59: 1522-31.
22. Mehta RL, Kellum JA, Shah SV, Molitoris BA, Ronco C, War-nock DG, Levin A, et al. Acute Kidney Injury Network: re-port of an initiative to improve outcomes in acute kidney injury. Crit Care 2007; 11: R31.
23. Morcos SK, Thomsen HS, Webb JA. Contrast-media-induced nephrotoxicity: a consensus report. Contrast Media Safe-ty Committee, European SocieSafe-ty of Urogenital Radiology (ESUR). Eur Radiol 1999; 9: 1602-13.
24. Waikar SS, Bonventre JV. Creatinine kinetics and the defi-nition of acute kidney injury. J Am Soc Nephrol 2009; 20: 672-9.
25. McCullough PA, Sandberg KR. Epidemiology of con-trast-induced nephropathy. Rev Cardiovasc Med 2003; 4: S3-S9.
26. Fagundes C, Barreto R, Guevara M, Garcia E, Solã E, Ro-dríguez E, Graupera I, et al. A modified acute kidney inju-ry classification for diagnosis and risk stratification of impairment of kidney function in cirrhosis. J Hepatol: Eu-ropean Association for the Study of the Liver 2013; 59: 474-81.