CONTEXT DEPENDENCY OF RESPONSES TO THE INTERAURAL PHASE
DIFFERENCE IN THE INFERIOR COLLICULUS
PACS: 43.64.Qh, 43.66.Mk, 43.66.Pn, 43.66.Qp
Furukawa, Shigeto1; Maki, Katuhiro1, 2; Riquimaroux, Hiroshi2; Kashino, Makio1
1
NTT Communication Science Laboratories, NTT Corporation, 3-1 Morinosato-Wakamiya, Atsugi, 243-0198 Japan
Tel: +81-46-240-4795; Fax: +81-46-240-4591
E-mail: shig@avg.brl.ntt.co.jp (SF), mkashino@cslab.kecl.ntt.co.jp (MK)
2
Dept of Knowledge Engineering and Computer Sciences, Doshisha University 1-3 Tatara-Miyakodani, Kyotanabe, 610-0321 Japan
Tel: 0774-65-6956; Fax: 0774-65-6791
E-mail: maki@avg.brl.ntt.co.jp (KM); hrikimar@mail.doshisha.ac.jp (HR)
ABSTRACT
We studied the sensitivity of binaural processing in the inferior colliculus (IC) to the temporal context. Unit activities were recorded from the IC of anesthetized gerbils. The stimulus was a sequence of two tone bursts, namely precedent and probe tones, whose interaural phase differences (IPDs) were varied independently. For an appreciable number of units, the strength of the probe-driven responses depended on the IPD of the precedent. A model that incorporates the population responses of such units predicts that the perceived IPD of the probe would be biased away from the IPD of the precedent tone.
INTRODUCTION
The neural representation of the interaural phase difference (IPD), a major cue for sound localization, has been extensively studied, and neurons that are sensitive to the IPD have been found in the various stages of the auditory pathway (see Irvine, 1992 for review). Most previous experiments used single bursts of tones or noises to examine neural responses to binaural stimuli. In everyday life, however, sounds that are meaningful to us are rarely presented without a context. Sounds from multiple sources at different locations can emanate at various times in relation to each other. If we are to understand fully the functions of the auditory system as regards the processing of binaural information, it is essential to consider the sensitivity of neural responses to various contexts.
In conducting the present study, we were motivated by a psychophysical finding that could be taken as an example of the context dependency of auditory information processing. After prolonged exposure to an ‘adapter’ sound at a certain IPD, the perceived IPD of a following sound is biased away from the adapter IPD (Kashino and Nishida, 1998). A similar result was also observed for free-field stimuli (Carlile et al., 2001).
tone. The results imply that IPD processing by populations of IC neurons is context sensitive.
METHODS
Experiments were performed on 15 adult Mongolian gerbils (meriones unguiculatus) of both sexes, weighing between 48 and 78 g. The animals were initially sedated with an intra-muscular injection (~1.4 ml/kg) of a 2:1 mixture of ketamine hydrochloride (50 mg/ml) and xylazine (25 mg/ml). Additional injections were given as needed to maintain an areflexive state. A heating pad was used to maintain the animals’ body temperature. The scalp and pinnae were removed to expose the skull and the interparietal bone. A head holder was mounted on the anterior part of the skull. The animal was placed inside a sound-attenuating chamber, and stimuli were delivered dichotically through earphones (Sony, MDR-EX70SL) coupled to plastic tubes with an inner diameter of 3 mm, which were fitted to the openings of the external auditory meatuses. We calibrated the sound-delivery system by creating FIR filters, based on frequency responses recorded by probe-tube microphones (Etymotic Research, ER-7C), which were placed on both ears about 3 mm from the tympanic membranes. Signals were generated by custom-made software at a 44.1-kHz sampling rate and with a 16-bit resolution, and were presented through a sound card (SEK’D, Siena) on a personal computer. We employed an extracellular technique to record the neural activity. This technique involved the use of enamel-coated elgiloy electrodes that we inserted dorso-ventrally through several holes (~0.5 mm diameter) made in the posterior region of the skull. The responses were amplified with a pre-amplifier (WIP, DAM80), and stored at a sampling rate of 44.1 kHz in the hard disk of a PC. On-line, the recorded responses were bandpass-filtered (passband 0.3-3 kHz), and the spike waveforms of single-units or multi-unit clusters (simply referred to as ‘units’ in this report) were isolated. We used this information to determine the best frequencies of neurons and threshold sound pressure levels (SPLs). Off-line, we also isolated the spike waveforms in a similar way. The neural IPD sensitivity data we obtained were based on the results of the off-line spike sorting.
Stimuli were either single tone bursts, or sequences of two tone bursts. Single tone bursts were used as search stimuli for unit responses, and for determining the frequency selectivity and binaural sensitivity of units. A tone sequence consisted of a ‘precedent’ tone, followed by a ‘probe’ tone. The durations of the precedent and probe tones were 200 and 50 ms, respectively. The tones were gated on and off synchronously between the ears with 5-ms raised-cosine ramps. There was a brief silence between the precedent tone and the probe tone. We varied the duration of this silence between 10 and 200 ms, and we adjusted the duration for each unit such that the unit responded reliably to the probe tone. The same frequency and SPL were used for the precedent and probe tones. The frequency of the stimulus was typically the unit’s best frequency (300~1500 Hz), but a frequency lower than the best frequency was used for some units when the unit showed IPD sensitivities only when the lower frequency was used. The stimulus SPL was 20 dB above the unit’s threshold SPL. We varied the IPDs for the precedent and the probe tones independently. For the precedent tone, the IPD varied typically between values of –π/2, 0, and π/2 radians. For the probe tone, the IPD varied between –π and π radians, divided with equal intervals. Note that a positive IPD indicates that the phase for the ear contralateral to the recorded IC was in advance of that of the other ear. Stimuli were presented in random order, and the inter-stimulus-interval was at least one second. There were typically 40 trials (range of 10 – 52 trials) for each stimulus.
Recording lasted typically for ~12 hours. After the recording, the animal was sacrificed with an intraperitoneal injection of a lethal dose of sodium pentobarbital. The brain was fixed with 10% formalin. Although we conducted a histological examination of the fixed brain slices, we had difficulty in exactly identifying the neural structure in the IC (i.e., central nucleus, dorsal cortex, and external cortex, as defined by Morest and Oliver, 1984) from which the unit recordings were made. That was because we attempted to record from low-frequency units that were distributed around the dorso-lateral fringes of the central nucleus, located near the border with the dorsal cortex or the lateral nucleus (e.g., Cassedy et al., 2002). Therefore, we regard the present data as collectively representing the IC.
In some analyses, we averaged the probe-driven spike counts across the probe IPD, to represent the overall strength of the response to the probe. The unit’s sensitivity to the probe IPD was represented by the plot of the mean probe-driven spike counts versus the probe IPD, which we refer to as the ‘IPD function’. The IPD function was summarized in terms of the vector strength and the centroid IPD, which are the length and the direction, respectively, of the vector average of the spike-count-weighted probe-IPD (Goldberg and Brown, 1969). The vector strength and the centroid IPD are indices of the degree of the unit’s IPD selectivity and the preferred IPD, respectively. We define a unit as having a significant IPD tuning if the unit’s vector strength in the absence of the precedent exceeded a criterion value. The criterion value was the 90th percentile of the vector strength computed for a condition in which the correspondence between the probe IPD and the mean spike count was randomized, which was repeated 1000 times.
RESULTS
The present data represent 49 single units or multi-unit clusters recorded from 15 animals. In the following sections, we first describe the response patterns of some representative units of our data set. We then analyze the effects of preceding tones in terms of the response strength and the IPD tuning of the units.
IPD functions of units
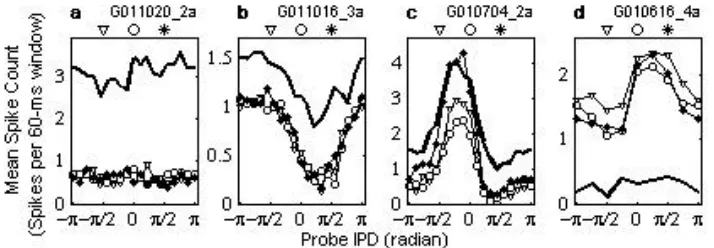
[image:3.596.111.468.582.706.2]Figure 1 shows the IPD functions (the average number of probe-driven spikes plotted as a function of the probe IPD). The figure shows four units that are representative of our data set. The thick solid lines indicate spike counts in the absence of the precedent tone. Lines with symbols indicate the IPD functions in the presence of precedent tones. The symbols correspond to the precedent IPDs indicated at the top of each panel. Unit G011020_2a (panel a) had no sensitivity to the probe IPD, as indicated by the rather flat IPD functions, with or without a precedent tone. There was no apparent difference between the IPD functions of the precedent IPDs. Unit G011016_3a showed some IPD sensitivity with its maximum response around a probe IPD of –3π/4 radians in the absence of the precedent tone (panel b, thick line). In the presence of the precedent tone, the spike count decreased, while maintaining similar IPD function shapes. Again, there was no effect attributable to the precedent IPD. Unit G010704_2a (panel c) showed a relatively sharp IPD tuning with or without the precedent tone. For this unit, it can be seen that the IPD function was modulated by the precedent-tone IPD. However, the IPD at the peak of the function did not change when the precedent tone was present, or with the precedent IPD. Unit G010616_4a (panel d) is an example of a rare case in which the prove-driven spike count was increased by the presence of a precedent tone. For this unit, the overall response strength changed somewhat with the precedent IPD, but the peak of the IPD function was consistently around π/4 radians of the IPD for the range of the precedent IPDs.
For a population of units in our data set, the spike count for the probe was generally markedly reduced by the presence of the precedent tone. The units shown in panels a-c are examples of such cases. The average of the spike counts across the entire probe IPD, as an index of the overall responsiveness to the probe, was reduced by >10% for ~86% of the units by the presence of the precedent tone. About 43% of the units showed significant IPD tuning of the spike count in the absence of the precedent tone (c.f., panels b-d). When there was no precedent tone, the vector strength was greater than the criterion value (see the Methods section for details). As for the effect of the precedent IPD, for ~57% of the units, the overall response strength varied by >10% when we varied the precedent IPD (c.f., panels c and d).
Effect on response strength
We examined further the effects of the precedent tone on the overall response strength. The overall response strength to the probe was represented as the average spike count across all the probe IPDs. The panels on the left in Fig. 2 show the average probe-driven spike count as a function of the precedent IPD for units G010704_2a and G010616_4a (c.f., Fig. 1b and c). It can be seen that the probe-driven spike count varied with the precedent IPD. For unit G010704_2a (top panel), the average spike count had its minimum value around the precedent -tone IPD of –π/4 radians. We note that the IPD of the minimum roughly corresponded to the preferred IPD of the unit, as indicated by the IPD function in Fig 1c. The same tendency was true for unit G010616_4a (lower panel). These results indicate that the response to the probe was reduced by the greatest amount when the IPD of a preceding tone was close to the unit’s preferred IPD.
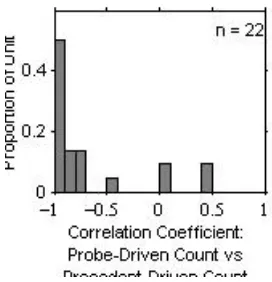
[image:4.596.357.493.72.213.2]It is possible that the observed dependency of the probe-driven response on the precedent IPD can be accounted for by the precedent -driven response, rather than the precedent IPD, per se. This possibility is suggested by the plot of the probe-driven spike count versus the precedent-driven spike count, shown in the right panels of Fig. 2. Those plots demonstrate clear negative correlations between the probe- and precedent-driven spike counts, indicating that the stronger precedent-driven responses were followed by the weaker probe-driven responses. This tendency was generally true for the population of units that showed the precedent-IPD effects. Figure 3 is a histogram of the correlation coefficients between probe- and precedent-driven spike counts for 22 units for which the overall probe- and precedent-driven response strengths varied by >10% as a result of the variation in the precedent IPD. The histogram indicates that ~77 % of units showed a strong correlation (r < 0.7).
Figure 2 (Left) Probe-driven spike count as a function of the precedent IPD. (Right) Probe-driven spike count as a function of the precedent-driven spike count. Each row of panels represents one unit as indicated on the right of the row. See the text for the methods of computing the probe-and the precedent-driven spike counts.
[image:4.596.99.318.73.288.2]Effect on IPD selectivity
In this section, we examine the effects of the precedent IPD on the IPD tuning of the units. We represent the preferred IPD in terms of the centroid IPD or the phase of the spike-count-weighted vector-average of the IPD function (see the Methods section for details). The panels in Fig. 4 show 3 units, and we plot the centroid IPD as a function of the precedent IPD. The error bars indicate the ranges of IPDs at which the mean spike count was greater than the 75% of the maximum spike count for the precedent IPD. The data shown outside the frames indicate the condition with no precedent tone. In all the panels, the plot profiles are generally flat, indicating that the precedent IPD had little effect on the unit’s preferred IPD. The tuning width (i.e., IPD range of the 75% the maximum spike count) varied somewhat with the precedent IPD, but there was no systematic variation with the precedent IPD.
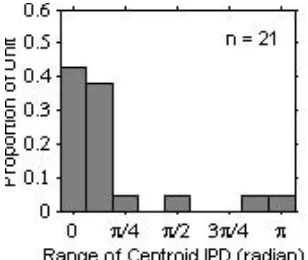
We examined the effect of the precedent IPD on the centroid IPD for a population of units that showed significant IPD tuning (see the Methods section for the definition). Figure 5 shows a histogram of the ranges of the centroid IPD for various precedent IPDs. As the histogram indicates, the centroid IPD varied relatively little with the precedent IPD: For ~86 % of units that we tested, the centroid ranged <π/4 radians. There were a few units that showed relatively large centroid variations (≥ π/2 radians). However, for those units the vector strength was barely significant, and therefore the centroid estimates were unreliable.
DISCUSSION
Context dependency of IC response and underlying mechanisms
Spitzer and Semple (1993) demonstrated the context dependency of IC neurons as regards IPD sensitivity. They used stimuli with a continuously varying IPD, and showed that the response strength of the IC neurons for a given instantaneous IPD tended to depend on the direction of the IPD change. In the present study, we used static-tone sequences and showed the dependency of IC responses on the precedent-tone IPD. This suggests that the context effect found by Spitzer and Semple reflected a neural mechanism that was not specifically for dynamic stimuli. It is probable that the context effect found by Spitzer and Semple and by the present study is based on a common ‘adaptation-of-excitation’ mechanism as suggested by McAlpine and colleagues (2000). That is, the context effects on the IPD sensitivity could be accounted for by the neural sensitivity to the response history, rather than by the stimulus history, per se: the response to a given instantaneous IPD depends on the degree to which a preceding stimulus elicits a response. In a way that was consistent with the suggestion by McAlpine and colleagues, the present result showed that the probe-driven spike count generally showed a clear negative correlation with the precedent-driven spike count (Figs 2 and 3).
[image:5.596.94.245.72.353.2]Figure 4 Centroid IPD as a function of the precedent IPD. Each panel represents one unit. See the text for the method of computing the centroid IPD. Error bars represent the ranges of IPDs for which the mean spike count was greater than 75% of the maximum. The data outside the frames represent the centroids when there was no – precedent tone.
[image:5.596.90.244.498.628.2]There are, however, possibilities that additional, as-yet unknown mechanisms were involved in the context effect found in both of Spitzer and Semple’s (1993) and our studies. We note a study by Malone and Semple (2001), which demonstrated that the IC neurons are sensitive to the history of frequency of monaurally presented stimuli. Malone and Semple reported a significant number of cases in which the IC sensitivity to the frequency history could not be accounted for simply by the adaptation-of-excitation mechanism.
Implications in psychophysical IPD judgment
In this section, we discuss the implications of the present results in relation to the judgment of IPD by a psychophysical listener. Let us consider a hypothetical array of neurons in the IC that are tuned to a range of IPDs. A probe with a given IPD would elicit a distribution of responses along the neural array, or a population response pattern, centered around the neuron with its preferred IPD on the probe IPD. Let us assume that the IPD perceived by the psychophysical listener corresponds to the centroid of the population response pattern. When a preceding tone with another IPD is present, the present results can lead us to expect that the responses of neurons that are tuned near the precedent IPD are particularly reduced. Under that condition, the centroid of the population response pattern to the probe could shift away from the precedent IPD. This prediction is parallel to the psychophysical observations reported by Kashino and Nishida (1998): After exposure to an adapting stimulus with a certain IPD, the listener’s perceived IPD of a probe tone shifted away from the adapter’s IPD. To account for their results, Kashino and Nishida presented a model that was similar to the above population-response model. We also note that Carlile and his colleagues (2001), using broadband stimuli presented in the free-field, reported psychophysical observations that were comparable to those of Kashino and Nishida. Carlile and his colleagues proposed a similar model that incorporated a hypothetical population of superior-collicular neurons. Although we should be cautious in connecting our results directly with the psychophysical findings of Kashino and Nishida (1998) and Carlile et al (2001) because of differences in recording methods and in the time scale of the stimuli, it is possible that those psychophysical phenomena were based partially, if not entirely, on the neural processing observed in the present study.
CONCLUSION
The present study indicated that the response to a probe tone was reduced by the presence of a precedent tone, and the amount of reduction depended on the IPD of the precedent tone. Specifically, there tended to be a maximum response reduction when the precedent IPD was near the unit’s preferred IPD. It is possible that this apparent effect of the precedent IPD is mediated via a stimulus-independent mechanism, i.e., a stronger response would cause a greater reduction in the response to a following sound.
ACKNOWLEDGEMENTS
This study was partly supported by special coordination funds from the Science and Technology Agency of the Japanese government, and a grant to RCAST at Doshisha University from the Japanese Ministry of Education.
REFERENCES
Carlile S, Hyams S, Delaney S (2001) Systematic distortions of auditory space perception following prolonged exposure to broadband noise. J Acoust Soc Am 110:416-424.
Cassedy JH, Fremouw T, Covey E (2002) The inferior colliculus: A hub for the central auditory system. In: Integrative Functions in the mammalian auditory system (Oertel D, Fay RR, Popper AN, eds), pp 238-318. New York: Springer-Verlag.
Goldberg JM, Brown PB (1969) Response of binaural neurons of dog superior olivary complex to dichotic tonal stimuli: some physiological mechanisms of sound localization. J Neurophysiol 32:613-636.
Irvine DRF (1992) Physiology of the auditory brainstem. In: The mammalian auditory pathway: Neurophysiology (Popper AN, Fay RR, eds), pp 153-231. New York: Springer-Verlag.
Kashino M, Nishida S (1998) Adaptation in the processing of interaural time differences revealed by the auditory localization aftereffect. J Acoust Soc Am 103:3597-3604.
Malone BJ, Semple MN (2001) Effects of auditory stimulus context on the representation of frequency in the gerbil inferior colliculus. J Neurophysiol 86:1113-1130.
McAlpine D, Jiang D, Shackleton TM, Palmer AR (2000) Responses of neurons in the inferior colliculus to dynamic interaural phase cues: evidence for a mechanism of binaural adaptation. J Neurophysiol 83:1356-1365.
Morest DK, Oliver DL (1984) The neuronal architecture of the inferior colliculus in the cat: defining the functional anatomy of the auditory midbrain. J Comp Neurol 222:209-236.