1
Open tools for benthic habitat mapping: An study of seagrass (Posidonia
oceanica) in the Natural Park of Cabo de Gata, Spain
Sánchez-Carnero, N1., Espinosa, V2., Moszynski, M3. & , Freire, J1,
1 Grupo de Recursos Marinos y Pesquerías, Universidade da Coruña, Campus da Zapateira s/n, E-15071 A
Coruña, Spain (noesanchez@udc.es, jfreire@udc.es)
2Intituto de Investigación para la Gestión Integrada de Zonas Costeras, Universidad Politécnica de Valencia,
Crta. Natzaret-Oliva s/n, 46730 Grau de Gandia (Spain). (vespinosa@fis.upv.es)
3 Politechnika Gdańska, Narutowicza 11/12, 80-952 Gdańsk, Poland (marmo@eti.pg.gda.pl)
Abstract
Acoustical methods are nowadays a key tool for an efficient benthic habitat classification, but their cost is still too high for a majority of potential users. We have worked on an open procedure for marine habitat classification, developing an open source software, ECOSONS, that, using the raw data from a scientific echosounder as input, extracts customized output files for statistical analysis, allowing the user to inspect and modify the computational protocols used. A statistical procedure has been also developed to classify benthic habitst from output files of acoustical data and it has been customized for the case of seagrass (Posidonia oceanica) beds.
We present here the preliminary results of a benthic habitat mapping exercice in Cabo de Gata, Andalusian coast, SE Spain. Both single-beam and down-looking Side Scan Sonar data were recorded and analyzed. PCA and cluster analyses were carried out to reduce the multidimensionality of the data and to define acoustic groups using directly the energy values recorded by both transducers as input, instead of the traditional methods. Image analyses were performed to measure the height of bottom structures. Final groundtruthing corroborated the correspondence between acoustic groups and benthic habitats.
Keywords: coastal ecosystems, benthic habitat mapping, hydroacoustics, ECOSONS, Posidonia oceanica, Mediterranean, seagrass, open source software.
1
Introduction
2
However, Posidonia oceanica is experiencing a widespread decline throughout the Mediterranean Sea [5], which might derive in a significant environmental problem affecying ecosystem conservation and management.
Over the last few years there had been different studies aimed at evaluating the distribution of seagrass beds, but direct sampling methods are costly in terms of time and money. Acoustic methods could present a good alternative allowing to assess large areas over short periods of time; however the backscattering of the seagrass in the single beam echosounders seems not to be neat enough.
High-frequency Sidescan sonar has been used in qualitative seabed mapping studies where the primary aim is to locate features and objects on the seabed [2]. In the present studywork, we have used a single beam bi-frequency echosounder and a down-looking Sidescan sonar of 200 kHz frequency and an open source software designed for acoustic data analysis to evaluate their applicability for mapping the distribution of the seagrass beds of P. oceanica, in the area of the Cabo de Gata Natural Park in Andalusia, Spain.
2
Material and methods:
2.1 Study area and acoustical survey
[image:2.595.162.436.487.671.2]Two acoustic surveys were performed, in April-May 2007 using an EA400P echo-sounder (Simrad, Norway) with Combi D transducer of 38 and 200 kHz and in November 2007 using a Sidescan sonar transducer 200-0,5x49. A small oceanographic vessel (12 m long) was used in both cases. The transducers were located on the hull rail anchored using a pin-shaped steel device (figure 1). In order to obtain more normal incidence angles in the bottom with a transversally wider beam, the usual working angle of the Sidescan sonar transducer was changed to 65º with respect to the water surface.
3
[image:3.595.128.468.210.460.2]The first surveyed area was about 25 km
2, located between Point of Media Naranja (1º54’W,
36º56’N) and Inlet of Rodalquilar (2º0’W, 36º52’N) at the Cabo de Gata Natural Park,
Andalusia (SE Spain). The second survey comprised a wider area in Agua Amarga bay, that
included within the first surveyed area. Figure 2 summarizes these surveys which consisted in
79 and 30 transects respectively almost perpendicular to the coastline and from a depth of 60
to 5 m in the single beam survey and from 45 to 5 m in the Sidescan sonar survey. Distance
between contiguous transects was approximately set to 150 m. Positions were recorded into
the sounder files using a GPS device.
Figure 2. Transects corresponding to the acoustic surveys carried out in Cabo de Gata (SE Spain).
2.2 Groundthruting
In order to obtain data to validate the acoustical records, scuba diving transects were carried out in the study area. An exploratory analysis of the echograms from the Sidescan sonar, allowed us to select those transects with a high variability in bottom types (attending to the vertical structures observed over the bottom).
Each scuba diving transect covered 1600 m. Transects were filmed in video and information about the presence, the density and the height of the P. oceanica beds was recorded in situ.
2.3 Data processing
2.3.1 Image analysis
4
3.0 BR software. The height of the structures found on the bottom was measured for each ping. Each ping was geolocated and the data were introduced in a GIS.
2.3.2 Video recording
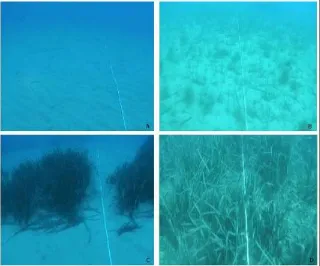
[image:4.595.139.459.224.490.2]All the video recordings were inspected to identify and classify four groups of seabed types: sand bottom, sand bottom with isolated patches of dense P. oceanica, dense P. oceanica beds and small and scattered P. oceanica beds (figure 3).
Figure 3. Types of seabed classified according to the presence and structure of P. oceanica beds. A) sandy bottom, B) small and scattered P. oceanica beds, C) sand bottom with isolated groups of dense
P.oceanica and D) dense P.oceanica beds.
2.3.3 Statistical analysis
All the acoustical data were processed by means of the open source software ECOSONS 1.0 in order to extract the energy values files. This software allows to standardize energy values correcting partially the effect of depth (power adjustment not time adjustment) [1] and to select the pings with the highest energy value (of groups of variables). The Sidescan sonar data was corrected with the 20log equation and the single beam data were corrected with the 30log equation (following [1]).
5
The complete statistical analysis was performed using the open source software R. The first step in the statistical procedure consisted of a reduction of the dimensionality of the matrix using Principal Component Analysis (PCA). Preliminary PCA allowed to identify the variables that adequately explain the variability of the data and to build a new matrix of reduced dimensionality using the first principal components as the new variables. Hierarchical cluster analyses (using euclidean distances) were carried out with the principal components in order to arrange pings into groups according to their acoustic signature. The results of the cluster analysis were used as input for spatial analyses in a GIS.
Complimentary cluster analyses were performed using the summary of the energy of each echo as an input: one for the Sidescan sonar data and tree for the single beam data (corresponding to first echo of 38 and 200 kHz and second echo of 38 kHz).
With the single beam data, since the time adjustment correction was not performed, all data were divided in 8 depth sections (5 m sections between 5 to 30 meters depth, and 10 m sections between 30 to 60 meters depth) . For each section a matrix was built with the adequate number of energy values (taking into account all the complete echo tail of each ping).
3
Results
[image:5.595.106.491.445.694.2]The results of the analyses of the echogram from the Sidescan sonar show three different types of seagrass beds, coinciding with the types identified in the video. The isolated groups of dense P.oceanica in sand bottoms type are not identified as a different type using height, since it is actually the result of the mixing of two different types (dense P.oceanica and sandy bottom). However when observing height along the transect we found peaks in sandy bottoms where isolated groups of dense P.oceanica were observed during the scuba transects (figure 4).
6
In the single beam echograms, the structure of heights obtained did not allow us to classify seabed types. In this case, the height distribution did not present either any correlation with seabed types recorded in diving transects or with a possible seagrass distribution. These structures seem to be due to external factors affecting the ship movement (such as meteorological conditions).
[image:6.595.70.524.339.649.2]The results obtained from both transducers were significantly different. Regarding the Sidescan sonar data, the results of the statistical analysis showed a good correlation with the diver data. One of the identified groups was considered an outlier, representing less than 0.2% of the pings. Regarding the other groups, two of them both represented sand beds and altogether represented 53% of the pings. They were located beyond the seagrass belt (in this area) at 20-23 m depth. Furthermore, depth clearly played a major role in the distribution, since one of these groups was present only at depths greater than 40 m. The pings in the shallowest areas were assigned to two different groups (and comprising less than 4.5% of the pings). In a sandy area like this, these pings correspond with the scarce rocky areas located near the coast. Areas with P. oceanica beds (dense or small and scattered), according to the video and image analyses, were successfully classified into an unique group (Figure 5). A further classification of this group allowed us to obtain two new groups corresponding to dense P.oceanica beds and a mixed group (with small and scattered P.oceanica and sandy bottom whit isolated groups of dense P.oceanica ) respectively.
Figure 5. Seabed classification: Representation of the results of the cluster analysis of the Seascan Sonar acoustical data.
7
4
Conclusions
The results of the present study show that the Sidescan sonar, used as a quasi-vertical transducer, is an effective tool in the assessment of the seagrass beds. Moreover, since the complete protocol (field work and data analysis) has been developed using open source software, the methodology presented here represent an efficient, low-cost alternative to the available commercial seabed classification packages.
The single beam transducer has not offered good results for Posidonia fields assessment. The comparison indicates that a better correspondence could be obtained with a wider angle at least in the transversal direction.
Acknowledgements
We would especially like to thank EnLaRed SL for their help and patience during the long process of development of the corrections and its integration in the software and Alicia Pallas who helped in the English translation of this manuscript. This study was partially funded by projects CONNECT (CTM2006-09043) and ECOSOST (REN2003-04816), granted by the Spanish Ministerio de Ciencia y Tecnología, and project NET961511/1, granted by the Junta de Andalucía.
References
[1] Clarke, P-A. & Hamilton, L.J. The ABCS Program for the Analysisi of Echo Sounder Returns fos Acoustic Bottom Classification. DSTO: Department of Defence Science & Technology Organisation. 1999
[2] Collier, J.S. & Brown, C.J. Correlation of Sidescan backscatter with grain size distribution of surficial seabed sediments. International Journal od Marine Geology, Geochemistry and Geophysics, 2005, Vol 214, pp 431-449
[3] Dekker, A. G., Brando, V. E. and Anstee, J. M. Retrospective seagrass change detection in shallow coastal tidal Australian lake. Remote Sensing Environment, 2005, Vol 97, pp 415-433. [4] Hemminga, M. & Duarte, C.M. Seagrass Ecology. Cambridgen University Press, Cambridge,
2000.