COMMUNITY ANNOYANCE DUE TO ENVIRONMENTAL NOISE,
THE EXAMPLE OF THE CITY OF CURITIBA, BRAZIL
PACS: 43.50 Rq
ZANNIN, Paulo H. T.; CALIXTO, Alfredo; DINIZ, Fabiano B.; FERREIRA, José
A. C.
Laboratório de Acústica Ambiental, Universidade Federal do Paraná
Departamento de Engenharia Mecânica, Centro Politécnico, Bairro Jardim das
Américas CEP: 81531-990, Curitiba, Paraná, Brazil, E-mail:
zannin@demec.ufpr.br
ABSTRACT
This study describes the reaction to environmental noise of the population of Curitiba (~1,6 Million inhabitants). Out of 1000 distributed forms, 860 were returned. The main isolated noise sources revealed by the survey as disturbing were traffic (73%) and neighbors (38%). As a class, neighborhood noise was pointed out as the most disturbing type of noise as 100% of the surveyed people indicated at least one of the items belonging to this class: neighbors, animals, sirens, civil construction, religions temples, night clubs, toys, domestic electric appliances. The main outcomes of exposure to noise were: irritability (58%), difficulty to concentrate (42%), sleeping disorders (20%) and headaches (20%).
Keywords: noise annoyance, urban noise, subjective annoyance.
1. INTRODUCTION
This research presents the results obtained from a social survey carried out in the city of Curitiba, Brazil (1.619.348 inhabitants).
The increasing in population and in number of vehicles have led to the appearance of a new component in urban life: the noise. The noise pollution and its consequent influence over the environment and over the life quality of the human bodies have been the center point of several studies conducted in several parts of the world (Arana et. al., 1988; Kurra et. al., 1999; Sadu et. al., 1998).
All these surveys had a point in common: they had only analyzed the noise under an objective point of view, in other words, the measurements were carried out in various sites, and the urban areas surveyed were classified according to the measured noise levels as acoustically polluted or not.
reduction. However, none of the surveys conducted in Curitiba had the scope of obtaining information on the citizens’ reaction toward this noise.
The main goal of this study is to show the annoyance reactions suffered by the citizens due to the urban noise, and show the main noise sources that cause this annoyance as well.
2 – Methodology
In order to attend the objectives of this research, the authors have developed a questionnaire. These objectives are:
- Identify the main noise sources in the urban environment;
- Identify the reaction of the citizens toward those sources.
-
The questionnaire contained questions regarding the demographic data of the urban residential environment and the annoyance caused by noise.
The citizens who would participate of the survey were randomly picked up, representing the citizens at the residential areas of the city of Curitiba according to the local Zoning and Area Usage Law (Prefeitura Municipal de Curitiba, 2000).
The participants of the survey have been contacted by telephone and then the forms have been sent to them via post service. After two weeks, fifty collaborators had the incumbency of picking up the questionnaires at the residences of the participants, totaling a return rate of 86% out of the 1000 distributed forms.
3 – Results
Among the respondents, 63% were man and 37% were woman, and they were predominantly between 18 and 24 years of age. Roughly, the age distribution among the respondents among 18 and 59 years of age follow the tendency of the age distribution of the city of Curitiba (IBGE, 1996).
Asked if they felt annoyed by the noise in his/her street, the major part of the respondents (44%) have answered that sometimes they did, and about 32% have answered that they regularly felt annoyed. In another question, the interviewed have classified the noise in his/her street as “little intense” (53%), “intense” (39%), and “very intense” (6%). 2% out of the interviewed people has not answered the question. More than half out of the respondents have affirmed that they had been living at the same location for more than 5 years.
The respondents have been asked if the noise in his/her street had increased or decreased during the period they had been living at their present locations. For this question, 60% out of them answered that the noise had increased.
This conclusion contradicts the results obtained in the study on the noise levels measured at the streets of Curitiba (Zannin et.al., 2001), in which a reduction on the noise levels have been observed when compared to the ones obtained by Barbosa in his survey (1992). In Barbosa’s survey, the noise in 93.4% out of the 350 measurement sites were above 65 dB(A), whereas this percentage had dropped to 80.6% in Zannin’s survey. The equivalent noise level (Leq) of 65 dB(A) is considered as the threshold of health impairments by the preventive medicine (Belojevic´ G., Jakovlevic´ B, 1997; Maschke, 1999).
It is important to observe that the measurement sites and the time of the day they have been done (Zannin et. al., 2001) exactly match the Barbosa’s criteria (1992).
of answer for this question were related to non-continuous sources such as: sirens, fireworks, temples, night clubs and civil construction.
The majority of the respondents have answered that they sometimes felt annoyed by the noise in his/her street and have pointed out at least one of these non-continuous sources as the cause of annoyance.
The coexistence of continuous and non-continuous noise sources is a possible explanation for the fact that, despite several respondents have classified the noise as “little intense”, the majority felt annoyed by this noise.
By considering this new focus it is possible to construct a new point of view in this analysis. For example, by putting together in a single group the respondents who always felt annoyed by the noise (32%) and the respondents who sometimes felt annoyed (44%), a new group is formed, denominated “Annoyed by the Urban Noise”, which is represented by 76% out of the respondents. The respondents who somehow felt annoyed by the urban noise belong to this group.
Among the respondents of the first group (related to those who always felt annoyed), 14% found the noise they are exposed to very intense, 58% found it intense and 25% found it little intense.
By combining the above information it is possible to conclude that it is not absolutely necessary for the noise to be intense or very intense to cause annoyance on somebody since 25% out of the annoyed people found it little intense.
By putting together the respondents who classified the noise in his/her street as little intense and those ones who classified it as intense, a new group will be formed, represented by 93% out of the annoyed people. On the other hand, 5% out of the respondents who classified the noise as very intense did not feel annoyed at all.
Now, by considering the 24% who did not feel annoyed by the noise in his/her street, it is noticeable that 83% out of them classified the noise as little intense. These indicators show that those people do not feel annoyed simply by the fact they are not exposed to significant noise levels.
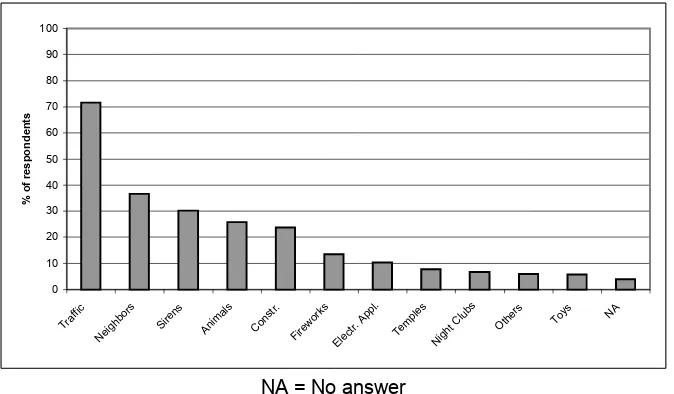
Interesting results has also been obtained regarding the annoyance level and the nature of the noise sources. If the sources are analyzed separately, it is noticeable that among the respondents who felt annoyed by the noise in his/her street, 73% pointed out the traffic as the main source of annoyance and 38% pointed out the neighbors, conform shown in figure 1.
0 10 20 30 40 50 60 70 80 90 100
Traffic Neighbors
Sirens Animals Constr.
Fireworks Electr. Appl. Temples Night Clubs Others
Toys NA
% of respondents
[image:3.595.131.468.538.735.2]NA = No answer
Furthermore, it has been noticed that 52% out of the respondents had been living at the same location for more than 5 years. Among these respondents, 73% have perceived an increase in the noise in his/her street during this period, and 54% out of them pointed out the traffic noise as the main source of annoyance and 28% out of them pointed out the neighbors. As this question could accept multiple answers, there was still 18% who pointed out other sources of annoyance.
Surely the traffic highly contributes to the increase in the environmental noise pollution in Curitiba. However, it is not the only important factor. Other factors, like noise generated in the neighborhood of the respondents, can also be a significant factor in the subjective urban noise perception. Still among the respondents living at the same location for more then 5 years, 27% out of those who felt annoyed by the noise in his/her street also pointed out the civil construction, which is a type of neighborhood noise. With all this, it is possible to conclude that the rapid expansion of the city of Curitiba is a significant factor in the urban noise pollution increase.
At this stage it is possible to analyze how the urban noise analysis would be presented if the noise sources were grouped into two main groups, as follows:
1) Traffic noise: automobiles, buses, motorcycles, trains.
2) Neighborhood noise: neighbors, animals, sirens, religious temples, night clubs, civil constructions, toys and electrical appliances.
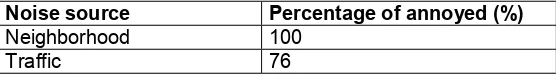
By considering this new approach of grouping the noise sources, it is noticeable that within the group “Annoyed by the Urban Noise” (76% out of the respondents), everybody has pointed out at least one of the sources grouped within “Neighborhood Noise” as a source of annoyance. Furthermore, 76% out of them also felt annoyed by the traffic noise. These informations are illustrated in table 1.
Noise source Percentage of annoyed (%)
[image:4.595.159.437.404.444.2]Neighborhood 100 Traffic 76
Table 1: Noise sources of annoyance – grouped sources
Departing from these results it is possible to understand the apparent contradiction between the conclusion obtained from the urban noise in Curitiba (Zannin et. al. 2001) and the answers for the question “In your opinion, do you think the noise in your street has increased?”. In the methodology adopted for the former study (Zannin et. al., 2001), the main source of annoyance considered was the traffic noise. However, it is noticeable in this analysis that the noise sources grouped within “Neighborhood Noise” are more significant for the community than the traffic noise, even if the latter is the most important one when non-grouped sources are considered. So, it is comprehensible that the subjective perception of the citizens has pointed out to an increase in the urban noise. The population has increased, consequently the neighborhood noise has also increased.
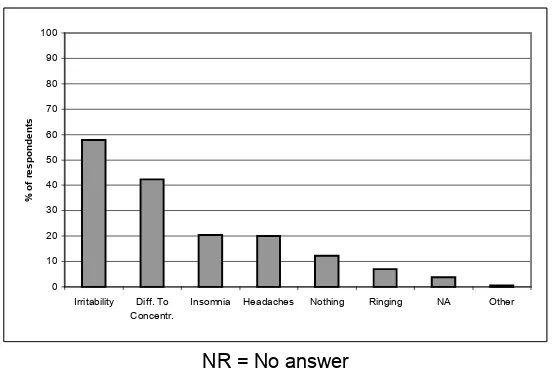
Belojevic and Jakovlevic (1997), Maschke (1999) and Babish et.al (1999) pointed out some effects of the noise over the urban inhabitants: irritability, difficulty to concentrate, insomnia and headaches. It has been observed that everybody within the group “Annoyed by the Urban Noise” had declared that they felt at least one of the effects related above, predominantly irritability and difficulty to concentrate, conform figure 2.
4 – Conclusion
0 10 20 30 40 50 60 70 80 90 100
Irritability Diff. To Concentr.
Insomnia Headaches Nothing Ringing NA Other
% of respondents
[image:5.595.160.440.71.255.2]NR = No answer
Figure 2: Answers to the question: “What does the noise cause on you?”
The comparison between the noise levels measured by Barbosa (1992) and Zannin et. al. (2001) has pointed out a reduction on the emission levels. However, if two classes of noise sources are considered as follows: 1. Traffic Noise (automobiles, buses, motorcycles, trains) and 2. Neighborhood Noise (neighbors, animals, sirens, religious temples, night clubs, civil construction, toys and electrical appliances), it is noticeable that the neighborhood noise if the main source of annoyance, since 100% out of the respondents have declared that they felt annoyed by at least one of the sources grouped within this class. This survey contradicts the findings of Barbosa (1992) and Zannin et. al. (2001), which pointed to a decrease in the noise levels and did not care for the subjective reaction of the population, whereas this analysis have pointed to an increase in the noise levels according to the subjective response of the citizens. The respondents have pointed out the following effects of the urban noise: irritability (58%), difficulty to concentrate (42%), insomnia (20%) and headaches (20%).
5. Acknowledgements
The authors would like to thank CNPq – Project 420040 and DAAD – German Service of Academic Interchange for the financial support for the realization of this survey.
6 – References
Arana, M and Garcia, A (1998) A Social Survey on the Effects on Environmental Noise on the Residents of Pamplona, Spain. Applied Acoustics 53, 245-253.
Babisch, W, Ising, H, Gallacher, J E J, Sweetnan, P M and Elwood, P C (1999) Traffic Noise and Cardiovascular Risk: The Caerphilly and Speedwell Studies, third phase – 10 – year to follow up. Archives of Environmental Health 54, 210-216.
Barbosa, W A (1992) Aspectos do ruído urbano em Curitiba. Biblioteca da Universidade Federal do Paraná, Curitiba.
Belojevic´, G and Jakovlevic´, B (1997) Subjective Reactions for Traffic Noise with Regard to some Personality Traits. Environmental International 23, 221-226.
Instituto Brasileiro de Geografia e Estatística. Relatório de 1996.
Issam, R (2000) Noise Measurements in the Community of Nablus in Palestine. Acustica – acta 86, 578-580.
Kurra, S, Morinoto, M and Maehoura, Z I (2000). Transportation Noise Annoyance – A Simulated Environmental Study for Road, Railway and Aircraft Noises, Part 1: Overall Annoyance. Journal of Sound and Vibration 220, 251-278.
Maschke, C (1999) Preventive Medical Limits for Chronic Traffic Noise Exposure. Acustica 85, 448.