UNIVERSIDAD DE VALLADOLID
ESCUELA DE INGENIERIAS INDUSTRIALES
Grado en Ingeniería de Diseño Industrial y Desarrollo del
Producto
“Mastering the MAS”
Autor:
López Martín, Cristina
Responsable de Intercambio en la Uva
Nieves Fernández Villalobos
Universidad de destino
Valladolid, junio 2017.
TFG REALIZADO EN PROGRAMA DE INTERCAMBIOTÍTULO: Mastering the MAS
ALUMNO: Cristina López Martín
FECHA: 9-junio-2016
CENTRO: Productontwikkeling (UAntwerpen)
RESUMEN Y PALABRAS CLAVE
PALABRAS CLAVE:
Aplicación móvil, juego, jóvenes, museo, interactividad
RESUMEN:
Mi TFG consiste en una aplicación para el móvil dirigida a jóvenes que visiten el museo MAS en Amberes (Bélgica).
Es un juego desbloqueable en una de las exposiciones llamada “Antwerpen à la carte”, creado con la finalidad de atraer a más público joven al museo.
Carla Büchsenschütz Cardoso Cédric Lodewijckx
2
INDEX
2. Introduction
2.1. Who are we
2.2. Our project
2.3. Solving the problem
3. Research Phase
3.1. The exhibition
3.2. What is a GGULVRR game?
3.3. What makes a game addictive?
3.4. Inspirational games and apps
3.5. Graphic Style
3.6. Questionnaire
3.7. Usability
4. Planning and schedule
4.1. Milestones and Interim results
4.2. Gantt Chart
5. Project Plan
5.1. Sponsors
5.2. Stakeholders
5.3. Goals
5.4. Costs and Benefits
6. Our concept
6.1. Previous concepts
6.2. Final concept
6.3. Firsts draftsº
7. The final result
7.1. Storyboards
7.2. Questions about the exhibition
7.3. Characters
7.4. Programming the game
8. Conclusion
7.1. General conclusion
7.2. Individual reflections
7.3. Acknowledgements
9. Appendix
47
89
103
62
48
52
58
4
In this document you will find all the information we gathered throughout the development of the project. First, you will find a short introduction to the team members and everyone’s capabilities and backgrounds. Afterwards you will find the research phase where we give you an explanation about the exhibition “Antwerpen à la Carte” and we tell you about the GGULLIVRR games and the research we did on existing games.
We will also show you how we organised ourselves during the past months to finish this project on time and with a good result. Here we will also show the milestones we set ourselves to reach our goal.
Finally, we will explain the game to you in detail. This will explain the link that we made between a location based game and a simulation game and how this will benefit the MAS Museum. We will show you all the different aspects of the game: how it is played and linked to the exhibition, the graphics, the upgrades…
To make this project work we will also count with the support from the people from the MAS Museum and from our teachers and supervisors.
Introduction
2.1. Who are we
2.2. Our project
2.3. Solving the problem
6
2.1. Who are we?
Our teamname
The name consists out of two parts:MAS
It refers to “Museum Aan de Stroom” because it is where the exhibition for which this game is being designed will take place.
PLAY
Because we are developing a game, which will be played by the visitors of this exhibition, during their visit and afterwards.
Our teammembers
In our group we find students from different backgrounds. Cedric, from Belgium, studies Product Development at the University of Antwerp. Cristina and Carla, both from Spain are Industrial Design Engineering and Product Development students. Cristina at the University of Valladolid and Carla at the Polytechnic University of Valencia. The three together are responsible for the graphic design of the game. Cedric is also our project leader. Then we have Esra from Turkey who studies English Language Teaching/ Education and Training in the Dokuz Eylül University. She is responsible for the linguistic part of the project, and for establishing the link between the game and the exhibition. Thomas is from Belgium and he is an ICT Electronics student at AP Hogeschool. He is our programmer, so his task will be to develop the Demo for our game, and he is also responsible for communication with our supervisors.
MASPLAY
Cédric Lodewijckx
Carla Büchsenschütz
Cristina López Thomas Van Havere
Esra Sen
2.1. Our project
The main problem that we have to solve is that youngsters aged 16 to 18 do not feel attracted enough to the exhibitions by themselves. The Museum aan de Stroom wants to attract more people from this age group, because the percentage of youngsters that come to the museum compared to other ages is not that significant.
The project’s result should be a game that makes the desired target group curious about the exhibition and gives it another dimension through the use of interaction with the museum’s exhibition.
The youngsters should see the museum as an interactive place instead of a boring and unattractive space where they only need to go if it is mandatory, for example during school trip. The MAS will have a game that will be used as long as the exhibition lasts. It will be used as the hook to make them want to go to the exhibition, but it should also have an instructional side.
2.2. Solving the problem
To solve this problem, the goal is to make the exhibition more interactive and attractive in the eyes of the youngsters. Throughout the project we will develop a game (as a concept of a GGULIVRR game) that attracts youngsters and we will give an “extra, interactive dimension” to the exhibition so that it will be more attractive for young and old. All of this will be done without doing any changes bigger than adding a QR code to the exhibition.
8
to take home and keep playing.
To develop the idea and make the concept work we will work together, but the tasks will be divided between the members of MASplay, according to the knowledge earned in our respective studies.
Research Phase
3.1. The exhibition
3.2. What is a GGULVRR game?
3.3. What makes a game addictive?
3.4. Inspirational games and apps
3.5. Graphic Style
3.6. Questionnaire
3.7. Usability
10
3.1. The exhibition
“Antwerpen à la carte”
Cities are hungry. Feeding a city is a daunting challenge. The daily supply and sales of food, preparing it and eating it, and the waste processing define how the city grows, how it’s shaped. For centuries now the port city of Antwerp also thanks its unique panorama to this. Here you can follow the hidden traces of food throughout the city.
Learn about ingredients and flavours that reach the port city of Antwerp from the dense countryside overseas, ever since the Golden Age of the 16th century. That supply could be seen, heard and smelled for a long time. Stroll along markets and visit small and large shops. Enjoy the wealth of eating and drinking businesses. Discover how food waste was recycled. Watch an unseen portrait of Antwerp as an eating city.
And what about the future? More than half of the world population is already living in cities. That percentage is quickly increasing, while agricultural land is decreasing. The challenge is enormous: how will those large urban populations feed themselves? Can the past provide inspiration?
- Text by the MAS
3.2. What is a GGULVRR game?
physically get in touch with real objects by scanning an intelligent tag, for example QR code or NFC tag. Then one gets contextual information about the specific object which can be part of a whole storyline.
Generic Game:
A GGULIVRR GAME is a mobile app. You can play this game using all typical mobile technologies – internet, networking, mobile interactions.
Ubiquitous Learning:
Learning is not just from a book. Learning can happen everywhere by exploring the real world.
Interactive Virtual:
A GGULIVRR GAME can present an interactive virtual world which you can explore by interacting with the mobile phone.
Real Realities:
Real objects are tagged with an intelligent tag. You can interact with those objects by exploring them and scanning the code.
12
“I’m number ONE!”
We always want to be the best, at least better than the others. If we see someone score better than us we need to beat their high score. Even if it is going to take us all night to do it! (the use of avatars and your friends scores)“Keep it simple”,
it’s not rocket science! Don’t overwhelm the user with a complicated interface. The average focus span of a youngster is 8 seconds, so in these 8 seconds they need to understand how to use it and help them in the game.(Think APP’s like TINDER, just swipe left and right)
It needs to get them to
“another place”
: People are playing games because they don’t want to be in their current situation, because they are bored... The game can’t put too much pressure on the user otherwise he/she is likely to give up and change your game for another one. Think about Candy crush and Angry Birds; you can play them everywhere and at any time without any time pressure or need for constant attention.“We want control!”
We as people like to have a certain feeling of control, take that control away and we are likely to get irritated. We like to express ourselves and when we do it it gives us a feeling of satisfaction (see the Sims, social media like Instagram or the choice of which vegetables to grow on Farmville). Besides to that we don’t want to lose our effort! Again in Farmville the crops will die if you don’t come back in time what makes the user come back more often cause they don’t want to lose everything they ‘worked’ for. The fact that you can customize your land gives the game an extra strong point.“Subconsiousness!”
Make use of the fact that our subconsiousness is more likely and faster to make emotional decisions. For example, think about candy crush in relation to the sweet taste of sweets OR the colour/word test. Everytime the user fails he feels angry for making such a mistake and they want to try again.JUST ONE MORE ROUND!? Give the user a challenge. Encourage this challenge by giving rewards. This makes the user feel good (releasing dopamine). Gives the user another challenge and so on. Make one fatal mistake and the user wants to do it again
3.4. Inspirational games and
apps
To start our research we asked the people from the MAS (Museum Aan de Stroom) if they already created a sort of app in the past. We found out that they had two apps on the market. There is an app called “Museum Aan de Stroom”. This is an app that gives you some information about the MAS (Museum Aan de Stroom) and its surroundings. The second app that we found was MASup.
MASup
The MASUP app was an idea from “MAS in jonge handen” and came out in February of 2015. The goal of this app is that you chose one of the 6 routes. Then,you follow one of these routes trough the museum. Every route has its own theme and will take you trough different parts of the museum. The different themes are :
“Vluggertje”: You will get to know the core of the museum fast and efficiently.
“I’m Kanye West”: If you like to shine and you want to know about power throughout the ages.
“‘k zien a geire” Here you can learn the best kept secrets and anecdotes from Antwerp.
“MAS op wereldries”: Will take you on a world tour throughout the entire museum.
“Lazy Sunday”: Take your time and relax while looking at the exhibits.
“Mijn date is heet”: Will take you to the secret corners of the museum.
14
If you can’t choose which tour you want to follow you always can let the app decide for you. If you find a nice spot that you want to remember you can take a picture with some cool effects via the app and post it on social media.
When you click on a certain route you will get a little overview of what this route contains. You will see the amount of time it’s going to take and how many objects you will find. After you clicked the start button the app will guide you through the chosen route. To start, first you will need to buy a ticket. After that you can put your backpack away in one of the lockers. The app will tell you everything, from where the toilets on your route are to which floor you have to go to. During the tour you will get facts about the museum and the exhibition.
There are also a lot of minigames in the MASup app. Minigames like a little quiz about objects you might have seen on a floor, or questions which you have to answer with Yes/ No.
Another mini game is one where you have to drag buildings that are very recognizable in the Antwerp skyline to the right spot or drag objects in a sarcophagus.
Also there is a mini game where you have to complete a puzzle.
Clash of clans
Clash of clans is a popular mobile game created by “Supercell”. It has been available internationally on the iTunes store since August 2012, and on the Google Play Store since October 2013.
In this game you will build your own army and lead your clan to victory by raising rage- filled Barbarians with glorious moustaches to pyromaniac Wizards. You will also build your own village to fend off raids and battle against millions of players worldwide. All of this will have to be done so that you can be part of the most powerful clan in order to be able to destroy your enemies.
Clash Royale
Clash royale is a game created by Supercell and it was published in the first quarter of 2016. This game borrows the settings from an earlier Supercell game Clash of clans.
This game is fought with cards. A card deck includes 8 cards chosen by the player to be his battle deck. The user can only own 48 cards at a time. There is also a random amount of common, rare, epic and legendary cards. These four kinds of cards are troops, buildings and spells. More cards are unlocked at each new arena which is based in the players’ amount of trophies. These trophies can be gained or lost in battles.
Tribal Wars
Tribalwars is a browser based online game that situates itself in the middle ages. In this game everyone is ruler over his own little village. Under the rule of the player the village will become a great and powerful kingdom with a flourishing economy.
There are a lot of villages that will grow and create alliances between each other. In this way they will form a clan so that they become even more powerful.You will do this by conquering and raiding other players. Eventually you will dominate the world with your clan.
Fig 3.3
16
HayDay
At the beginning, you have only one house, one storage for vegetables and fruits, and one storage for goods and a few pieces of land to grow your crops.You should harvest them but is not necessary to be on time, because they are not decaying. After you level up, you have more diverse vegetables, fruits and goods. You also have many kitchen utensils such as an oven, barbecue, fruit press, etc. But you can buy these only if you have enough money or diamonds and some of them open after you reach certain level. You can trade your crops and goods with your neighbours and facebook friends. You can fulfill orders with your truck or ship. You also have one boat for fishing. After you reach a certain level, your mine will also open to be able to make some rings or necklaces.
Besides, you have a train to get customers from different places.You can also buy some beautiful things for your farm such as bikes, flowers, tables, chairs, pool or hammock,etc.
3.5. Graphic styles
In order to decide which kind of graphic style will be used for the development of the game, we made a few mood boards to get a clear view on the different possibilities. These can be found on the following pages.
Flat design
(picture 1): It is a new and very popular style in the use of games. At the same time, it’s simple and stylish and also consists of a few shapes. It’s an easy style to make but it’s important to give a lot of attention for the compositions and colour combinations, because these are the aspects that will make it a good or bad picture.Animated style
(picture 2): It is one of the most popular styles for digital games, but also pretty hard to make, especially in the limited time we have. This style makes you go into a lot of details for the different characters, landscapes, but this kind of style makes the game look more professional.The games that use this style: Angry birds, Islash, Clash of clans, Temple run, Farmville, …
Isometric/geometric design
(picture 3): Like flat design, the geometric style is easy to make and looks pretty good. For this style, the geometric construction/composition and colour pallets are also very important.The games that use this style: Monument valley, …
Typical illustrator style
(picture 4): This is probably the hardest style we could do regardless of the amount of time we have. A lot of great comics and movies or festival posters are made in this style. However, the amount of labour that these pictures need is very big. It would be great to create a whole game in this style but it is just too hard to do for us.Chosen direction for the game:
An indie game style consisting out of a combination between flat and isometric build up. The reason we chose this is that it looks good and is yet easy to make within the time limit we have.
18
20
22
3.6. Questionnaire
To know what young people want from a museum we went to Don Bosco Hoboken to do a questionnaire. This questionnaire could give us more information about why youngsters are going to a museum or why not, which kind of games are popular among them and what their gaming habits are. (The whole google survey can be found at: https://goo.gl/M5ScC7)
On the question “Do you go to a museum sometimes?” we got the following results. (see fig 3.10)
From these results we can deduce that more than 50% of the youngsters sometimes go to a museum.
When we asked if they had ever been to the MAS (Museum Aan de Stroom) more than 80% answered “yes”. The reason for this is probably linked with why they go to museums. In the following chart you will see that more than 60% of the youngsters go to a museum because of school.
Now that we know if and why youngsters come to the MAS, we wanted to know what type of game they like to play.
Fig. 3.10.
In the questionnaire we gave them a small list of games they could choose out of. This way we could find out which type of game they like the most. This list contained the following games:
- Temple run: This is a 3D game where you need to avoid obstacles.
- Angry birds: This is a game where you need to shoot birds to a structure with pigs on it. When the birds hit the structure it collapses and the pigs die.
- Tribal wars: This is a browser based game with NO interface (only a map) that revolves around economics. Here you need the mine resources. With these resources you can then produce troops to wage war on to other players.
- Candy crush: Here you need to form a combination of candy to get points. It is a click based game.
- Other (overig): In this section the youngsters where able to fill the blanck with the game they play most. A lot of youngsters chose to fill in this section instead of choosing one game from above.
When we had all the results we saw that a lot of them wrote down some other games. We took a closer look and saw that there were two games that kept coming back: Clash of clans and Clash Royale. These games are both war games and both click based with a few 3D elements (for more information about these games, refer to 3.4. inspirational games and apps).
When we told them about the idea that the MAS wanted to implement the use of games into the exhibition and asked them if they would then be more interested to go to an exhibition, 60,5% of the youngsters anwserd yes.
24
Conclusion
The general conclusion that we can make out of the results is first of all that most of the youngsters have been to the MAS but not a lot of them have been there to visit the exhibitions themselves. If they did go to some of the exhibitions, most of them went with a school excursion and not voluntarily. So it could be interesting for us to give more attention to the fact that most of them come in group and for this reason integrate a multiplayer option in the game that is played at the exhibition. Next to these results we can conclude that click-based games are indeed a good direction for further exploration. But young people like action and some rivalry, what makes it interesting to implement some warfare as well (but in less proportion than clash of clans or tribal wars).
In the questionnaire we gave them a text with some information about the exhibition itself (written in the same context and structure as they would have been in a normal exhibition). When we asked them about what they thought about it 52.9 procent said they did not like it because it was too boring, too long and too formal. A few even replied that they didn’t even bother to read it.
This teaches us that we have to rethink how information is given to youngsters and that we should rewrite it in words that youngsters actually use. The youngsters of ‘MAS in jongen handen’ gave us the tip to work with stories and myths instead of long pieces of information.
The shortcoming of this questionnaire is that there were not a lot of girls at the DonBosco institute. Therefore more guys anwsered the questions. This maybe explains why warfare games get clearly a higher score .
3.7. Usability
Introduction to our project
For our project we are making a click-based simulation game for youngsters aged between 16 and 18 years old. “Mastropolis” is a game that gives the “Antwerpen à la carte” exhibition an extra interactive dimension.
The game consists of two parts: at one side we have the tutorial and the unlocking of the game. While at the other side, the user is able to play it at home as well.
When the visitor of the exhibition comes to the MAS, he/she needs to get a hint of where to get the game. When it’s downloaded they will get a welcome screen followed by the first introductions.
We designed characters for each cluster, who will give you a short explanation of who they are and what their function is. These functions are linked to each cluster of the exhibition.
26
For example, the first cluster is about transporting food from the farms and factories to the cities. Here we have Captain Jacques that will give a short introduction about himself and will then ask you some questions about the exhibition itself. The user needs to find the answers in the first cluster of the exhibition.
Following the universal meaning of right and wrong, correct answers will be shown in green while false answers will be shown in red. When the user filled in the right answer he/she will see an achievement icon appearing. This will make clear what the meanings are of the different buildings and vehicles on the island.
The same rules apply for all the other clusters. This makes it easy and understandible for the player. The next image shows the welcome screen that you will ge when you enter the exhibition. Here are all the different characters of the clusters displayed.
From left to right: Cluster 1 (“Into the city”) Captain Jacques, Farmer used in the game itself (he grows the food), Cluster 3 (“Dinner time”) Chef Ato, Cluster 2 (“At the market”) Maria the marketlady and Cluster 4 (“Out of the city”) Shitty Joey.
Meaning of icons
Some icons have their meaning written on top of them, to avoid any confusion. Most of the icons really speak for themselves because they are universally used in games and software programs. (See appendix 1 for a detailed view of the virtual playing field and the different icons.)
Profile: As we speak about someone’s profile, we think of a person. This is the reason why we choose to use an icon of a person as a button to go to their profile.
Upgrade: Or level up, is shown as an arrow pointing up.
Settings: A gear is the most used icon to show where he/she can find the settings of the game, software, …
Statistics/ leader board: this one is shown as a listing, that represents the listing in the leader boards.
Money: we used a coin to show the user their current money statues
Experience: As used in all kinds of games, XP represents your experience level in the game.
Notifications: as mostly used on smartphones, we choose a round circle that will appear on a certain button if there is a new thing available, a request or even the amount of items you have
Close screen: most know icon to close a screen is the ‘X’
Add value: when you want to add a certain value, like on a calculator, we press on ‘+’.
Subtract value: when you want to subtract a certain value you press on “-”.
Meaning of gestures and how they are
communicated
Swiping: The best known swiping icon is the one that is used on Apples IOS. It consists out of different circles that have different opacities. When the opacity of the circle is on 100% the user will know that he is on that screen. If the user sees that there are multiple circles, of which the others have a lower (50%) opacity, they will know that they are able to swipe to different screens (see picture 1).
Tapping: Tapping is the general, most common gesture that is used in this game. The user needs to tap on the different icons to be redirected to the screen they want. For example:
Buildings form the portals to different screens. When you press a building you will go to the screens that gives you information or show you the activities that are possible. When you press the profile icon, you will be redirected to your profile.
Extra concept gestures (these are not included in the demo)
Tap and hold: Move items to another location. The user can’t place any item on any given location because of overlapping. To show if the user can place that item on that specific location, we could use the universal colour meaning of right and wrong. When you press and hold on a certain building, four arrows will appear. When the user is able to place the item at that given location, the arrows will show green. If he/she is not able to place it there, the arrows will show red.
Pinching: With the use of smartphones, zooming in or out will always happen by pinching the screen.
Icon and text sizes
30
For example, the size of our closing button is 57x64px and this is one of the smallest icons in our game.
Text: for the typography of the game, the text needed to be between 40 and 50 points depending on the use of it. We used Helvetica bold 50 points for the headings (like CLUSTER, HARBOR,…) and Helvetica bold, 45 points for the normal text.
Use of colours and their meanings
Items that belong together will always been shown in the same colour. For example, on the profile screen, you are shown the different items you have. We have Food items, Attack items and Defence items. Under these categories we have different kinds of items. The food items consist out of meat, vegetables, fish and grain. These four items are all shown in orange. The attack items are shown in blue and the defence items in green.
In the game you also belong to a faction of your choosing. All the backgrounds of the different screens will have the colour combination of that certain faction. For example: if you belong to “the house of Augmentulitalia”, your background will be a gradient that goes from dark purple to red. Other factions have other colours.
Headings are always shown on a yellow ribbon and all the buttons are white with a opacity of 60% and a white icon (100%).
(see picture 1 and appendix e)
Game play
Feedback on achievements and feed-forward for upgrades
Feed-forward: When the user clicks on a certain building they will see the upgrade screen first. On the upgrade screen they will see their current level (on the ribbon) and what their current capabilities are. As well as how their capabilities will improve after upgrading. (see picture 4)
Build-up logic
The game has a pretty basic build-up. When you open the game you get the start screen which shows you the title of the game, the play button, settings and leader board. By pressing one of these buttons, you will be redirected to a certain screen. For example, pressing the start screen button will send you to the virtual playing field. The same rules apply to the virtual playing field. Pressing an item will send you to a screen related to that item. Pressing on the person icon will send you to your profile screen.
To get a clear view on the build-up of the game, take a look at the graphic walkthrough under the final concept.
32
User experience
Museum experience
The test itself
The test we did, consisted out of nineteen questions given on paper. We did this test to see if the questions gave the user an extra motivation to take a more detailed look at the exhibition. The participants were asked to fill in the papers by searching the answers between the different museum pieces. Some answers were pretty easy to find while others needed some more attention.
We also gave extra attention to the language used in the questions and what we should ask. This because we wanted to avoid creating a school test, like we got them in high school. Those questions would consist out of boring dates and facts.
We wanted to create a sort of treasure quest for the youngsters that would guide them through the exhibition and we tried to do it in a funny way. For example, one question is “Find the brown Volkswagen”. The brown Volkswagen refers here to a piece of art that is shown in the exhibition, more specifically a picture of different kinds of cows.
The questions consisted out of multiple choice questions, fill-in questions and finding pieces in the exhibition
We looked at the amount of time they needed to fill in the questions, the difficulty of the questions and afterwards we took a look at how they perceived it.
The participants
The results
The results were pretty good. Almost all questions could be answered with exception, accept of a few that were apparently well hidden. We have changed these questions or have given a hint to make the search a little easier.
The museum experience of the user definitely changed. Before we did this test, we did a general check on how long it took to go through the exhibition without any questions. The average time took around 30 to 45 min. The visitors that got the questions, took around 1 to 1,5 hour.
Afterwards the participants were gathered back in the ‘atelier’. Here we saw that a lot of them started discussing what the right answer was and where they found it.
Conclusion
The general conclusion is that we could see a drastic increase in the motivation of the participants and the attention that was given to the exhibition. This was shown by the amount of time and right answers that were given by the participants but also on their behaviour at the exhibition itself. In the beginning they were a little bored but after a while they really started searching for the right answers.
We would say that the implementation of the game at the exhibition would really give it an extra dimension and would make the visitor look in more detail to the museum pieces.
Remarks
34
Planning and
Schedule
4.1. Milestones and Interim results
4.2. Gantt Chart
36
4.1. Milestones and Interim
results
Project concept
- Kick off project (February 16th): Get to know the members of the team, the project and supervisors.
- Project management presentation (February 19th): Presentation about what we are going to do and the amount of time that it is going to take to finish each activity. - Initial meeting (February 22nd): First introduction to the exhibition. Explanation about the layout of the exhibition and some of the things displayed.
Project definition
a. Team strengths and weaknesses analysis
(March 4th):Distribute team roles and making arrangements. Get to know each other and the strengths and weaknesses of the team, and how to deal with them. See everybody’s boundaries.
b. Project plan
(March 7th):- Gathering background information - Team roles
- Contact information - Smart goal
- Submit first version of the project plan
Project ideation
a. Project research
(Deadline March 20th): - Youngsters (target group)- Style research (Moodboards) - Interest research (Moodboards)
- Market analysis: other museums, apps, games...
After doing the necessary research we got to know more about the interests of the youngsters and how to achieve our goal.
b. Project ideas:
- Brainstorming - Morphological chart - Persona’s (March 20th) - First concept (March 23rd):
With the brainstorming, the morphological chart and the persona’s research method we got a clear idea of what we were going to develop after the Easter holiday.
c. MIDTERM REPORT
(March 25th).Once we had the concept defined for the midterm report we were ready to start working on developing it directly after the midterm presentations. So we got on it with the graphics, the programing and the linking the game to the exhibition part.
Project design
a. Storyboard
(April 25th):38
b. Technical development
(May 20th): We will have a functioning demo of the application. This deadline was not made because the programming took longer than expected as well as the graphic work needed for it. But by the hand in of the final report there will be a working demo of the game.c. Testing
(May 27th). Since the demo is not fully ready we cannot test the game completely. But there was some testing done, where some youngsters had to answer the questions that link the game to the exhibition (see 3.7. Usability).d. Peer evaluation
(May 27th). After the testing we did with the questions we had made for the game, we realised that we needed to make some changes.e. FINAL REPORT
(June 3rd). After we hand in the final report we will work on getting the final presentation ready.This was what we planned in the beginning, we thought these dates were good to make sure we finished the different stages of our project on time. Until the midterm report these dates were followed in all stages.
Once we got to know the members of the group and our supervisors, and we had the first meeting, which gave us the necessary information to start working, first we made the project plan. This helped us to get a clear idea of all the steps we actually needed to do, and helped us organising the group.
After we handed in the assignments from the different subjects, we had more time to work fulltime on our project. We did all the research needed, researching other games, who the leaders are, what do they do, how do they do it,... Before developing the concept, it was also very important to know what youngsters like, so we did a questionnaire at the Don Bosco institute in Hoboken, where youngsters aged 16 to 19 answered it (for more information see 3.6. Questionnaire and the questionnaire can be found at https://goo.gl/M5ScC7)
papers in the offices from the Museum Aan de Stroom so the people from the museum could also contribute to the idea.
After the midterm report we started working on the actual game. This means we started to work on the graphic work needed for the different screens that the game contains. Meanwhile, Thomas started working on the algorithm and the programming of the game. We also started working on the questions needed to link the game to the exhibition. Esra was responsible for this part and she created a lot of questions based on the information we got from the exhibition. After the opening of the exhibition, on May 15th, we got a clearer idea of which questions were better and also we created some new ones, since from that moment we had the real exhibition to work with.
40
4.2. Gantt Chart
To get a more visual idea of our scheduling we created a Gantt chart, which you can find below.
42
Project Plan
5.1. Sponsors
5.2. Stakeholders
5.3. Goals
5.4. Costs and Benefits
5.1. Sponsors
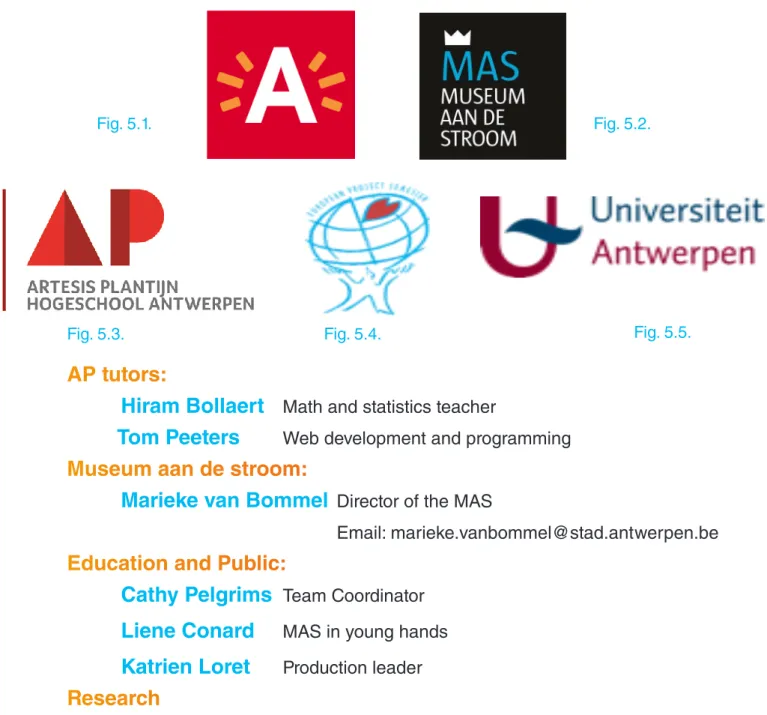
As the Mas Team, we do not actually have sponsors. However, these are our supporters who are going to help us to improve our project (more contact information of each person can be found in Appendix A);
AP tutors:
Hiram Bollaert
Math and statistics teacher
Tom Peeters
Web development and programming
Museum aan de stroom:
Marieke van Bommel
Director of the MASEmail: [email protected]
Education and Public:
Cathy Pelgrims
Team CoordinatorLiene Conard
MAS in young handsKatrien Loret
Production leaderResearch
Leen Beyers
Curator of Antwerpen à la Carte and Team CoordinatorMarketing and Communication
Karen Vandenberghe
Marketing and Communication, Team CoordinatorFig. 5.1. Fig. 5.2.
44
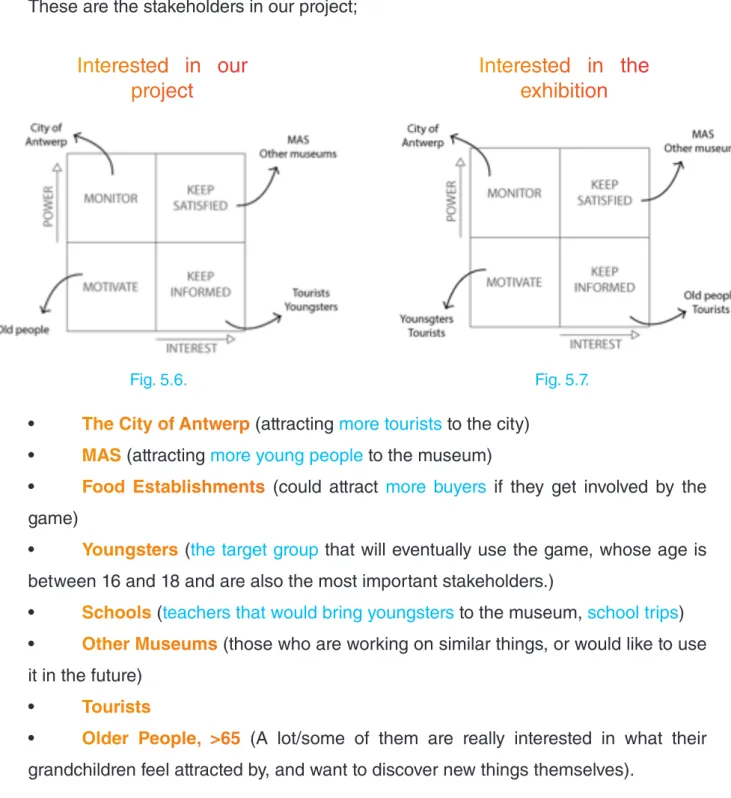
5.2. Stakeholders
These are the stakeholders in our project;
Interested in our
project
Interested in the
exhibition
• The City of Antwerp (attracting more tourists to the city) • MAS (attracting more young people to the museum)
• Food Establishments (could attract more buyers if they get involved by the game)
• Youngsters (the target group that will eventually use the game, whose age is between 16 and 18 and are also the most important stakeholders.)
• Schools (teachers that would bring youngsters to the museum, school trips) • Other Museums (those who are working on similar things, or would like to use it in the future)
• Tourists
• Older People, >65 (A lot/some of them are really interested in what their grandchildren feel attracted by, and want to discover new things themselves).
5.3. Goals
The main goal of the project is to attract more youngsters to the museum. This by adding another interactive dimension to the exhibition ‘Antwerpen à la carte’ through
the use of mobile smartphones. In the beginning we were thinking about developing a GGULIVRR game because of the recommendation of our supervisor, Hiram Bollaerts. But by doing some brainstorming sessions we gradually changed course.
In order to reach our goal, we need to do a lot of research. We need to know what interests the youngsters, how to reach them, why they actually go to museums, what kind of games are on the market and so on. By answering these questions, we will get a clearer view on how to achieve our goal and make it successful.
To get a few answers on these questions we made a questionnaire that was given to students of the Don Bosco institute in Hoboken. We hereby would like to thank the vice director Dirk Boschmans for helping us to set up meetings with the students.
Also a lot of information, especially about the exhibition and the museum itself, was given by the people of the MAS who also gave us accommodation rooms where we can work freely on the project without disturbing any work forces.
For technical information and feedback, we can always rely on the help of our supervisor Hiram Bolleart and Tom Peeters. We would especially like to thank Tom as well for all the time he spends on helping us, while he is not our supervisor.
5.4. Costs and Benefits
The MAS hadn’t foreseen any budget for this project. But to be able to reach our predetermined goal we need to have access to some materials and some sort of accommodation. As previously mentioned (under the section goal) the MAS has given us access to their offices. But after a few work sessions we asked for a separate room where we could work more freely and didn’t disturb other people. This is when we got access to ‘het atelier’, a big room where we can do “whatever we want”.
46
When we are talking about materials, we especially mean laptops and smartphones for every member of the team. But these are things we already have. Next to the physical materials we also need access to different kinds of programs like Xamarin, Adobe Illustrator, InDesign and Photoshop, but because we are still students we have free access to these programs.
Next to materials and accommodation comes knowledge, for which we mostly rely on tutors of UA and AP, supervisors and the workforces of the MAS. Which tutors can give us information about a certain aspect and their working field can be found in appendix A.
Our concept
6.1. Previous concepts
6.2. Final concept
6.3. Firsts drafts
48
6.1. Previous concepts
Concept 1
- VRThe use of virtual reality headsets is a very popular trend nowadays and will surely be a part of our future. These kinds of new technologies always attracts the interests of youngsters. Through the use of VR we can literally give the exhibition a new dimension. The use of VR can be implemented in 2 ways: Augmented reality (see concept 6) and Virtual reality.
Under the section VR we can 360 degrees’ environments that can transport us to different places which are related to the exhibition. For instance, in the part that is about how food is transported to the city, we can implement a 360 degree video of the harbour and so on.
Concept 2
- Ecosystems(Original concept of Hiram Bollaert)
VME = five system need to stand in balance for the VME in order to be healthy. Each of the properties can be controlled by a button to adjust a shortage or an excess.
The fiive systems, the twenty-five properties and the manner in which they influence each other and the global health of the ecosystem are inspired by reality (and do not need to be real).
There is an online VME that evolves continuously, decays continuously and needs to be managed continuously.
The online version publishes the survival time of the current VME. As soon as a version is destructed due to mismanagement, the system reboots and manager gets a new chance and then survival time starts again at zero.
and so on.), a leader board with the best managers (of the current version, possibly of other versions), and a list of current active managers.
The online version posts cries for help via FB, yellow, orange and red messages indicating that system is in unbalance, indicating which actions must be taken, inviting managers to act. Furthermore, the online version is visible for anyone but only managers can act using their phone.
Concept 3
– Treasure questThis concept is about a game that makes the youth look with more detail at the paintings and so on. The game could be about a certain subject that needs to complete a mission where you need to make pictures (think about the guy that is urinating in the portrait of Antwerp) to help him and get a certain reward at the end of the exhibition.
Concept 4
– City tour
This concept consists of involving the city in such a way that gives a sort of tourist guide through Antwerp. You get a few challenges (related to the exhibition) that you have to do throughout the city by scanning the QR-codes in the exhibition. A challenge could be, for instance, taking a picture on a toilet or with a bartender or with a shopping cart and so on (photo’s could be automatically posted on social media, try to start a trend for the funniest pictures). The challenges make the visitor see the city as well as make them go to old bars, restaurants, or factories and so on throughout Antwerp. We could also make “attraction points” in the city that are parts of the game (but also makes non-visitors curious about what’s going on). With attraction points, we mean little art pieces hidden throughout the city (think of a milk bottle at the Melkmarkt). By scanning these pictures you get a new video about the history of that place or just a mark on the specific spots shown in the exhibition, for instance.
(WATCH OUT no boring dates and explanations but MYTHS and funny STORIES told in their own language)
50
map as shown on pinterest.
The difficult part is to give the visitors an award that is actually valuable to them, because this is going to decide the efford they are willing to make to complete the tasks.
Because the chef from ‘t Zilte (Michelin restaurant at the top of the MAS) has made his modern version of an old recipe as shown in the exhibition, it would be nice to reward the ‘winner’ with a diner for two in ‘t Zilte. (It isn’t very expensive for the MAS but could attract a lot of people)
Concept 5
– MAS own social platform (for everything that has to do with cultural events)This concept is about making a social platform in combination with different kinds of mini-games related to the exhibition it’s meant for and also integrating a messenger window where people can ask each other questions about the parts of the exhibition, help with mini-games and challenges. It is also about using this platform also to inform about special events like jazz at the MAS, MASk, movie night on the rooftop, and so on. Furthermore, by using this concept, we can make the museum a place where people can meet and socialize instead of being a boring place where you have to be quiet and we can give the visitors direct information about they want to know, like a sort of Siri.
Concept 6
– Augmented realityThis concept focuses on giving people what they need by giving them a short introduction about each part of the exhibition. So they know what looks more interesting to them and what does not. It is a kind of quick overview.
Additional:
It could also be used on the rooftop to interact with the city of Antwerp. By standing on a particular place, you could see the different places that are mentioned in the exhibition. For instance; by looking at the Groenplaats, you could get a rapid introduction about its history with a look at a few pieces from the exhibition.
This would attract a lot of people to stand on the rooftop, so it would be best to mark a place on the ground and on the glass mentioned under a different QR-code, by standing on that specific spot, entering that specific QR-code and looking at the point on the glass, you could get an overlapping interactive “video” about the different places in Antwerp. (interacting with the city without even going in or a fast way to communicate an extra city trip).
Concept 7
– And ACTION! (very extreme concept)This concept focuses more on the attraction to the MAS. This concept aims to attract more youngster by making the museum a place of more youthly action. For this reason, different kinds of events could be organised such as movies at the MAS (on the rooftop like the American drive ins), or a deathride at the end of the exhibition, and so on.
Doing this concept, we could give the youth the possibility to hang out with their friends in the museum, or we could organise special events especially for youngsters. These events should be well communicated through social media.
52
6.2. Final concept
1. Introduction
Our concept is a click-based game. You will download it at the exhibition and will unlock the different parts of it by solving questions about the clusters, then you will be allowed and prepared to play it outside of the museum and be part of a community existing of all the people who went to the Museum Aan de Stroom.
The point of the game is taking care of your own “city” by keeping the balance between the production of food and the waste it produces. The game is divided into four different parts, related to the exhibition: production of food (cluster one: into the city), market (cluster two: at the market), restaurant (cluster three: dinner time) and waste (cluster four: out of the city). At the end we have the future cluster with its different factions.
When you go to the exhibition, you will be able to unlock different parts of the game, and at the end, namely on the fifth cluster, you will see an explanation about three types of possible future scenarios.
Technological (robots managing the food and unprecedented transport technologies), agriculture (smaller sustainable networks, citizens manage the food themselves) and biological (new forms of life).
By the end of the exhibition, you will have to choose one of the factions that you want to invest in, so you will provide them with the food you produce and they will research ways to implement this way of living. The three factions will “fight” against each other to become the conqueror of the “Museum Aan de Stroom”.
2. Linking it to the exhibition
QR codes.
When they solve the questions about the first cluster by going around and exploring it, they will get the harbor to go fishing and the land to plant vegetables, grains or take care of the animals to get meat.
In the second cluster, they will get the market place, to buy/sell from/to other players and store the food they produce.
In the third cluster, they will unlock the restaurant to make the dishes that they will give to their own faction.
In the fourth cluster, they will build the waste plant to manage the two different types of waste: chemical and biological.
3. Playing outside the museum
Because the main goal is to attract the youngsters to the museum, it seemed a good idea to us that you unlock the game at the exhibition. Afterwards, you will be able to play it outside. By doing this, we will create a community that will encourage other youngsters to go to the exhibition to unlock the game and play it too.
4. Gameplay
As we mentioned earlier, our game is based on four variables which have other sub variables: food (meat, fishes, grains and vegetables), market (buy, sell), restaurant (different dishes) and waste (chemical and biological).
The main goal of the game is to make sure your faction wins. You have two ways to contribute to this: providing the dishes your faction needs or boycotting the other factions.
54
Depending on the day, the factions will need three or four dishes which the different players have to make to help their faction.
Production of food
The virtual playfield is divided into squares. At the beginning of the game, you will have a certain amount of squares that you can use. The amount of tiles will increase when you level up. At the start of the game, you will have to choose between the different forms of producing food: land or sea. To produce fish you will need a harbour and a ship to go fishing, to produce grains, vegetables and meat you will need land instead.
The food will need time to grow, the ships to get back from fishing and the cows to be prepared for slaughtering. By the time they are ready, the user will get a message to collect them, if he doesn’t do in a certain amount of time, the food will rot and it will become biological waste.
The market
If the food gets collected, it will go to the storage in the market. The higher level you reach, the more storage you get. In the market the user can trade the food he does not need online with other players. The fresher the food is, the more it will cost, but if the user does not use it in time and lets it in the storage it will rot too, becoming biological waste.
The Restaurant
The Waste Plant
Finally: the waste plant. Like we already said there are two different types of waste: chemical and biological. Here you will have to keep the amount of waste you produce balanced in order to keep it below the allowed level.
Chemical waste affects you in a negative way. If you have a lot, more than half of the permitted amount, your food will rot in a shorter amount of time and if you have less than half of the permitted amount, it will take more time to rot. Also, if you get over the predetermined limit, you will have to pay to get rid of this waste.
Chemical waste is produced by the packaging from the grains and the vegetables and the oil from the ships.
Biological waste affects you in a good way. If you have more than half of the permitted amount, your food will grow faster and if you have less, your food will grow slower. If you get over the predetermined limit, you will also have to pay to get rid of it.
Biological waste is produced by the animals and the food that gets rotten, because the player didn’t collect it or trade it on time.
Second way to play -> Boycotts and natural disasters
For making the game more attractive to youngsters and to have more interaction between factions we decided to implement two extra features: the boycotts and the natural disasters.
Boycotts
To reach this extra feature the player will have to keep the balance in his city and level up until a certain level, from that point he will be allowed to build the barracks.
56
To protect their city, the player will have four types of characters: walls, “boom-kolen”, poisoned cheese and hedgehogs. Every one of these characters will have an identity card with the explanation on how their defense mechanism works and on how many points of defense and attack they have. The player will buy them with money.
To attack other players there will be four types of animals available, these animals will be fed and trained with chemical waste, so the player will need a big amount of it to attack. The animals will be: kamikaze-rats, ninja-pigs, snails and evil bunnies. About the defense characters, these will also have its own explanation with the different points for defense and attack.
Natural disasters
To make it more interesting we thought about including natural disasters that will affect one faction and will be voted for at the exhibition by the visitors. The disaster will take place when a specific number of people has voted.
The visitors of the exhibition will vote for the faction that is going to be affected by the disaster. The type of disaster will be chosen randomly.
Examples:
5. The factions
As we said, there are three different explanations of future scenarios at the exhibition. Based on them, we created three factions and the player will have to choose one of the three.
Technological
A scenario where robots will manage the food and unprecedented transport technologies will exist.
Agriculture
Small sustainable networks where citizens will manage the food themselves being a more ecofriendly society.
Biological
New forms of life will appear allowing us to eat less or other things we never thought about.
6. Dividing tasks
To make this project a success we decided to divide it into four different parts: the different ways to teach the youngsters about the exhibition and unlock the game, the graphic design of the game, the algorithm and the development.
Esra is going to research the questions to unlock the game.
Cedric, Carla and Cristina are going to make the graphics.
58
6.3. First drafts
In order to give you an idea about what the game is going to look like, we implemented our vision on the interfaces as well as the graphic styles we are thinking about.
In this part you will find the interfaces in order of how they would appear in the game.
Basic idea on the start screen.
(Before this appears, you will get the logo from the MAS, MASplay and city of Antwerp, because they have been working on this project or are supporting us in a sort of way) On the start screen you will get a login screen (see picture 1), where it would be nice that you can login with a Facebook account. On the left top corner you could find a link to the statistics of the different fractions. (statistics screen see picture 3)
picture 1: login screen
picture 3: faction leaderboard
picture 2: start screen
After you have loged in with your Facebook account, there will be more options available on your screen (see picture 2). In the middle of the screen you will have a big play button that will bring you to your personal island (see picture 4). On the left side of the start screen you will have a button that will give you the high scores of your personal fraction, as a sort of leader board. On the right you have the last button for this screen that will mute the game play music, because a lot of people like to listen to their own music or are in a situation where music isn’t allowed or appropriate.
The virtual playfield.
( see picture 4)After pressing the play button on the start screen, you will be sent to the virtual playing field. On this screen you will get a lot of information about the game and its buttons (on picture 4 you will find some indications about what each object means).
In the top, left corner you will find your profile picture, current XP points and how many more you need to reach the next level. In the top middle you will find the name of your faction and its logo. In the top right corner there is an indication on how much money you have and can still carry (so there is a maximum amount of money you can hold without spending it).
When there is some explanation needed in the game, this will happen below in the left corner by a character that is related to the explanation that is being given.
60
When pressing the profile button you will be sent to your profile page (see picture 5). On your profile page, you will find things like your username, the faction you belong to, your total amount of cash and XP points and an overview of the different amounts of items you have.
On the right side you could maybe find your factions flag and a link to your faction’s profile page (a Facebook page and for instance when you like their page you get money).
When pressing the market place button, you will be redirected to the screen as shown on picture 6. Here you can buy and sell your items on your faction’s market. (see picture 6)
picture 5: profile screen
Control gestures
Picture 7: Zoom in/out
Zooming in and out could be done by pinching the screen.
Picture 8: Tap and hold
By tapping on an object and then holding it, you will be able to move it in two dimensions. This will be shown by four different arrows. When you are able to put it down on the chosen ground, the arrows will be green, and if you’re not able to place it on that certain spot, the arrows will be red.
Picture 9: Tap an object
By just tapping an object, you will get two sub-buttons where you have the choice between upgrading that object or going to its information screen (see picture 10).
Picture 10: Information about a certain object
All the detailed information about a certain object is shown on this page.
picture 7: Zoom in/out
picture 9: tapping an object
picture 8: move objects
62
Final result
7.1. Storyboards
7.2. Questions about the exhibition
7.3. Characters
7.4. Programming the game
7.1. Storyboards
In this section we will talk about the different screens of the game and show you how each one of them works and reacts when you click certain buttons.
Starting screen
When you enter the game you see the start screen. There you have three options:
(1)
Start the game.
(2) Go to the leader board.
When you click button number two you go to the leader board and you see the three flags for the different factions, all of them are clickable buttons. By clicking on each of them you go to three different screens where you can see the position on the board and the points of each of the factions. For example, when you select number three you go to the screen above where you can see that the augmentulitaria faction is the first one on the leader board.
(3) Go to the settings.
When you click button number three, you will be redirected to the settings screen. There you have four options:
- Button number five allows you to change the language of the game. - Button number six lets you turn the sound effects on.
64
STORYBOARD
STARTSCREEN
We kept the start screen pretty basic.
Here you can start the game, change some settings or visit the leaderboard to have a quick look at who is winning.
Playing field
After pressing the start button on the start page, you will arrive at the virtual playing field.
Here you will see all your different buildings which can be pressed. After pressing these icons, you will go to the different information screens related to that building. These icons and their storyboards will be explained in the next few pages.
In this part we will talk about the general buttons that can be found on the playing field. Here we have button number one (1) and button number two (2).
(1) When you press this button you will be sent to the profile page. Here you can see all your food, your defence and attack characters as well as the icon of your faction and your profile picture (linked to your Facebook account). Pressing ‘X’ will take you back to your virtual island
66
In this screen you see the storyboard
for the top buttons of the virtual
playingfield.
STORYBOARD
PLAYINGFIELD
On the next pages you will find more information about the different buildings and vehicles.
The waste plant
This screen shows the information about the waste produced on your island. At the top of the page, you have two bars (1 an 2). Bar (1) shows the overall amount of chemical waste, while bar (2) shows the amount of biological waste.
An the bottom, we find the upgrade button (3), which will allow you to upgrade the level of the waste plant by paying the amount of money shown.
Right next to it we find three bars (4) corresponding to the current level which show the speed at which waste is handled, the amount of waste that you are able to have and the balance for chemical waste. This last one will make your food rot faster if it is higher than it should be. On the right bar is shown the same information but for the next level.
The farm
When you press the farm you get the farm screen where you are able to see and do several things.
First you see the upgrade button (5) which will permit you to buy the upgrade for the next level.
You are also able to see the amount of tiles that you are allowed to have on your current level on the bars (6), as well as the amount of tiles allowed on the next level.
68
STORYBOARD
WASTE PLANT
Here you see the storyboard dedicated to the settings, play and leaderboard button and where they redirect you to.
STORYBOARD
THE FARM
Here you see the storyboard dedicated to the settings, play and leaderboard button and where they redirect you to.
1 2
3
4
6
5 7
The Market
When you click on the market icon you get the first screen (1) with your available storage. When you swipe to the right once you can see another screen where you can buy or sell your food. There are four buttons (2), each one corresponds to one kind of food, from the left to the right: grains, fish, vegetables and meat. To buy you only have to select the quantity of food you want with the plus and minus symbols and click on “BUY” (3), then you will be redirected to another screen where you could see the offers of other players (4). Selling is the same as buying but you have to click on “SELL” instead of “BUY”.
70
STORYBOARD
THE MARKET
In the market you can buy and sell food, check your current storage and upgrade it. Food can also be bought from and sold to other players.
To switch between the screens you see on the right, you will have to swipe to the left or the right. The first screen you will see is the upgrade screen. To go to the others you need to swipe right.
The Restaurant
On the top part of the restaurant screen you will be able to see which dishes you are able to make in order to sell them to the MAS. Here it shows the ingredients for every dish and the amount of each ingredient needed. The prepared dishes will be sent to your faction, to give them points to make them win.
On the left side of the screen you find the daily challenges (1). These dishes are the ones that the MAS needs the most that day, and you will get extra points for preparing them.
On the right side you have other dishes (2) that you are also able to prepare, but this will just give you the normal amount of points.
By clicking on the prepare button (3) that is right next to the dish you will make that dish, and it will go directly to the MAS, giving you the amount of money showed on it.
On the bottom part we find the upgrade button (4), allows you to upgrade the level of the restaurant by clicking on it, as long as you have the amount of money and XP needed. On the bars on the side you can see the amount of time that it takes to prepare a dish in your current level and how much time it will take in the next level.
The Harbour
When you click on the boat you get the harbour screen. Here you find the “Go fishing” button (5), which allows you to send your ship away to fish so it can come back with some fresh fish.
Afterwards you find some bars (6). The bars on the left show you the speed and the capacity of your boat on the current level. The bars on the right show you the same information but for the next level.