oa
Veterinaria
México
Publicación Digital de la Facultad de Medicina Veterinaria y Zootecnia
OA
/ 9 1
Vol. 4No. 1January-March2017
Short communication
http://veterinariamexico.unam.mx/
Received: 2016-12-30 Accepted: 2017-02-24 Published: 2017-03-28 Additional information and declarations
can be found on page 7
Copyright 2017 Raul Alegria-Moran et al.
open access
Distributed under Creative Commons CC-BY 4.0
Abstract
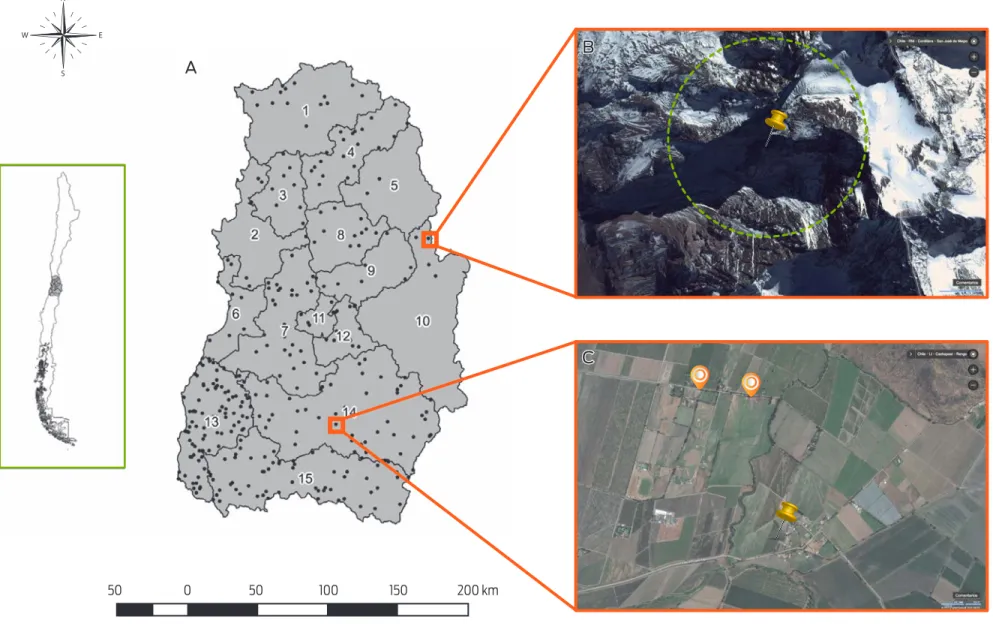
Specific locations of backyard production systems (BPSs) in Chile remain unclear, creating dificulties for designing surveillance activities for promptly detecting zoonotic agents with high impacts on health, such as avian influ-enza and Salmonella spp. This study aims to prove the use of spatial tools for improving the surveillance of BPSs in central Chile. A stratified and pro-portional random sampling was performed in 15 provinces of the Valparai-so, Libertador General Bernardo O’Higgins and Metropolitana regions. In this sampling, 329 BPSs were detected. In the first stage, 329 random sample points were allocated within the study area that searched for BPSs with poul-try or swine breeding. Then, these random points were validated with remote sensing and in the field by searching for the presence of rural or semi-rural areas, nearby crops and houses or small towns within a 5 km radius around each point, while points allocated over hills or water sources (lakes or rivers) were discarded. Over 70 % of the sampling points were correctly allocated. In Los Andes, Cordillera and Chacabuco, less than 50 % of the points were allocated within feasible sampling areas.
From the total BPSs sampled, 89 % met the 5 km radius criteria, and in the provinces of Valparaiso, Cordillera and Cachapoal, over 20 % of the sampling points were outside the radius criteria. This study is the first in Chile to explore the locations and sanitary statuses of BPSs. Given the lack of knowledge about the specific locations of BPSs, their identification during field activities represents a high cost for the surveillance of pathogens. We ar-gue that using spatial tools in BPS surveillance design is an important support for healthcare management.
Keywords: Spatial tools, high impact zoonotic agents, backyard production system, public
health, surveillance design.
Using spatial tools for high impact
zoonotic agent surveillance design
in backyard production systems
in central Chile
Raul Alegria-Moran1,2,3
0000-0002-1608-2499
Andres Lazo1
Santiago Urcelay1,3
Christopher Hamilton-West1,3,*
0000-0002-5609-2237
1 Departamento de Medicina Preventiva Animal,
Facultad de Ciencias Veterinarias y Pecuarias, Universidad de Chile, Santiago, Chile.
2 PhD Programa en Ciencias
Silvoagropecuarias y Veterinarias, Universidad de Chile, Santiago, Chile.
3 Red de Investigación en Zoonosis
Emergentes y Re-emergentes, Santiago, Chile.
*Corresponding author:
Tel: + 56229785578 Email address: [email protected]
Introduction
Poultry and swine bred in backyard production systems (BPSs) represent an im-portant percentage of animal production activity, especially in developing countries.1 Additionally, BPSs are recognized as a support economic activity, mainly in rural areas, stimulated by the increase in demand for organic and/or clean production systems.2 In general terms, BPSscan be characterized as possessing poor biosecurity conditions and low technological development for both the handling of animals and the optimal distribution of BPSs that improves animal husbandry.3 This situation generates a close contact between the backyard farmers and their families and the domestic animal species maintained at the location, such as poultry (hens, chickens, ducks and geese) and swine, pets, and wildlife. Thus, a high interspecies contact can be observed, increasing the risk of pathogen transmission between species.4-6 Evidence shows that this situation could also increase the pathogenicity and the host spectrum of pathogens, such as avian influenza virus and some serotypes of Salmonella spp.7-9
Characteristics of BPSs represent a permanent risk to the national health sta-tus. For example, transmission of pathogens between wild and domestic animals has been acknowledged to increase the risk of the spread and maintenance of avian influenza virus from migratory wild birds along their migration routes.10-13 Backyard poultry and swine are considered the main carriers of a number of strains or subtypes of priority zoonotic agents, such as avian influenza and Salmonella
spp,11,14 becoming a zoonotic risk due to various factors including the direct con-tact between humans and sick animals and the risk of producing contaminated food (public health risk). Furthermore, a BPS may also undergo economic losses due to the high mortality of the affected species (e.g., highly pathogenic avian in-fluenza).15 Despite its importance, there are few studies focused on this high-risk population stratum, and information about the sanitary statuses of BPSs in relation to the prevalence of infection with avian influenza, Salmonella spp. or any other zoonotic pathogen is scarce. The case of Salmonella spp. also presents a high level of underreporting due to the clinical signs and low severity associated with infec-tions in both animals and humans.
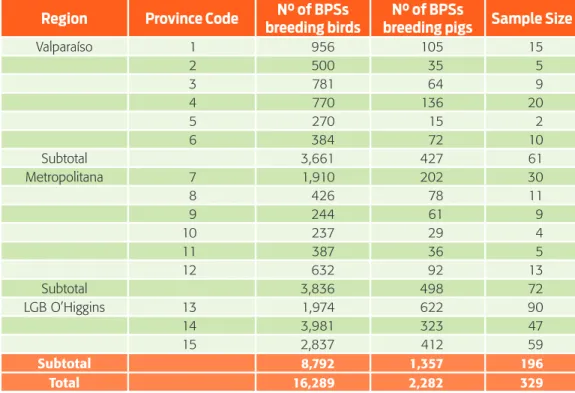
Central Chile has the highest percentage of intensive productive poultry and swine establishments and number of animals. According to the last agricultural and forestry census in Chile, by 2007, there were more than 43.5 million poultry and 2.6 million pigs in the central zone, representing 83 % and 81 % of the total abundance of each species in the country, respectively.16 The number of BPS reg-istered by the same date corresponded to 16,289 breeding birds and 2,282 raising pigs. Hence, with the lack of geolocation of these production systems, this study aims to prove the use of a spatial approach in the design and implementation of surveillance of zoonotic agents in cases where the location and distribution of the target population is unknown and to suggest a way to study these populations or those with similar characteristics.
Materials and methods
Target population
San-http://veterinariamexico.unam.mx 3/ 9
Spatial tools for high impact zoonosis surveillance
DOI: http://dx.doi.org/10.21753/vmoa.4.41.435 Vol. 4No. 1January-March2017
Short communication
tiago regions (Figure 1). According to the last Animal and Forestry census, in Chile, in the year 2007, 16 16,289 BPSs breeding birds and 2,282 BPSs breeding pigs were reported in the study area (Table 1). The sample unit was defined as the BPSs that breed poultry and/or pigs that keep up to 100 birds or 50 pigs to survey for zoonotic agents.
Study design and sample size
A stratified and proportional random sampling was performed, based on the 15 provinces included in the study area. Sample size was calculated following equation 1 adjusted by equation 2, both extracted from Dohoo et al., 2010 17:
n = Z2
α pq/L2 [eq. 1]
where n = simple size; Zα = the value of Zα required for confidence = 1 – α, where
α corresponds to the level of confidence; Zα is the percentile of a standard normal distribution (1- α/2); p = the expected prevalence of the pathogen (e.g., avian influenza, Salmonella spp.); q = (1 – p), and L = the precision of the estimation, also known as ‘allowable error’ or ‘margin of error’.
n' = 1/
(
(1/n) + (1/N))
[eq. 2]where n’ = the adjusted simple size; n = the previous calculated simple size (eq. 1); N = the number of BPS in central Chile.16 Assuming a lack of knowledge about the prevalence of priority zoonotic agents present in BPSs located in central Chile, sample size was calculated based on a prevalence of 50 %, ensuring the maximum sample size possible when using a sample size approach for estimating a proportion,17 a confidence level of 95 %, and a precision of 5 %. BPSs raising pigs were used for the sample size calculation, supposing that they also breed poultry. Giving the final sample size of 329 BPSs distributed accordingly to each province, as detailed in table 1.
Random points allocation and validation
A
50 0 50 100 150 200 km
B
C
http://veterinariamexico.unam.mx 5/ 9
Spatial tools for high impact zoonosis surveillance
DOI: http://dx.doi.org/10.21753/vmoa.4.41.435 Vol. 4No. 1January-March2017
Short communication
Results and discussion
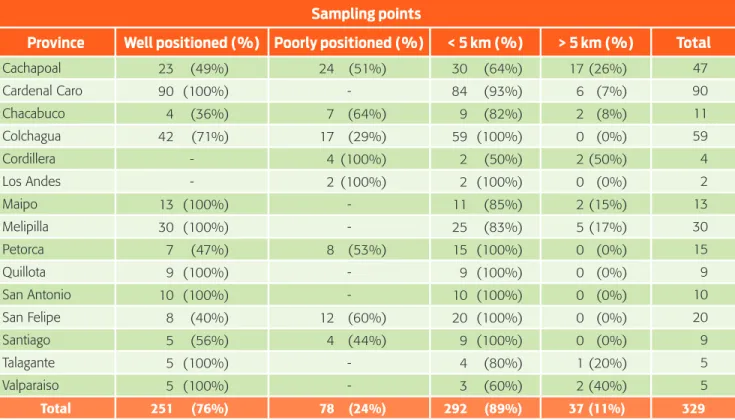
After the allocation of random sampling points for each province, the checking process showed that 251 (76 %) of the random points were well positioned in re-lation to the feasibility of finding a BPS, given the proximity to land with agricultural use, and 78 (24 %) sampling points were poorly positioned (Table 2). These poorly positioned points were allocated over lakes, within residential areas or within the Andes Mountains, and there was no chance of finding a BPS even within a radius of 5 kilometres. Details of the random sampling points and the distributions of well and poorly positioned points can be observed in table 2. Poorly positioned points were re-allocated, removing the possibility of allocating points in the Andes moun-tains or those with the other conditions previously mentioned.
Provinces that presented poorly positioned points correspond mainly to those presenting a significant percentage of surface associated with the Andes mountains (Los Andes, Cordillera, Colchagua, Petorca, Cachapoal and San Felipe). In Chacab-uco and Santiago, the number of poorly positioned points could be related to the use of land, which presents a trend to urban and agribusiness uses.18 Normally, land use consists of vegetable and fruit cultures, which increased the time spent finding a BPS to sample.19 This scenario should be quite different in the two other regions to be sampled, considering that the main activities in those regions are related to animal and agricultural farming activities.16
After adjusting the positions of the random points, it was observed that 89 % presented a BPS within a radius of 5 kilometres, and only for 11 % was it hard to sample the 5 km radius. The most distant BPS was found approximately 13 kilome-tres away from the random point, a situation observed in the province of Talagante. Whereas, the closest candidate BPS was detected within less than 1 kilometre of the random point, also in the province of Talagante.
Table 1. Demographic distribution of BPSs and sample size by province and region.
Region Province Code breeding birdsN° of BPSs breeding pigsN° of BPSs Sample Size
Valparaíso 1 956 105 15
2 500 35 5
3 781 64 9
4 770 136 20
5 270 15 2
6 384 72 10
Subtotal 3,661 427 61
Metropolitana 7 1,910 202 30
8 426 78 11
9 244 61 9
10 237 29 4
11 387 36 5
12 632 92 13
Subtotal 3,836 498 72
LGB O’Higgins 13 1,974 622 90
14 3,981 323 47
15 2,837 412 59
Given that there is a lack of knowledge about the specific location of each BPS that raises pigs or poultry or any other animals, there is a big loss of time resources and equivalent funds just on the detection of a feasible point.20,21 This increases the duration of the sampling activities and often results in requiring over an hour just to find one BPS feasible to be sampled, affecting the efficiency of field activities and the quality of the samples.21 Delays in field activities could affect the integrity of the sample, depending on the type of the sample and the agent involved.22,23 Previous work in our research group spent almost one day just to reach one allo-cated random point and then search for the closest BPS to sample (Di Pillo, F. data not published). According to the characteristics of these production systems, most birds or pigs are raised in partially enclosed systems, where animals are confined at night and released to an extensive rearing during the day, increasing the difficulty of sampling.24
The last agricultural and forestry census from 2007 in Chile underestimated the actual number of existing BPSs in the area, since it only registered those BPSs who perform tax payments associated with agricultural and livestock activities, leav-ing out of its records those who are without formal “agro” activities and maintain a low number of animals on their land. This scenario generates deficiencies in the design of surveillance programs, preventing an early warning of sanitary events occurring in this population stratum.25,26 Likewise, in the event of an emergency or a real-time outbreak, the time spent identifying and monitoring these populations becomes greater, affecting the health status and an early resolution of the event.20
Global tendency leads to the incorporation of spatial tools for the design and implementation of surveillance programmes and the storage of geo-coding data for animal health research.27 In addition, this may help to establish risk based Table 2. Verification process for random sampling points
and 5 kilometres criteria for each Province.
Sampling points
Province Well positioned (%) Poorly positioned (%) < 5 km (%) > 5 km (%) Total
Cachapoal 23 (49%) 24 (51%) 30 (64%) 17 (26%) 47
Cardenal Caro 90 (100%) - 84 (93%) 6 (7%) 90
Chacabuco 4 (36%) 7 (64%) 9 (82%) 2 (8%) 11
Colchagua 42 (71%) 17 (29%) 59 (100%) 0 (0%) 59
Cordillera - 4 (100%) 2 (50%) 2 (50%) 4
Los Andes - 2 (100%) 2 (100%) 0 (0%) 2
Maipo 13 (100%) - 11 (85%) 2 (15%) 13
Melipilla 30 (100%) - 25 (83%) 5 (17%) 30
Petorca 7 (47%) 8 (53%) 15 (100%) 0 (0%) 15
Quillota 9 (100%) - 9 (100%) 0 (0%) 9
San Antonio 10 (100%) - 10 (100%) 0 (0%) 10
San Felipe 8 (40%) 12 (60%) 20 (100%) 0 (0%) 20
Santiago 5 (56%) 4 (44%) 9 (100%) 0 (0%) 9
Talagante 5 (100%) - 4 (80%) 1 (20%) 5
Valparaiso 5 (100%) - 3 (60%) 2 (40%) 5
http://veterinariamexico.unam.mx 7/ 9
Spatial tools for high impact zoonosis surveillance
DOI: http://dx.doi.org/10.21753/vmoa.4.41.435 Vol. 4No. 1January-March2017
Short communication
surveillance programmes that will help to optimize time, human and budget re-sources for improving the quality of the programmes. The checking process be-comes very important at the time of planning field activities, increasing the chance of visiting places with BPSsthat are feasible to sample.
Conclusions
Normally, both surveillance and research activities have time and budget limitations, and thus, little information is known about BPSlocations and dynamics, affecting the development of survey or surveillance programmes. The proposed approach would allow for an increase in the efficiency of sampling and field activities, de-creasing the potential time spent and logistic resources used to locate a feasible sampling of BPSs compared to those needed for direct field inspection. More use-ful would be the generation of maps or census data with the specific locations of all BPSs in Chile.
Funding
Founded by FONDECYT 11121389 to CHW and CONICYT 21130159 to RA-M.
Acknowledgements
The authors acknowledge all in Epi-FAVET for their support of the field activities.
Conflicts of interest
The authors declare no conflicts of interest regarding this manuscript.
Author contributions
RA-M and CHW designed the study approach and drafted the manuscript. AL and SU helped with the revision of the manuscript. All authors have read and approved the final manuscript.
References
1. Conan A, Ponsich A, Luce Goutard F, Khiev R, Tarantola A, Sorn S, et al. A community-based education trial to improve backyard poultry biosecuri-ty in rural Cambodia. Acta Trop. 2013;125(3):294–302. doi: 10.1016/j. actatropica.2012.12.006.
2. Behravesh CB, Brinson D, Hopkins BA, Gomez TM. Backyard poultry flocks and salmonellosis: a recurring, yet preventable public health challenge. Clin Infect Dis. 2014;58(10):1432–8. doi: 10.1093/cid/ciu067.
5. Jones BA, Grace D, Kock R, Alonso S, Rushton J, Said MY, et al. Zoonosis emer-gence linked to agricultural intensification and environmental change. Proc Natl Acad Sci USA. 2013;110(21):8399–404. doi: 10.1073/pnas.1208059110. 6. Short KR, Richard M, Verhagen JH, van Riel D, Schrauwen EJA, van den Brand
JMA, et al. One health, multiple challenges: the inter-species transmission of in-fluenza A virus. One Health. 2015;1:1–13. doi: 10.1016/j.onehlt.2015.03.001. 7. Alexander DJ. A review of avian influenza in different bird species. Vet Microbiol.
2000;74(1–2):3–13. doi: 10.1016/S0378-1135(00)00160-7.
8. Zhu W, Shu Y. Genetic tuning of avian influenza A (H7N9) virus promotes vi-ral fitness within different species. Microbes Infect. 2015;17(2):118–22. doi: 10.1016/j.micinf.2014.11.010.
9. Nieto PA, Pardo-Roa C, Salazar-Echegarai FJ, Tobar HE, Coronado I, Riedel CA, et al. New insights about excisable pathogenicity islands in salmonella and their contribution to virulence. Microbes Infect. 2016;18(5):302–9. doi: 10.1016/j. micinf.2016.02.001.
10. Van Reeth K. Avian and swine influenza viruses: our current understanding of the zoonotic risk. Vet Res. 2007;38:243–60. doi: 10.1051/vetres:2006062. 11. Munster VJ, Baas C, Lexmond P, Waldenström J, Wallensten A, Fransson T, et
al. Spatial, temporal, and species variation in prevalence of influenza A virus-es in wild migratory birds. PLoS Pathog. 2007;3(5):e61. doi: 10.1371/journal. ppat.0030061.
12. Retamal P, Fresno M, Dougnac C, Gutierrez S, Gornall V, Vidal R, et al. Ge-netic and phenotypic evidence of the Salmonella enterica serotype Enteritidis human-animal interface in Chile. Front Microbiol. 2015;6:464. doi: 10.3389/ fmicb.2015.00464.
13. Bravo-Vasquez N, Di Pillo F, Lazo A, Jiménez-Bluhm P, Schultz-Cherry S, Ham-ilton-West C. Presence of influenza viruses in backyard poultry and swine in El Yali wetland, Chile. Prev Vet Med. 2016;134:211–5. doi: 10.1016/j. prevetmed.2016.10.004.
14. Pennycott TW, Park A, Mather HA. Isolation of different serovars of Salmonella enterica from wild birds in Great Britain between 1995 and 2003. Vet Rec. 2006;158(24):817–20. doi: 10.1136/vr.158.24.817.
15. Wiratsudakul A, Paul MC, Bicout DJ, Tiensin T, Triampo W, Chalvet-Monfray K. Modeling the dynamics of backyard chicken flows in traditional trade networks in Thailand: implications for surveillance and control of avian influenza. Trop Anim Health Prod. 2014;46(5):845–53. doi: 10.1007/s11250-014-0575-8. 16. Instituto Nacional de Estadísticas (INE). Censo Agropecuario. Santiago, Chile.
2007.
17. Dohoo R, Martin W, Stryhn H. Veterinary epidemiologic research. 2nd ed: Prince Edward Island, Canada: VER Inc.; 2010. 865 p.
18. Aronson J, Del Pozo A, Ovalle C, Avendaño J, Lavin A, Etienne M. Land use changes and conflicts in central Chile. In: Rundel PW, Montenegro G, Jaksic FM, editors. Landscape Disturbance and Biodiversity in Mediterranean-Type Ecosys-tems. Vol 136. Series Ecological Studies. Berlin, Heidelberg New York: Springer; 1998. p. 155–68.
http://veterinariamexico.unam.mx 9/ 9
Spatial tools for high impact zoonosis surveillance
DOI: http://dx.doi.org/10.21753/vmoa.4.41.435 Vol. 4No. 1January-March2017
Short communication
chilean mid-cities: the case of Los Angeles, central Chile. Land Use Policy. 2007;24(1):199–211. doi: 10.1016/j.landusepol.2005.04.003.
20. Bamberger M, Rugh J, Church M, Fort L. Shoestring evaluation: designing impact evaluations under budget, time and data constraints. Am J Eval. 2004;25(1):5– 37. doi: 10.1177/109821400402500102.
21. Salman M, editor. Animal disease surveillance and survey systems: methods and applications. Wiley-Blackwell; 2003. 222 p.
22. Ferguson JM, Langebrake JB, Cannataro VL, Garcia AJ, Hamman EA, Martche-va M, et al. Optimal sampling strategies for detecting zoonotic disease epi-demics. PLoS Comput Biol. 2014;10(6):e1003668. doi: 10.1371/journal. pcbi.1003668.
23. Saththasivam P, Voralu K, Ramli N, Mustapha MR, Omar J, Van Rostenberghe H. The effect of delayed transportation of blood samples on serum bilirubin values in neonates. Malays J Med Sci. 2010;17(3):27–31.
24. Hamilton-West C, Rojas H, Pinto J, Orozco J, Hervé-Claude LP, Urcelay S. Charac-terization of backyard poultry production systems and disease risk in the central zone of Chile. Res Vet Sci. 2012;93(1):121–4. doi: 10.1016/j.rvsc.2011.06.015. 25. Gonzales JL, Boender GJ, Elbers ARW, Stegeman JA, de Koeijer AA. Risk
based surveillance for early detection of low pathogenic avian influenza out-breaks in layer chickens. Prev Vet Med. 2014;117(1):251–9. doi: 10.1016/j. prevetmed.2014.08.015.
26. Martin PAJ, Langstaff I, Iglesias RM, East IJ, Sergeant ESG, Garner MG. Assess-ing the efficacy of general surveillance for detection of incursions of livestock diseases in Australia. Prev Vet Med. 2015;121(3–4):215–30. doi: 10.1016/j. prevetmed.2015.06.017.