SERIE DOCUMENTOS DE TRABAJO
No. 107
Agosto 2011
DYNAMIC CONDITIONAL CORRELATION IN LATIN-AMERICAN ASSET
MARKETS
Dynamic Conditional Correlation in Latin-American Asset markets
Constanza Martínez Facultad de Economía Universidad del Rosario, Colombia
Manuel Ramirez Facultad de Economía Universidad del Rosario, Colombia [email protected]
Abstract
In this paper we reviewed the models of volatility for a group of five Latin
American countries, mainly motivated by the recent periods of financial
turbulence. Our results based on high frequency data suggest that Dynamic
multivariate models are more powerful to study the volatilities of asset
returns than Constant Conditional Correlation models. For the group of
countries included, we identified that domestic volatilities of asset markets
have been increasing; but the co-volatility of the region is still moderate.
1. Introduction
The volatility of returns is the main criterion used to take investment decisions, since
is the simplest approximation to quantify the riskiness of an asset. But, this measure of
returns variation is not directly observable in the markets, which imply that those interested
in composing portfolios or studying the markets of assets have to quantify the observed
levels of volatility and forecast their expected ranks. The measures of volatility have a
dependence of correlation, whose computations and results are tied to the explicit
assumptions concerning the statistical properties of returns. Under classical assumptions,
the standard measures of volatility usually underestimate the observed and expected
variations of returns during periods of financial stress.
The ever increasing relations of capital markets among countries and the recent
periods of financial turbulence have warned about the necessity of improving the
procedures used to measure the volatility, in order to properly quantify the transmission of
shocks. But the estimation of the variations of the expected returns also require of measures
2
From a quantitative standpoint, the estimations of volatility require of a positive
definite matrix of returns correlations; since this condition guarantees that variances are
strictly positives. This quantitative condition and that related to the estimation of volatility
in an integrated system are both adequately captured by Multivariate GARCH models. This
class of models might be classified into three groups. The first group is composed by
models BEKK, VEC, and Factor models; and represents direct generalizations of univariate
GARCH. The second group is based on linear combinations of univariate GARCH, and the
third group by non linear combinations. This last group is represented by the model of
Constant Conditional Correlation (Bollerslev, 1990) and the Dynamic Conditional
Correlation model (Engle 2002, and Tse and Tsui 2002).
Amongst the broad range of multivariate models of volatility, the Dynamic
Conditional Correlation is perhaps the most suitable class of model to assess estimations on
financial data, since the correlations between the asset returns usually display time
dependence. By this same reason, the Constant Conditional Correlation model could
produce biased estimations of volatility, across time as well as across asset markets.
Dynamic Conditional Correlation (DCC) models have been used to study the crisis of
the asset markets in Asia during 1998 (Tse and Tsui 2002, and Chiang, Jeon and Li 2007).
From different perspectives, these studies coincided in that the conditional correlations
increased during the crisis, and that asset markets were seriously affected by financial
contagion. The systemic risk at that time caused strong reductions in the benefits from the
diversification across countries of the same region, deepening even more the negative
effects of the crisis.
The asset markets in Latin-America have also been impacted by different crises and
shocks in the last two decades. According to some studies for the 1990’s the evidence of
financial contagion is weak, since the adoption of temporary policy measures in some
countries and the underdevelopment of their market structures could have impeded that the
returns in asset markets were more affected by shocks (Reinhart and Calvo 1996, Forbes
and Rigobon 1999, and Martínez and Ramirez 2009). However, the sensitivity of these
markets has been increasing, presumably by the strengthening in the financial and
3
We used the multivariate DCC GARCH model to construct a comprehensive
framework that allowed testing the volatility spillovers across Latin-American markets of
equities and exchange rate. Our results suggest that despite that the volatility of domestic
asset markets have been increasing, the co-volatility of the region is still moderate.
This paper is organized into three sections, additional to this Introduction. In Section
2 we presented the estimating procedure of DCC models. Section 3 contains a brief
statistical analysis of data, and the main results from the multivariate models. Finally, we
proposed a set of broad conclusions regarding the observed volatility of Latin-American
asset markets, in Section 4.
2. The Dynamic Conditional Correlation model
Multivariate GARCH models, composed by non linear combinations of univariate
GARCH, strongly depend on the definition of the matrix of conditional correlations. Under
the assumption of correlations independent of time (R) the models of Constant Conditional
Correlations (CCC) allows a straightforward computation of the correlation matrix. But, if
correlations vary over time , the models of Dynamic Conditional Correlations (DCC)
(Engle 2002, and Tse and Tsui 2002), are more appropriate to compute the returns
variations. For high frequency data, DCC models are preferred over CCC since their
structure allow an adequate estimation of the continuous changes in correlations, and also
because DCC are more parsimonious than other multivariate GARCH models.
According to Engle (2002) the covariance matrix in a DCC model requires that:
= 1
H and R be both positive definite with probability of one, to avoid that linear
dependencies on asset returns may produce variances negative or equal to zero. In equation
(1) the matrix of variance is given by = .
DCC models are estimated in two stages. The first entails the selection of appropriate
4
adjust the residuals , = ,
,
1. This stage is characterized by its flexibility, since any
univariate GARCH model can be used to estimate the individual volatility.
In the second stage the multivariate model is estimated based on the suitable dynamic
quasi-correlation matrix . For temporary stochastic processes with mean reverting
changes in correlations (like those observed in asset returns) the matrix is defined by:
= 1 − − ! + #$ #$% + ! #$ 2
The ' × ' covariance matrix of is given by = )* %+; and positive definiteness
of the quasi-correlation matrix requires that the parameters α, β and (1-α-β) be all positive.
Alternative approaches for processes with unit root and asymmetric adjustments are
provided by the Integrated DCC and Asymmetric DCC version models, respectively.
Lastly the Mean Reverting DCC approach requires the re-escalation of the matrix
in order to guarantee that all the elements in the diagonal be equal to one. This stage
finally leads us to the conditional correlation matrix, explained by the following equation:
= #$, #$, 3
Where #$, = .1 /
$$,
0 , … , 1 /0 22, 3
Assuming that asset returns are multivariate normal, this approach permits the
maximization of the log-likelihood function:
ℓ 5, 6 = 7−12 8 '9: 2; + 29: | | + =% # = >
?$
@
+ 7−12 8 9: | | + % #$ − % >
?$
@ 4
1
5
In which the parameters in (5 and (6 are estimated simultaneously. The
separate estimation of the volatility (first part of the equation) and the correlation
component (the remaining part) is computationally easier than the simultaneous
maximization. However, this separate estimation alternative represents limited information
parameters that are not fully efficient. Besides, the maximization of the function requires of
further assumptions on the data generating process, given that the multivariate density of
returns usually differs from the Gaussian density. According to Bollerslev and Wooldridge
(1992), consistent pseudo maximum likelihood estimators of equation (4) could be obtained
under the correct specification of the conditional mean and variance equations.
3. Data and Results
For the estimating procedure we used daily observations of the Stock Exchange index
and the nominal Exchange rate, of Brazil, Chile, Colombia, Mexico and Peru. Our data
consists of closing quotes, from July 4th of 2001 to May 5th of 2011; which represents 2567
observations per market. As usual, the differences across countries in the number of
observations resulting from holidays were solved reproducing the data observed in the
previous trading day.
Graph 1 Exchange rate and Stock Exchange data, 2001-2011
Brazil_currency
2002 2004 2006 2008 2010 2012 2
4
Brazil_currency
Chile_currency
2002 2004 2006 2008 2010 2012 500
700
Chile_currency Colombia_currency
2002 2004 2006 2008 2010 2012 2000
3000
Colombia_currency
Mexico_currency
2002 2004 2006 2008 2010 2012 10
15 Mexico_currency
Peru_currency
2002 2004 2006 2008 2010 2012 3.0
3.5
Peru_currency Brazil_equities
2002 2004 2006 2008 2010 2012 25000
75000
Brazil_equities
Chile_equities
2002 2004 2006 2008 2010 2012 2000
6000
Chile_equities Colombia_equities
2002 2004 2006 2008 2010 2012 5000
15000 Colombia_equities
Mexico_equities
2002 2004 2006 2008 2010 2012 10000
30000 Mexico_equities
Peru_equities
2002 2004 2006 2008 2010 2012 10000
6
All of these countries experienced increasing trends in the markets of equities in the
mid of 2000 that became even more pronounced a year later, presumably by the investors’
expectations of further capital gains based on the increasing commodity prices at that time.
The United Nations document of Capital flows shows that the annual growth rates of equity
prices in Latin-American markets at the end of 2007 were outstanding in Peru (86%) and
Brazil (75.3%); and moderate but still remarkable in Chile (20.8%) and Colombia
(12.64%). These bullish markets lasted until late 2008 when the sub-prime bubble in U.S
exploded, prompting the most recent global financial crisis. In Latin-America the effects of
this crisis were rapidly absorbed by the markets of assets, and in some cases like Brazil and
Colombia, were accompanied by temporary capital controls measures.
For the same years, the dynamics of the currency markets tells a different story. In
Brazil, Chile, Colombia and Peru the nominal exchange rates exhibited increasing trends
that reached a peak in 2003, when the quotations of the U.S dollar in terms of the domestic
currency exhibited strong revaluations. This downward trend in domestic currencies was
enlarged during the global financial crisis of 2008-2009; which coincided with considerable
increments in the capital inflows received by these countries (Table 1). The revaluation
trend of the currencies of Brazil, Colombia and Peru was partially stopped by means of
governments interventions in the exchange rate markets (Edwards, 2011). However, the
[image:7.612.115.478.515.593.2]downward trends continued forming bearish markets, still present nowadays.
Table 1 Capital inflows (Millions of dollars)
Despite of the differences in the long term trends of the markets of equities and
currencies, in the mid of 2008 the returns of both markets experienced similar clusters of
volatility. In the graphs presented below we identified two features that describe the
markets dynamics at that time. First, within the group, the strongest changes in the asset
2005 2006 2007 2008 2009
Brazil 13,807 16,299 89,086 29,352 70,551 Chile 1,591 -4,202 -10,223 7,329 -2,455 Colombia 3,236 2,890 10,347 9,492 6,359 Mexico 17,360 667 21,352 26,952 16,153 Peru -99 718 8,330 8,609 970 Correspond to the summation of the Balances of Capital and Financial Accounts
7
returns were observed in Brazil, Chile and Mexico. And second, the volatility for the
markets of equities was leaded by Brazil; while for the markets of currencies this role was
played by Peru.
Graph 2 Returns of Exchange rate and Stock Exchange data
Calculations of the authors
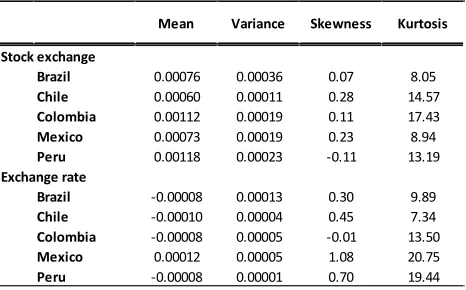
An initial look at the distributional properties of data suggests that all series strongly
differ from the standard normal. The descriptive statistics presented in Table 2 reveal that
the unconditional distributions of the returns are skewed, besides displaying considerable
excess of kurtosis. This last feature is especially strong in the Stock exchange and
[image:8.612.191.424.543.688.2]Exchange rate markets of Colombia and Peru.
Table 2- Summary Statistics of Data
Calculations of the authors
Brazil_equities
2002 2004 2006 2008 2010 2012 -0.1
0.1 Brazil_equities
Chile_equities
2002 2004 2006 2008 2010 2012 0.0
0.1 Chile_equities
Colombia_equities
2002 2004 2006 2008 2010 2012 -0.1
0.1 Colombia_equities
Mexico_equities
2002 2004 2006 2008 2010 2012 0.0
0.1 Mexico_equities Peru_equities
2002 2004 2006 2008 2010 2012 -0.1
0.1 Peru_equities
Brazil_currency
2002 2004 2006 2008 2010 2012 -0.05
0.05 Brazil_currency
Chile_currency
2002 2004 2006 2008 2010 2012 -0.025
0.025 Chile_currency
Colombia_currency
2002 2004 2006 2008 2010 2012 -0.05
0.05
Colombia_currency
Mexico_currency
2002 2004 2006 2008 2010 2012 -0.05
0.05 Mexico_currency Peru_currency
2002 2004 2006 2008 2010 2012 -0.02
0.02 Peru_currency
Mean Variance Skewness Kurtosis
Stock exchange
Brazil 0.00076 0.00036 0.07 8.05
Chile 0.00060 0.00011 0.28 14.57
Colombia 0.00112 0.00019 0.11 17.43
Mexico 0.00073 0.00019 0.23 8.94
Peru 0.00118 0.00023 -0.11 13.19
Exchange rate
Brazil -0.00008 0.00013 0.30 9.89
Chile -0.00010 0.00004 0.45 7.34
Colombia -0.00008 0.00005 -0.01 13.50
Mexico 0.00012 0.00005 1.08 20.75
8
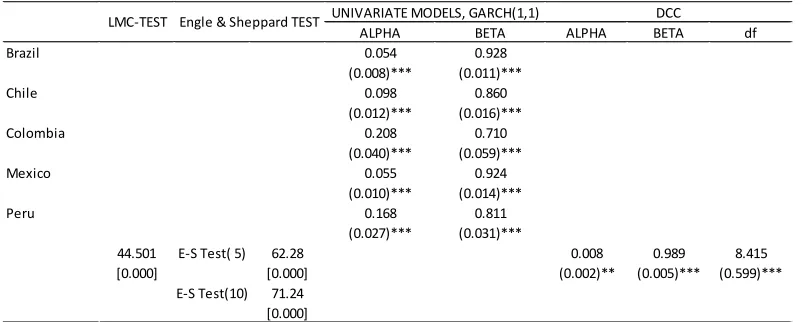
Consistently with both characteristics, in all our estimations we assumed a
multivariate Student t distribution; which represented the degrees of freedom as an extra
parameter (df) that indicates the number of statistical moments in the multivariate
distribution. Since all of the estimated df parameters exceeded the value of four, is
evidently that fourth order moments exist. In Tables 3 and 4 we present our DCC results for
Stock Exchange and Exchange rate data, respectively. Previously we evaluated the
existence of constant conditional correlation in the asset returns; and both, the tests of LMC
and Engle and Sheppard (2001), rejected this assumption. Besides, our estimated
parameters are consistent and efficient, since they were obtained from the simultaneous
maximization of the components of volatility and correlation.
The results for the markets of equities are based on univariate GARCH (1, 1), with
constant in the Mean and Variance equations. All our results are significant at traditional
levels, besides satisfying the expected conditions in terms of strictly positive variances.
This condition requires that the quasi-correlation matrix be positive definite, which in our
[image:9.612.108.512.446.607.2]results of the multivariate GARCH is satisfied with positives α, β and (1-α-β) parameters.
Table 3- Stock Exchange markets
The univariate models presented in Table 3, evidence a high persistency in volatility
since in all estimations the summations of the parameters alpha and beta are very close to
the unity. Per country, the highest volatility persistency is observed in the Brazilian market
ALPHA BETA ALPHA BETA df
Brazil 0.054 0.928
(0.008)*** (0.011)***
Chile 0.098 0.860
(0.012)*** (0.016)***
Colombia 0.208 0.710
(0.040)*** (0.059)***
Mexico 0.055 0.924
(0.010)*** (0.014)***
Peru 0.168 0.811
(0.027)*** (0.031)***
44.501 E-S Test( 5) 62.28 0.008 0.989 8.415
[0.000] [0.000] (0.002)** (0.005)*** (0.599)***
E-S Test(10) 71.24 [0.000] Calculations of the authors
LMC and Engle-Sheppard statistics test under the null of Constant Conditional Correlations of returns. Significant at 1% (***) , 5% (**) and 10% (*) respectively. Standard errors in parenthesis.
9
(0.98), while the lowest is particular to Colombia (0.92). These differences in the sensitivity
may be attributed to the size of the markets, and the amount of foreign capital involved in
the transactions. Likewise, the estimated parameters in the multivariate DCC GARCH also
display a high persistency of deviations from the unconditional level.
The pair-wise conditional correlations, in Graph 3, exhibit upward trends in 2006,
followed four years later by strong and sustained downward trends. This asymmetric
response in equity markets may come from increases in the conditional covariance,
originated by negative shocks in asset returns.
Graph 3- Conditional correlations among Stock Exchange markets
Calculations of the authors
For the markets of exchange rate we adjusted univariate integrated GARCH (1, 1)
models, with a constant in the equation of the mean. The results of these models of unitary
persistency indentify that Peru (12%) and Colombia (10.7%) strongly react to shocks , but
when considering the entire group of countries, the reaction though remains significant, is
extremely small(0.8%).
CORR_Bra_equities_Chi_equities
2002 2004 2006 2008 2010 2012
0.2
0.6 CORR_Bra_equities_Chi_equities CORR_Bra_equities_Col_equities
2002 2004 2006 2008 2010 2012
0.2
0.4 CORR_Bra_equities_Col_equities
CORR_Bra_equities_Mex_equities
2002 2004 2006 2008 2010 2012
0.5
0.7 CORR_Bra_equities_Mex_equities CORR_Bra_equities_Per_equities
2002 2004 2006 2008 2010 2012
0.2
0.6 CORR_Bra_equities_Per_equities
CORR_Chi_equities_Col_equities
2002 2004 2006 2008 2010 2012
0.0
0.4 CORR_Chi_equities_Col_equities CORR_Chi_equities_Mex_equities
2002 2004 2006 2008 2010 2012
0.4
0.6 CORR_Chi_equities_Mex_equities
CORR_Chi_equities_Per_equities
2002 2004 2006 2008 2010 2012
0.2
0.6 CORR_Chi_equities_Per_equities CORR_Col_equities_Mex_equities
2002 2004 2006 2008 2010 2012
0.0
0.4 CORR_Col_equities_Mex_equities
CORR_Col_equities_Per_equities
2002 2004 2006 2008 2010 2012
0.2
0.4 CORR_Col_equities_Per_equities CORR_Mex_equities_Per_equities
2002 2004 2006 2008 2010 2012
0.2
10
Table 4- Exchange rate markets
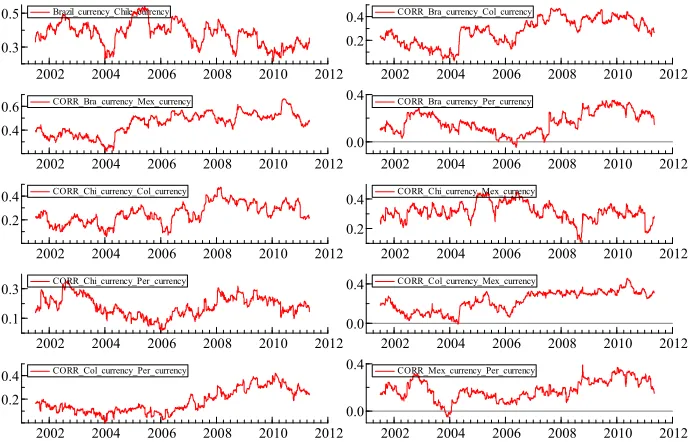
The pair-wise conditional correlations between the exchange rate markets of Brazil,
Colombia, Mexico and Peru are above the average level since 2004, exhibiting an upward
shift that might be suggesting that markets are more closely integrated.
Graph 4 -Conditional correlations among Exchange rate markets
Calculations of the authors
UNIVARIATE, IGARCH
ALPHA ALPHA BETA df
Brazil 0.069 (0.08)*** Chile 0.052 (0.01)*** Colombia 0.107 (0.013)*** Mexico 0.045 (0.045)*** Peru 0.120 (0.019)***
34.42 E-S Test( 5) 90.08 0.008 0.988 7.36
[0.000] [0.000] (0.002)*** (0.003)*** (0.378)***
E-S Test(10) 106.37 [0.000] Calculations of the authors
LMC and Engle-Sheppard statistics test under the null of Constant Conditional Correlations of returns. Significant at 1% (***) , 5% (**) and 10% (*) respectively. Standard errors in parenthesis.
Engle & Sheppard TEST
LMC-TEST DCC
Brazil_currency_Chile_currency
2002 2004 2006 2008 2010 2012
0.3
0.5 Brazil_currency_Chile_currency CORR_Bra_currency_Col_currency
2002 2004 2006 2008 2010 2012
0.2
0.4 CORR_Bra_currency_Col_currency
CORR_Bra_currency_Mex_currency
2002 2004 2006 2008 2010 2012
0.4
0.6 CORR_Bra_currency_Mex_currency CORR_Bra_currency_Per_currency
2002 2004 2006 2008 2010 2012
0.0
0.4 CORR_Bra_currency_Per_currency
CORR_Chi_currency_Col_currency
2002 2004 2006 2008 2010 2012
0.2
0.4 CORR_Chi_currency_Col_currency CORR_Chi_currency_Mex_currency
2002 2004 2006 2008 2010 2012
0.2
0.4 CORR_Chi_currency_Mex_currency
CORR_Chi_currency_Per_currency
2002 2004 2006 2008 2010 2012
0.1
0.3 CORR_Chi_currency_Per_currency CORR_Col_currency_Mex_currency
2002 2004 2006 2008 2010 2012
0.0
0.4 CORR_Col_currency_Mex_currency
CORR_Col_currency_Per_currency
2002 2004 2006 2008 2010 2012
0.2
0.4 CORR_Col_currency_Per_currency CORR_Mex_currency_Per_currency
2002 2004 2006 2008 2010 2012
0.0
11
Consistently with the analysis of data, our empirical results suggest the presence of
bears in the markets of exchange rate; since the conditional correlations on large negative
returns have been increasing since 2006, especially for Brazil, Colombia and Peru.
4. Conclusions
In this paper we extended the analysis of Latin- American asset returns to a multivariate
dimension, by means of multivariate GARCH models, given that their structure allows
measure variations in the asset returns of the region. The high frequency data usually
exhibit strong dependence of time, which invalidate the models of Constant Conditional
Correlation as a proper mean to estimate volatilities of returns. Our empirical results for the
entire region, based on DCC models allowed us identified a moderate reaction to shocks
with high persistency, suggesting a long term memory of asset markets. The conditional
correlations and volatilities exhibited different trends among markets since the mid of 2005.
The stock exchange markets exhibited bullish trends, while the markets of currencies in
terms of the U.S dollar revealed bearish trends. However, for the mid of 2008 and
coinciding with the U.S housing crisis, we identified some clusters of volatility for the
markets of equities as well as for the exchange rate markets.
According to our results, the volatility reactions differ among countries, and they were
especially strong in Brazil, Peru and Mexico. For the group of countries included in our
models, we noticed that Brazil leads the reactions in the markets of equities, while Peru fills
this role in the exchange rate markets.
References
Alexander C. (2002) “Principal Component models for generating large GARCH covariance matrices” Economic Notes 23
Alexander C. (2008) “Market Risk Analysis” Vol I, Quantitative Methods in Finance
12
Bollerslev T., and Wooldridge J.M. (1992) “Quasi Maximum Likelihood estimation and inference in dynamic models with time varying covariances”. Econometric Reviews 11
Chiang T., Jeon B., and Li H. (2007) “Dynamic correlation analysis of financial contagion: Evidence from Asian markets”. Journal of International Money and Finance 26
Edwards S. (2001) “Exchange rate in emerging countries: eleven empirical regularities from Latin-America and East Asia” NBER Working paper 17047
Engle R. (2002) “Dynamic Conditional Correlations: a simple class of multivariate generalized autoregressive conditional heteroskedasticity models” Journal of Business and Economic Statistics 20
Engle R. (2009) “Anticipating Correlations: A new Paradigm for Risk Management” Princeton University Press
Engle R., and Sheppard K. (2001) “Theoretical and empirical properties of Dynamic Conditional Correlation Multivariate GARCH”, NBER Working Paper 8554
Forbes K. and Rigobon R. (1999) “No Contagion only interdependence: Measuring Stock Market Co-Movements” NBER Working paper 7267
Martínez C., and Ramirez M. (2009) “International Propagation of Shocks: An evaluation of Contagion Effects for some Latin American countries” Documentos de trabajo No. 71, Facultad de Economía, Universidad del Rosario
Reinhart C., and Calvo S. (1996) “Capital flows to Latin-America: Is There Evidence of Contagion Effects” MPRA No. 7124
Silvennoinen A., and Terasvirta T. (2008) “Multivariate GARCH models”, Handbook of Financial Time Series, Springer
Tse Y. (2000) “A Test for Constant Correlations in a Multivariate GARCH Model”, Journal of Econometrics 98
Tse Y., and Tsui A. (2002) “A Multivariate Generalized Autoregressive Conditional Heteroscedasticity Model with Time Varying Correlations, Journal of Business and Economic Statistics, Vol. 20