Gross Inequality and Inequality of Opportunities in Basic Education:
Were they affected by Latin America’s Economic Boom?
Natalia Krüger
Luis Fernando Gamboa
Fábio Waltenberg
SERIE DOCUMENTOS DE TRABAJO
No. 173
1
Gross Inequality and Inequality of Opportunities in Basic Education:
Were they affected
y Lati A eri a’s E
conomic Boom?
Natalia Krüger*
Luis Fernando Gamboa**
Fábio Waltenberg***
Nov 2014
Abstract
In the context of economic growth and recovering socio-economic conditions, many Latin American countries have implemented deep educational reforms since the beginning of the century. This paper aims to analyse whether these changes have promoted equality of educational opportunities in the region. Both the access and knowledge and skills dimensions are evaluated for six important countries, deepening the analysis for Argentina, Brazil and Colombia, in order to better understand the trends observed. Results point to reasonable progress in access, but reflect an unsatisfactory evolution of the level and distribution of knowledge and skills –as reflected by PISA test scores–.
Keywords: education, equality of opportunities, Latin America, PISA. JEL: I24, O54, C78
*
Assistant Professor at the Department of Economics, Universidad Nacional del Sur, and researcher at IIESS (UNS-CONICET), Argentina. E-mail: [email protected]. The author thanks CONICET-PIP 11220110100363 for research support.
**
Associate Professor at the Department of Economics, Universidad del Rosario, Colombia. E-mail:
[email protected]. The author thanks Capes, which funded a 3-month stay at Universidade Federal Fluminense
i B azil ea s of the g a t Professor Visitante do Exterior 2012.
***
2 Introduction
During the previous decade, many Latin American countries have experienced a rare moment of
reduction of income inequality and poverty levels, partly due to economic growth boosted by the
rise of global prices of commodities and favourable exchange rates, partly due to policy choices such
as deliberate rises of minimum wages or the implementation and expansion of conditional cash
transfer schemes. But it is not clear what the actual impact of these important economic
phenomena and policies has been on structural sources of inequality such as education.
Pertaining to a liberal-egalitarian stream of theories of justice, the so- alled equality of
opportunity approach Roemer (1998) considers that the less a given outcome correlates with
individual circumstances –that is, with features beyond individual control, such as parental
characteristics or skin colour– the closer we are from a situation of equal opportunities. If we take
equality of educational opportunities (EEOp) as a reasonable normative goal, can we say Latin
American countries have moved closer to achieving it over the last few years?
In this study, we first describe and analyse the evolution of EEOp in Latin America since the
beginning of the century. More specifically, we investigate what happened in terms of: (i) access to
different levels of basic education (Section 2), and (ii) knowledge and skills acquired by students, as
reflected by test scores (Section 3). Data regarding access has been gathered from international
reports and national household surveys. Test scores and their covariates have been taken from
different waves of OECD´s (Organisation for Economic Co-operation and Development) PISA
(Programme for International Student Assessment) exams and reports. Regarding both access and
achievement, we focus on six Latin-American countries which are important for a number of reasons
(e.g., per capita income, development level, population size) and which have participated in most of
PISA exams, namely: Argentina, Brazil, Chile, Colombia, Mexico, and Uruguay. Occasionally, we
compare them with Spain and Portugal, developed countries which notwithstanding share many
3 The descriptive sections of the paper reveal substantial, albeit insufficient, advances in access,
and only very modest, in some cases inexistent, progresses regarding knowledge and skills. To
understand these trends we deepen the analysis of three important and contrasted countries:
Argentina (Section 4), Brazil (Section 5), and Colombia (Section 6). Taken together, they host around
half the population of Latin America and produce more than half of its riches. While socio-economic
indicators from countries like Uruguay and Chile are similar to Argentina, Mexico´s resemble those
of Brazil or Colombia. For example, taking the Human Development Index as a rough synthetic
measure of development level, we can see that in 2012 Argentina with 0.811 (45th highest in the
world), Chile (0.819; 40th) and Uruguay (0.792; 51st) are similar and stand clearly above Brazil (0.730;
85th), Colombia (0.719; 91st) or Mexico (0.775; 61st). Among the contrasts, we could mention the
political evolution: while centre-left coalitions governed Brazil and Argentina for most of the past
decade, in Colombia the centre-right has been in power.
In order to try and explain these countries´ EEOp trajectories along the period 2000-2012, we
focus on the availability and distribution of essential educational inputs, as well as the policies
implemented. We also speculate on the possible links between the economic phenomena and
policies mentioned in the first paragraph and the trajectory of educational outcomes.
As a preview of our main results, we could say that in each country the evolution of the set of
indicators analysed has been different, not only because of different policy choices but also because
of different points of departure. An overall picture emerges though, according to which while some
groups still lag behind in terms of progression and completion, there have been reasonable
improvements in the access dimension in the previous decade. Nonetheless, the evolution of
knowledge and skills could be described as disappointing, since not only are they on average far
below an acceptable level, but also, a pupil´s outcome remains to a large extent predetermined by
4 We end up in Section 7 summarising our cross-country analysis, emphasising common patterns
and differences between the countries, as well as the main challenges they face in the following
years.
Equality of opportunity in access (2000-2012): considerable, but insufficient, improvement
In 2008, the Latin American Ministers of Education, gathered in the city of San Salvador, agreed to
support the Education Goals for 2021, establishing the achievement of educational equality as a
priority. This included guaranteeing universal access and completion of the primary and lower
secondary school levels, as well as increasing access and graduation at the upper secondary level
(OEI, 2010).
Although this agreement involved the setting of common goals and cooperative actions, each
country was free to adapt them to their particular socio-economic and educational reality. This
flexibility acknowledged the different obstacles confronted by each system when striving for
educational equality. In some cases, inequality is stronger regarding access to the primary or
secondary school levels. In others, it translates into different trajectories in terms of late entry,
repetition, and dropout. Finally, skills and knowledge may be unequally distributed.
In this section, a series of educational statistics are presented, allowing us to analyse how far
away six Latin American countries stood from the goal of equality of opportunity in terms of access
and completion in the year 2000, and how much closer they were by the year 20121.
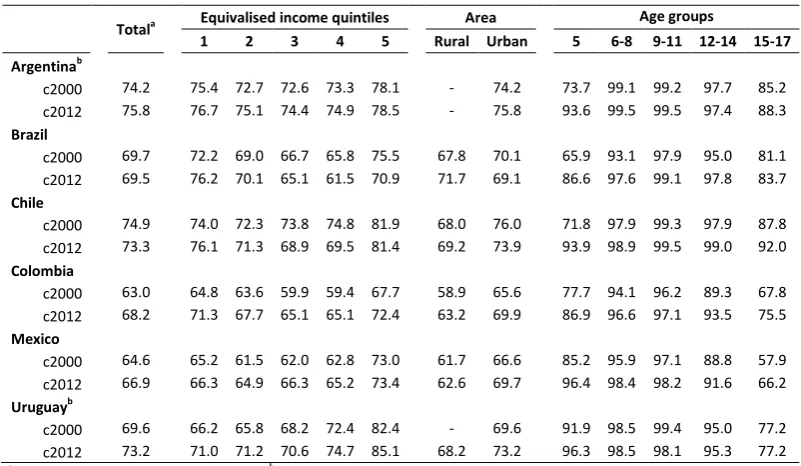
During this period, the region has made some progress towards increasing educational inclusion,
interpreted as attendance to a formal institution during compulsory school age (Table 1). Coverage
at the primary and lower-secondary school levels has been almost universal since the beginning of
the century, and growth in overall attendance rates has recently declined. This has led to a
generalised concern over the possibility of the end of educational expansion (SITEAL, 2010).
1
It should be noted that the information available for Argentina corresponds only to urban areas, which may lead to an
5 However, children now enter the system earlier, and stay in school longer, since attendance rates at
the pre-primary and upper-secondary school age have especially grown during the period. Most of
the five-year-old population (over 85 %) currently attends school in the six countries of interest. As
for those in the oldest age group, progress in enrolment has been modest in Argentina, Brazil and
Uruguay, but important in Chile, Colombia, and Mexico. Still, relevant gaps remain between these
countries: while Chile and Argentina present rates close to 90 %, for example, Mexico lags behind
with 66 %. Also, although inequalities within each country have been slightly reduced, some
differences by income and geographical location are still evident, especially in Uruguay, Mexico, and
Chile.
<TABLE 1>
The ongoing expansion in enrolment during the past decades has allowed educational mobility to
grow, resulting in a more diverse student population. Schools have had to learn to cater to the needs
of pupils from different socio-economic contexts, which in many cases, has translated into subtler
and more challenging problems, such as retaining students until graduation and ensuring an
adequate progression.
The share of students who lag behind by more than two years indicates the presence of grade
repetition, absenteeism or late entry. Table 2 shows that most countries have reduced this indicator
at the primary level, which is, with the exception of Colombia, currently close-to or under 10 %. At
the secondary level, however, this problem tends to be more relevant, as difficulties accumulate
along the years. Although comparisons between countries are risky –because the requisites for
completing each level may differ–, Argentina, Colombia, and Uruguay seem to have the greatest
problems in guaranteeing school progression at this stage. In these countries, the proportion of
overage students has actually risen during the period, reaching values close to 30 %.
From an EEOp perspective, there are evident shortcomings, such as gaps by gender,
socio-economic level, or geographical location. In most countries, boys, students in the lowest income
6 gaps have only been slightly reduced in some systems, they have broadened in Brazil and Chile (at
the secondary level), and in Mexico and Uruguay (at the primary level).
<TABLE 2>
It is also of interest to evaluate how these high levels of access to basic education translate into
higher qualifications for the population. According to Table 3, Argentina, Chile, and Uruguay occupy
the best position regarding the completion of primary school. Only around 2 % of the population
aged 15 to 24 years had not finished this level by 2012. Mexico followed with 5 %, and finally,
Colombia and Brazil presented values close to 10 %.
As for graduation from secondary school by the 20-24 year-old population, the countries may be
grouped in pairs: Brazil and Chile lead with about 35 % of graduates; Argentina and Colombia follow
with 22 %; and Mexico and Uruguay lag behind with less than 10 %. Total levels of completion have
not improved greatly during the past 12 years, and the large gaps between attendance and
completion rates indicate important levels of dropout. Also, despite a moderate reduction,
differences by gender and geographical location remain relevant in some cases.
<TABLE 3>
The quantity of education acquired by the population is the focus of another Educational Goal for
2021: to guarantee that the new generations have access to 12 years of instruction. This is
considered the minimum amount required to gain the skills and knowledge currently needed to fully
participate in society. In this respect, Argentina and Chile lead the ranking with an average amount
of education close to 11 years, followed by Uruguay, Mexico, Colombia and finally, Brazil (Table 4).
The number of years completed has grown by one in most countries since the year 2000; and total
inequality, measured by the Gini coefficient, has dropped considerably.
<TABLE 4>
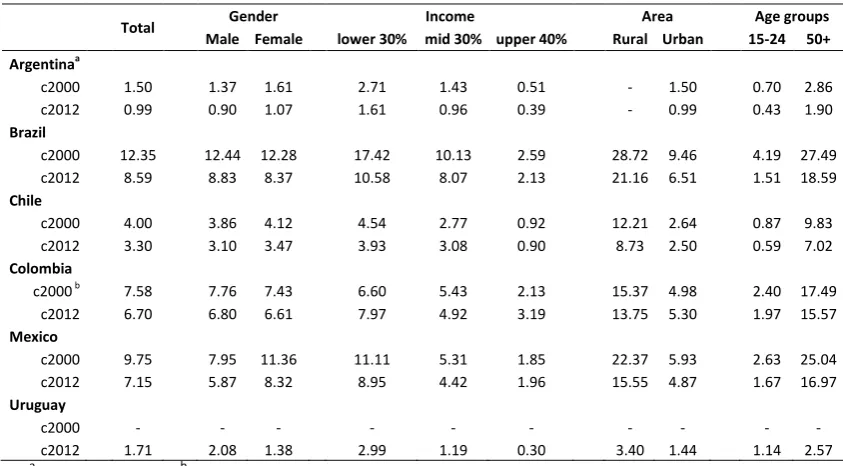
Finally, Table 5 presents the evolution of the problem of illiteracy, which constitutes a violation to
7 eradicating it, although they have made great progress during the last decade. Gaps by area of
residence are still relevant, and seem to be more important than gender differences. Also, as
expected, older people have had less access to reading and writing than those in the youngest age
groups, who have been targeted by more recent policies.
<TABLE 5>
In summary, it may be concluded that Latin America continues to advance in the expansion and
equity of access to education. Since the year 2000, attendance rates have steadily grown for all
school levels, and access gaps by area of residence or socio-economic status have decreased.
Nonetheless, small but relevant fractions of the population in each country remain excluded. Also,
the problems of school lag and low graduation rates, especially at the secondary level, seem to have
become even more significant. This indicates a possible trade-off between inclusion into the system
and the capacity to deal with the recently-included pupils.
Furthermore, gender, income, and geographical location are still relevant factors of inequality in
most countries. In general, boys, children from low income families and rural residents are at a
disadvantage. This applies especially to the quality of educational trajectories, considering
progression and completion issues. It is worth evaluating then, whether former inequalities of access
have been transformed into inequalities of attainment and achievement, where the main challenges
8
Equality of opportunity in knowledge and skills (2000-2012): a disappointing evolution
In this section our analysis focuses on test scores –their average and distribution– as a proxy for
education quality. We first observe average scores in PISA exams, which have been applied every
three years since 2000. In 2012, the last round, the sample consisted of 510 thousand students
representing around 28 million pupils from 65 countries.2 Argentina, Brazil, Chile, and Mexico have
participated from the beginning of the programme, whereas information regarding Uruguay and
Colombia is available from 2006 onwards. We have restricted our focus to Mathematics scores.
Average scores might be viewed as a relevant dimension of educational opportunities, since they
reflect the prospects for acquiring important skills and knowledge an average pupil has in a given
country in a particular moment. As compared to OECD countries´ scores, whose average is around
500, average scores obtained by pupils from Latin America, shown in Panel A in Table 6, are
systematically much lower, all of them below 400 in 2000, and ranging from 376 to 423 in 2012.
While improvements have occurred along this twelve-year period in some countries, all these results
–and thus any overtime or cross-country comparison– should be taken with great caution. First,
because the coverage rates3 oscillate (cf. Panel B in Table 6), and second, because there may have
been changes in the composition of the samples, due to reasons such as modifications in the month
of the year in which the exam took place (Klein, 2011).
<TABLE 6>
The broad picture that emerges from the data in Table 6 is that of a clear-cut stagnation in
Argentina and Colombia; Uruguay sees stagnation followed by a slight decline in average scores,
possibly related to an increase in its coverage rate and a consequential inclusion of many socially
disfavoured pupils; considerable improvements in Mexico and Chile, in spite of an increase and
2
Source: http://www.oecd.org/pisa/aboutpisa/, accessed on February 2014.
3
9 maintenance at a high level, respectively, in the coverage rates; sizeable progress in Brazil, but
preserving the same low coverage rate (69 %) as in 2000.
Average scores are relevant, but they might hide more information than they show. It is usually
not sufficient to know the fortune of an average pupil, who might not concretely exist in very
unequal contexts. For that reason, it is important to turn to more sophisticated normative standards.
As p e iousl e tio ed, the e ualit of opportunity approach considers that inequalities in an
outcome may be partitioned into a fair portion and an unfair one: inequalities which stem from
circumstances should be deemed unfair, in contrast with those which depend on choices made by
individuals with equal circumstances.
Different techniques try to translate those concepts into measuring procedures4. Some
contributions have concentrated in the measurement of EEOp, with an emphasis on pupils´
educational achievement, usually measured by standardised test scores (Checchi and Peragine,
2010; Gamboa and Waltenberg, 2012). Following that approach, we report in Table 7 estimations of
inequality of opportunity in six Latin American countries, plus Portugal and Spain. As for the method,
we calculate inequality of opportunity as the proportion of the variance of PISA Mathematics scores
that is explained by a set of circumstances, ranging from zero (perfect equality of opportunity) to
one (perfect inequality of opportunity)5. It should be clear that the exercise has no ambition of
establishing any causal relationship, and simply consists of a static decomposition of inequality into
unfair inequality (the R-squared) and residual inequality (one minus the R-squared).
In order to ensure overtime comparability, we have chosen as i u sta es a set of variables
which is available with equal or very similar definitions across different rounds of PISA, namely:
pupil´s gender, pupil´s father´s and mother´s education and occupation, school type (i.e. public or
private), family wealth (a composite variable that expresses the relative overall financial situation of
4
For recent surveys, see: Pignataro (2012) and Ramos and Van De Gaer (2012)
5
10 the household), and home educational resources (a composite variable that expresses the extent to
which educational resources in particular are available).
<TABLE 7>
To clarify the content of Table 7, let us focus on the number that appears in the fourth row of the
first column: 0.176. It means that 17.6 % of the variance in PISA Mathematics scores in Mexico in
2000 is e plai ed by pupils´ circumstances, quite above the ideal 0%, but way below the
undesirable 100 per cent. It means thus that the level of inequality of opportunity in education
quality in Mexico was 17.6 % in 2000, at least according to a very parsimonious (and thus inevitably
incomplete) definition of circumstances –had more information been included, the calculated level
would have been higher–. Keeping our eyes on Mexico, we observe an important increase in
inequality of opportunities along the years, which has reached more than 30 % in 2012.
In the remaining five Latin American countries, inequality of opportunity in achievement has
either remained essentially stable (Argentina) or it has deteriorated (Brazil, Chile, Colombia, and
Uruguay). This is indeed worrying, since it means that circumstances beyond an individual´s control
are equally good, or even stronger, predictors of knowledge and skills today than they were over a
decade ago.
To put those results into perspective, it is useful to compare them with those of Portugal and
Spain, two countries which, while European and members of the OECD, are not renowned as
archetypal providers of equal opportunities for their citizens. With a few exceptions in particular
countries and years, Latin American countries´ levels of inequality of opportunity in achievement are
equal to or higher than those of Portugal and Spain.
Summing up, in the countries we have focused on, not only is average achievement alarmingly
low, but also, circumstances are significant determinants of a pupils outcome, and there has been
no clear improvement in this respect in the past decade. Reconnecting to the paper´s plot, while
Latin America has seen economic and redistributive advances in the 2000s, as well as in access to
11 situation has not improved. To better understand these trends, we now turn to a more thorough
analysis of three important countries in the region: Argentina, Brazil and Colombia.
Argentina: a period of reforms and higher spending with modest results
During the last few decades, Argentina has undergone a series of profound socio-economic changes,
partly due to the implementation of structural reform policies. In this context, the education system
has been deeply transformed through the application of two successive waves of reforms since the
early nineties. As a consequence, important progress has been made regarding some educational
outcomes, such as access, while further efforts are required to strengthen the quality and equality of
results.
At the beginning of the nineties, a radical neoliberal programme was applied in the country,
which introduced a wide range of institutional changes aimed at stabilising the economy, increasing
private sector participation, decentralising public expenditure, and deregulating different markets.
Although these policies were successful in terms of reducing inflation and promoting economic
growth, the internal contradictions of the scheme soon became apparent (Bonvecchi and Porta,
2003). Social costs were high, as unprecedented levels of poverty, income inequality,
unemployment, and social segregation were reached throughout the decade. The economic
equilibrium was ultimately compromised as well, and the century ended with one of the deepest
socio-economic crises Argentina has experienced.
As for the education system, the reform undertaken during this period was paradigmatic for its
depth, speed and coverage. The chief goals of increasing access, quality and equity in basic
education, especially at the secondary level, were pursued by passing four laws that radically
modified the structure and governance of the system6 and guaranteed a higher amount of public
spending on education. One of the main aspects of the reform was that it completed the
6
12 decentralisation of the provision of education services from the central government to the provincial
level: the provinces were now responsible for financing and managing primary and secondary
schools. Also, a new legal framework for the system was established in 1993, which included the
following components: the compulsory school attendance period was extended from seven to ten
years; private services were granted the same legal status as government services; an assessment
and accountability system was created; a compromise to increase the budget for education was
made; and several supply and demand-side programmes were designed and implemented to aid
low-income families and vulnerable schools.
Notwithstanding the severe criticism received by the reform and the difficult socio-economic
context in which it was applied, there is evidence of some positive results (Feldfeber, 2003; Ruiz,
2009; Zaccagnini, 2002). The main achievement was probably the growth in school attendance at the
secondary level, which greatly reduced socio-economic gaps in access and increased the proportion
of the population holding a high-school degree. There is consensus, however, over the difficulties
encountered to preserve and strengthen the quality of the services provided, in a system poorly
prepared to serve a larger, more diverse student population. Repetition and dropout rates have
risen or remained high during the period, and the role played by circumstances like family income or
parental education remains significant. Regional inequalities have been exacerbated by the
decentralisation process; and public-private sector disparities have grown, partly due to the
progressive socio-economic student segregation.
By the year 2000, the Argentine economy was in recession, entering the deep crisis of 2001-2002.
After reaching a poverty level of 50 per cent, unemployment rates close to 20 per cent, and high
degrees of income inequality, the process of recovery began in 2003 and steadily continued until
2008. Beyond the unprecedented growth rates of the domestic product, the past decade has been
one of great improvement in most socio-economic indicators (DiNIECE, 2010). Nevertheless, this
new model presents its own limitations which, in the context of the recent international crisis,
13 informality; relevant income inequality and poverty levels; and residential and social segregation
(Groisman, 2011; Veleda et al, 2011).
In the education sector, a new process of reform has been underway since 2005, with the passing
of three laws which revoked the former legislation7. One of these laws established the obligation to
gradually raise public expenditure on education, from 4 per cent of the Gross Domestic Product
(GDP), to 6 per cent by the year 2010. Although the provinces were responsible for making most of
this effort, the central government also had to increase its contribution. The funds provided by the
latter were to be allocated to salaries paid to teachers, to scholarships and material-resources
programmes and to improving infrastructure. According to different sources, the goals set down in
this law have been successfully met, greatly increasing both total spending and
spending-per-student, thus positioning Argentina among the countries with the highest public spending on
education relative to GDP(DiNIECE, 2010; Bezem et al, 2012).
The expansion in the education budget had a large impact on teachers´ wages, which grew by
more than 60 per cent in real terms between 2004 and 2010, at a higher rate than those of other
workers (Bottinelli, 2013). However, there is significant wage dispersion between provinces,
associated with their fiscal situation as well as the priority given to education. Also, by international
standards, teachers´ salaries in Argentina are low: annual statutory teachers´ salaries in public
institutions –in purchasing power parity– were less than half the OECD average for all levels of
education in 2010 (OECD, 2012). Moreover, the goals of strengthening teacher training or
professionalising the career were not accomplished (Bezem et al, 2012). Thus, teachers´ unions are
often in conflict with the government, so that strikes are frequent; there is a high degree of
dissatisfaction with working conditions; and incentives to entering the teaching career are relatively
low.
The new National Law of Education, passed in 2006, was intended to promote regional
coherence, as well as to continue pursuing the goals of quality and equality. The compulsory school
7
14 attendance period was extended again, now covering 13 years of basic education, and organisational
and curricular innovations were introduced. The National Ministry of Science and Technology was
created, as well as the National Teacher Training Institute. Also, during this period important
targeted programmes were created or extended, in order to support the demand for education from
vulnerable children and to strengthen service provision by disadvantaged schools. Additionally, the
implementation of a social welfare programme in 2009, Asignación Universal por Hijo (Universal
Child Allowance), was relevant in the education context due to its poverty reduction potential and its
conditionality of school enrolment.
Special attention was devoted in this legislation to extending the length of the school day and
year8. However, progress has been slow and Argentina is currently one of the Latin American
countries with the lowest official learning time in basic education (Tenti Fanfani, 2010). During the
last decade there hasn´t been a significant growth in the number of extended-day schools, and less
than 6 per cent of public education students attended these schools by the year 20119. Moreover,
official instruction time tends to differ from real instruction time due to teacher absenteeism,
strikes, and infrastructure problems. Thus, total school hours vary greatly between years and
regions.
As for the quantity and quality of human and material resources, information is scarce. In primary
schools, according to UNESCO (United Nations Educational, Scientific and Cultural Organization) data
for the year 2008, the student-teacher ratio is similar to that in other Latin American countries, and
has remained relatively stable since the nineties. On the other hand, infrastructure and material
resources were slightly better than in the rest of the region. However, notorious differences are
found between provinces and schools, associated with socio-economic background (Rivas, 2010).
This is confirmed for the secondary school level by a study employing data from PISA 2009(Krüger,
2011), which shows that schools in the public sector or with a more vulnerable population have less
or deficient resources. This is linked to student social segregation, a problem observed throughout
8
Law N° 25.864 (2004), Law N° 26.075 (2005), and National Law of Education (2006).
9
15 the decade both between the private and public networks and between schools in each sector,
which constitutes a relevant source of inequalities in achievement (Krüger, 2013).
Progress in educational outcomes during this last decade has been rather modest, mainly
circumscribed to equality in access. School attendance rates have either remained stable or
marginally grown for most age groups, with the exception of the pre-primary level where access has
grown considerably, and gaps by household income have continued to fall. Other quantitative
indicators were further improved, such as the illiteracy rate, the average number of years completed
by the adult population, and the proportion that currently finishes the secondary and tertiary levels.
On the other hand, there is little evidence of a positive evolution in the quality of education.
School lag, for instance, has moderately dropped at the primary level, but has increased slightly at
the secondary level, currently affecting over 30 % of the pupils. Also, gender and socio-economic
inequalities are observable. School dropout has remained significant as well during the period,
oscillating between 15 and 20% at the upper-secondary level, according to the national surveys
coordinated by the Ministry of Education.
As for the learning achievement levels, the information provided by PISA for 15-year-old students
isn´t very auspicious. Argentina systematically occupies the lowest positions in the international
rankings, and little progress has been made between the years 2000 and 2012.
Considering equality of results, however, there appears to have been a somewhat positive
evolution. The standard deviation of Mathematics test scores fell from 120 in the year 2000 to 77 in
2012, so that total inequality, although still high, was reduced. Moreover, there was a slight
decrease in inequality of opportunities as well, since the proportion of the variance in results
explained by the chosen circumstances has experienced a small reduction (Table 7). In 2012,
Argentina was, after Colombia and Uruguay, one of the Latin American countries with the lowest
inequality of opportunities. Still, the level of inequality continued to be significantly higher than in
16 considerable enough to infer that the influence of family background in achievement has fallen
during the last decade.
In conclusion, large transformations have occurred in Argentina since the beginning of the
century. After reaching historical values during the crisis, socio-economic indicators have greatly
recovered in the past years. However, social inequalities and exclusion are still relevant, and
continue to have an impact on educational outcomes. The most recent reform in the sector has
targeted the quality and equality dimensions, through organisational, curricular and financial
policies. Public spending on education has significantly risen, which has enabled the recovery of
teachers´ salaries, and the creation and extension of several targeted programmes.
Today, the Argentine education system remains one of the most inclusive in the region, since
access is relatively high for all age groups and levels. This might partly explain why average results
are lower than those in more selective systems, like Mexico or Brazil. Equality of opportunities in
attainment has also marginally improved. However, families´ social and economic capitals are still
significant determinants of their children´s attendance, repetition, graduation, and achievement.
Thus, results seem disappointing in light of the important efforts exerted.
Explaining these developments is quite complex, due to the multiplicity of factors involved. The
modest improvement in equality of opportunities in access and performance might respond to the
recovering socio-economic context during the decade, as well as to the supply and demand-side
policies implemented. On the other hand, the system still faces evident difficulties to integrate
children from vulnerable backgrounds, which results in social segregation and the provision of
services of differential quality. Furthermore, the last reform has received criticism for its speed and
the lack of preparation and support from the main actors involved, which has hindered its impact
(Ruiz, 2009). Finally, despite the larger education budget, teacher dissatisfaction is still high, total
instruction time is insufficient, and financial inequalities between provinces persist. Thus, structural
17
Brazil’s stru tural hanges in asi edu ation: too little, too late
In economic terms, the 1990s in Brazil could be summarised, as elsewhere in Latin America, as a
decade during which neoliberal policies reached their peak and important international economic
crises (Mexican, Asian, Russian, etc.) had to be faced by still very fragile economies. Many
socio-economic indicators showed little improvement along the decade, and some even deteriorated. For
example, income poverty stayed persistently above 37 per cent; income inequality (Gini) oscillated
around a shameful level of 0.59; unemployment in metropolitan areas rose from 9.7 % in 1992 to
14.4 % in 1999; the proportion of formal workers decreased from 42.8 % in 1993 to 40.4 % in 1999;
and the minimum wage lost around 20 % of its real value between January 1990 and January 2000.10
A relevant economic event was the stabilisation of Brazil´s currency after years of hyperinflation,
allowing agents to restart making long-term plans.
In basic education, a series of important developments took place, and many consequential
policies were implemented. First, following an international trend, large-scale standardised tests
started being employed in the early 1990s.11 The immediate effect was to unveil the low quality of
education, as expressed by test scores, which reflected average skills and knowledge below
acceptable thresholds. And that was true for both private and public schools, albeit more acutely in
the latter than in the former.12 Such deficient results observed at the national level were confirmed
when PISA 2000 data came out and Brazil occupied the very last position in the ranking (cf. Table
6).13
A second development was a reassignment of responsibilities concerning public basic education –
which functions within a complex federal system– including an important trend of decentralisation,
10
Pesquisa Nacional por Amostra de Domicílios (PNAD),collected by Instituto Brasileiro de Geografia e Estatística.
Consulted in IPEADATA (http://www.ipeadata.gov.br/) in May 2014.
11
From 1995 onwards, exams composing the Sistema de Avaliação da Educação Básica (System of Basic Education Evaluation, SAEB) took place every second year.
12
Most private schools in Brazil are privately-managed and funded by out-of-pocket fees paid by pupils´ parents.
13
18 as occurred elsewhere in the region. Those changes were due to provisions from the Federal
Constitution of 1988, as well as from ordinary, infra-constitutional policies implemented in the
1990s. Municipalities´ priority has increasingly become the provision of pre-school and primary
school education (especially lower-primary); states focus mainly on upper-primary and secondary
school education; the federal government should provide services or redistribute resources when
necessary, and organise the higher education system. Notwithstanding a decentralisation of duties,
tax revenues remain overwhelmingly centralised at the federal government, and the mechanisms for
their redistribution face many imperfections, on which we will comment below.
A third relevant occurrence was the creation of the FUNDEF14 in 1997, altering the formula
defining funding of public primary education throughout the country. Some features from this
reform stand out. First, per-pupil spending in public schools had now to be equalised within each
state, regardless of the wealth of each municipality. Second, the equalisation was only due within
states, allowing for wide inter-state inequalities. Third, the federal government would top up
revenues only to very poor states whose potential per-pupil spending was lower than a threshold
level defined yearly (by the federal government itself). Fourth, specific fractions of revenues
received by a municipality or state were to be spent on tea he s ages, i a atte pt to aise the ,
which did happen in the short-run (Anuatti-Neto et al, 2004; Menezes-Filho and Pazello, 2007). Fifth,
the reform was restricted to primary school education, leaving other levels subject to idiosyncratic
state-specific or municipality-specific funding rules.
Summing up, while socio-economic indicators at the turn of the century were not particularly
auspicious, important developments had indeed taken place in B azil s edu atio s ste . The had
delivered at most moderate immediate effects in terms of access-EEOp and skills-EEOp –as attested
by unsatisfactory figures concerning 2000 observed in Tables 1-7– but offered reasonably promising
prospects.
14
19 As elsewhere in Latin America, socio-economic indicators improved during the past decade.
Indeed, inequality and poverty levels dropped, from 0.59 to 0.54 (Gini), and from 37 per cent to 24
per cent (head count) respectively –levels which, while high for international standards, are
historical lows in Brazil–. The unemployment rate decreased from 13 % in 2001 to 7.9 % in 2011, and
the proportion of formal workers reached 52.5 % in 2011, up from 41.9 % in 2001 (PNAD). The main
drivers of such improvements were fast growth, and two important policies: the implementation of
Bolsa Família (Family Allowance) in 2004, a large conditional cash transfer programme, and
sustained increases in the minimum wage level.
In education, some trends and policy paths have been deepened or reinforced. Large-scale
standardised tests not only became widespread, at the national and lower levels, but also in a sense
changed their nature. The federal government maintained Brazil´s participation in the successive
PISA editions, ensuring the possibility of international comparisons, but it also created in 2005 the
Prova Brasil (Brazil Test), a biennial census-level national assessment of knowledge and skills of
primary (public urban) schools´ pupils. Shortly after, it created the Índice de Desenvolvimento da
Educação Básica (Index of Basic Education Development, IDEB) which aggregates with equal weights
test scores in Prova Brasil (or SAEB, for private schools) and approval rates, and may be computed at
any level (country, state, municipality, or school). IDEBresults are available on-line and are expected
to provide information for parents when choosing their children´s schools, as well as to serve as a
multiple-purpose tool for policy-makers.
As for the change in their nature, three generations of large scale assessments a e defi ed
in Brazil (Bonamino and Sousa, 2012), the first of which intended only to diagnose the quality of
education, while the second and third introduced some form of accountability based on IDEB and
alike, providing, respectively, symbolic or monetary consequences for teachers, principals and other
education employees. It has been argued that the pressure for better results on IDEB has deeply
transformed Brazil´s education system, as much as instructive activities themselves. All would now
20 One of the main critiques to the actual functioning of FUNDEF was that it allowed for too wide
inequalities. For example, in 2006, the last year of FUNDEF, per-pupil spending in the relatively rich
state of São Paulo was 2.5 higher than in the poorer state of Alagoas (Franca, 2013). Another
important critique was that the federal government could set low threshold levels, thus minimising
its own contribution to the poorest states (Vazquez, 2005). The aforementioned state of Alagoas for
example, did not receive supplementary resources in 2006 from the federal government, since the
threshold level had been set so low that only Pará and Maranhão were granted that right. These
problems affected Brazil´s public education irrespectively of the government in office, since they
occurred throughout Cardoso´s second term (1999-2002) and Lula da Silva´s first term (2003-2006).
Only in 2007, already in Lula da Silva´s second term (2007-2010) was FUNDEF replaced by
FUNDEB,15 expanding the sources of revenues, modifying the funding formula, and widening its
s ope. It o o e s all basic education , adding pre-school, secondary school, and basic education
for adults, to primary school, which was the exclusive focus of the previous scheme. Larger amounts
of federal funds have also been set aside to supplement the meagre per-pupil spending at relatively
poor states. The FUNDEB was implemented gradually, becoming fully operational only in 2009, but
already in 2007 eight poor states received additional resources as compared to only two in the
previous year.
A novelty in the 2000s was the implementation of conditional cash transfer schemes. In Brazil,
they had been launched through local experiences in the 1990s and became a federal programme in
2001, still during the Cardoso administration (1995-2002) under the name of Bolsa Escola Federal
(Federal School Allowance), providing cash transfers to poor families conditional on their enrolling
their children in school. In 2003, the fi st ea of Lula da Sil a s ad i ist atio , that programme was
merged with others under the label Bolsa Família and expanded substantially, to reach around 13
million beneficiary families by the end of the decade. Different studies have concluded that children
aged 7-14 living in households receiving these benefits are more likely to be enrolled at school, and
15
21 less likely to repeat a grade or drop out. The evidence concerning the effect on test scores is sparse
and more ambiguous (Silveira Neto, 2010; Cireno, 2013; Jannuzzi and Pinto, 2013).
The main advantage, if any, of the pressure for better results on IDEB, seems to be oriented to its
approval rate dimension, reflected on the figures in Table 2. The percentage of overage students in
Brazil´s primary school has dropped substantially from 20.8 per cent in 2000 to 6.7 per cent in 2012,
the most impressive reduction in the region, particularly benefitting the poorer population. In
secondary school, the reduction has been significant too, from 25.2 to 12.9 per cent. Nonetheless,
the coverage rate in PISA exams remains in 2012 the same as it was in 2000, suggesting that
retention and dropout still plague Brazil´s system, at least for 15-year-olds –thus, there still are
important deficits in access-opportunities–.
Regarding the quality dimension of IDEB, the pressure for better results on the exam, the current
accountability culture, and the overall configuration of Brazil´s education system do not seem to be
leading to notable results. PISA average Mathematics scores have increased –from 334 in 2000 to
391 in 2012–, but inequality of opportunity in education (Table 7) has deteriorated. The explanation
for that cannot lay on an allegation of a more heterogeneous student body, for two reasons: (i) few
new socio-economic groups have been incorporated into the system (most of that had happened in
the 1990s); (ii) the coverage rate remains stable. Moreover, the improvement of socio-economic
indicators in the decade could in fact lead to a prediction of higher EEOp, as long as they have a
potential impact on education quality.
Possibly the reason why so much changed in general socio-economic terms, but so little in EEOp
indicators is the lack of deeper structural educational reforms. Typical Latin American social
segregations remain intact in Brazil: (i) in metropolitan areas, between selective private schools for
the better-off and underfunded public schools for the worse-off; (ii) among private schools,
according to the degree of selectivity (academic and social), which is correlated to the fees charged;
(iii) among public schools, according to location, reputation and other features (Costa and Koslinski,
22 The supply of education in Brazil is indeed too heterogeneous, both in terms of capital and of
labour. A study based on 2011 data, presents a typology of infrastructure facilities in Brazilian
schools, classifying them in four groups: elementary, basic, adequate and advanced. Only 15.5% of
the schools reach at least the adequate level, and 44.5% do not reach the basic level. Also, the
proportion of schools with at least the adequate level ranged from 7.4 per cent in the North-East to
30.7 % in the Centre-West; from 6.6 % in municipal schools to 27.7 % in private schools; from 1.3% in
rural schools to 24.5% in urban schools (Soares et al, 2013).The bottom line is that the overall deficit
in infrastructure is not only very large, but it is also unequally distributed. So the equalisation of
(flows of) revenues made possible through FUNDEF and now FUNDEB is insufficient, not only
because it is done solely within states, or because the federal supplementation was (at least until
2006) too small, but also because there are infrastructural inequalities (stocks), which require
further attention.
In terms of labour, it is well known that teachers are essential in the education production
function. For many reasons, higher teacher wages could enhance learning: motivating teachers in
service, retaining good teachers in the occupation, attracting good candidates (Dolton, 2006). In
countries with good PISA results, teachers are relatively well-paid and are recruited among
above-average high-school students (Barber and Mourshed, 2007).Latin American teachers´ wages are low
when compared to equally qualified workers, a result which is confirmed for Brazil with late-2000s
data (Mizala and Ñopo, 2012; Britto and Waltenberg, 2014). National studies indicate that very few
good students in high-school want to pursue a career teaching, which is due to lack of social
prestige, fear of violence at schools and perceived low wages (Tartuce et al, 2010; Louzano et al,
2010).
An important and promising policy reform in the 2000s was the implementation of a specific
national minimum wage for teachers. It was introduced in July 200816 to take effect in 2009. The
problem is that while the legislation stems from the federal level, given the organisation of Brazil´s
16
23 education system it is states´ and municipalities´ duty to actually pay teachers´ wages. Since tax
revenues are excessively centralised, many administrations simply cannot implement the legislation,
or face many difficulties in doing so.
Colombia: some advances in access but not in quality
Public policies in education have been limited due to the internal conflicts experienced by Colombia
during the last decades. These conflicts have promoted inequality in several social spheres: such as
wealth, labour participation, political participation, and access to education. With Gini indices over
0.55, Colombia has been recognised for its historically high levels of inequality.
As a way to revert this trend, fiscal and administrative decentralisation were implemented during
the eighties. The aim was to assign the management of resources to those who had a better
understanding of local issues, attempting to increase efficiency and equity in different sectors,
including education. However, educational indicators still exhibited slow improvements after these
reforms.
The fraction of resources assigned to public education grew, as a result of decentralisation in the
mid-eighties and the expedition of a new National Constitution in 1991. Initially, spending on
education represented a fixed percentage –for example, 75% of total resources transferred from the
central government to the regions–17
. Since 2004, funds are transferred to certified regional entities
–states and municipalities with a population over 100 thousand– which assume its administration
and the supply of the official educational service. The central government defines the amount of
money to be transferred to each region based on actual coverage of the pupils´ population.
Additionally, a small fraction is assigned in order to increase support to the poorest entities.
Through this initiative, some progress has been made through the rearrangement of
responsibilities, the creation of information and monitoring systems, and the design of long-term
17
The percentage of current National income set by the Law 60 in 1993, was replaced by the General Participation System
24 policies. Also, local incentives to increase enrolment at the municipal level have been strengthened.
However, the total amount of funding for education continues to be lower than the amount
assigned to areas like defence.
During the last decade, education has been presented as a means to reduce poverty and armed
conflicts. Among the main goals of educational policies –quality, efficiency, and access–, the latter
has received the greatest attention. This required financial efforts which were made possible only
after important oil discoveries in the country provided the funds to support the transfers specified in
Law 60 and Law 715.
Due to the economic recession occurred at the end of the century, the demand for private
education services fell, increasing pressure in the public sector. Net enrolment rates grew from 35,
92 and 68 % in 2000 at the preschool, primary and secondary levels, respectively, to 45, 96 and 79 %
in 2012 (ECLAC; SEDLAC). The proportion of students who complete high school increased as well,
according to the National Ministry of Education: between 2001 and 2012 the completion rate grew
by 67 % at the public sector and 10 % at the private sector (Ministerio de Educación Nacional, 2010).
The importance of public enrolment has increased notoriously as a result of great efforts aimed
at avoiding dropout and fighting demand barriers to access (i.e. conditional cash transfer
programmes, free service provision, school meals, rural education programmes, transport subsidies,
etc.). In 2012, attendance rates reached values close to 100 % at the primary level, and over 70 % for
students aged 13 to 19 years.
In terms of equity, Colombia does not seem to exhibit a general positive trend during this period.
Education quality has been addressed through the use of national standardised tests and the
application of the so- alled school co-existence initiatives , an integral system combining knowledge
and citizen skills. The SABER tests are taken throughout the school career (5th, 9th and 11th grade and
at the end of higher education, SABER-Pro). Although traditionally used to monitor progress at the
regional and local levels, these tests are also employed to classify schools, and operate as a signal to
25 suggest that differences in achievement between private and public schools are significant. Scores in
Mathematics or Reading are ten to 15 % lower in the publicly-administered schools, and the gap has
widened over time. However, this is probably explained by the fact that private schools serve
students from a more favourable background, because when equivalent socio-economic conditions
are assumed, the gaps in results tend to disappear (Iregui et al, 2007).
A recent study employing SABER 11 results shows that in this level, inequality of opportunities
has grown during the past decade. Applying the same methodology as in Section 3 of this document,
the authors find that in the main metropolitan areas (Bogotá, Medellín, and Cali) the inequality
indicator has doubled: rising from 11 to 23 % in Mathematics and Reading (Gamboa and Londoño,
2014). As a way to reduce inequalities of opportunities, the government has emphasised the
protection of small children, creating the programme De Cero a Siempre (From Zero to Always),
which seeks to increase coverage at early ages and offers health protection and improved nutrition
to vulnerable children.
Regarding the gender gap, boys seem more prone than girls to lag behind in primary and
secondary school levels, and the differences grow at higher stages. This result has been at the centre
of attention, since absenteeism and delay among boys is highly associated with criminality, armed
conflict and child labour; while among girls, it is often linked to teenage pregnancy and also child
labour.
As for the gaps between urban and rural areas, gains in access have not been matched by a
greater equality of results. At the end of the nineties, attendance levels were much lower in the rural
sector, but these differences have been recently reduced, due to a higher coverage, a larger teacher
staff, and new flexible service-provision schemes. However, what represents an important concern is
the gap in the proportion of students who lag behind (see Table 2).
Colombia has also participated in international evaluation programmes such as TIMSS (Trends in
International Mathematics and Science Study) or PISA. In TIMSS, changes have not been impressive
26 only risen by 20 points in Mathematics and 27 points in Science, although a decrease in dispersion is
observed. Furthermore, PISA 2006-2012 results are disappointing: scores in all areas are below 390
and do not exhibit a positive trend.
Some initiatives have been implemented in order to improve educational quality: changes in the
teaching career (through the escalafón docente) were introduced; a new supply of educational
services was provided through private schools (such as charter schools); and a programme to
encourage the use of technologies in the classroom was created.
The escalafón docente is a classifying system which rates teachers` résumés according to criteria
such as academic degrees and work experience, and was established by Decree 2277 in 1979. Under
this scheme, access and promotion in the teaching career were relatively flexible, until it was
replaced by Decret 1278 in 2002. This new mechanism is more demanding, and requires a trial
period, strong achievement evaluations and continuous training in order to be promoted. Also, it
seeks to align teachers` incentives with those of the government, through the possibility of being
fired for those who do not abide by the rules. However, the highest salaries with this new scheme
are still not enough (approximately U$S 1,300 a month) to attract the most qualified human capital
to the field.
Another measure was the creation of voucher (PACES) and charter schools programmes (Colegios
en Concesión) to cover the excess of demand. Although these schools have permitted low income
students to receive private education services, the effect of this system on quality –measured
through test scores– may not be significant (Angrist et al, 2002).
Finally, the expansion in the use of information and communication technologies is still an
ongoing process, which includes initiatives such as the Computadoras para Educar (Computers to
Educate) programme that seek to raise internet connectivity and computer access in remote areas.
To sum up, progress in the educational sector during the last decades has been practically
27 schools do not exhibit notorious advances, neither in quality nor in equity. Other indicators, related
to quality and equality, have also not shown an overall positive trend.
Conclusion: the most difficult challenges are ahead
Along a decade of economic growth and improving socio-economic conditions in Latin America, a
wide array of education policies has been implemented, with impacts on relevant indicators.
Each country has departed from a different situation and has evolved in its own particular way,
although the overall picture shows that while some groups still struggle to solve progression and
completion problems, there have been reasonable improvements in the access dimension.
Nonetheless, the evolution of knowledge and skills seems insufficient and disappointing, since
not only do they stand on average far below an acceptable level, but also, and more importantly, a
pupil´s outcome remains significantly predetermined by her circumstances, and there has been no
clear progress in this respect. To the contrary, in most countries of the region EEOp in PISA test
scores has deteriorated between 2000 and 2012 –and it would be worse had the samples covered
the whole cohort–.
Argentina, Brazil and Colombia, the countries chosen for more detailed analyses, differ in many
respects and stood in contrasted positions at the turn of the century. Notably, Argentina had much
better indicators by 2000 than the other two countries. However, some trends and difficulties have
been shared by all of them, such as the paradox of a movement toward decentralising education
provision in a context of centralised funding. The implementation and expansion of conditional cash
transfers has also been common to the three countries, but at different moments and with different
designs, and it might be the case that some effects of these programmes on education are yet to
come –especially in Argentina, since its scheme is relatively recent–. In all cases there are shortages
28 qualitatively (e.g., low wages, low status and tough working conditions). Basic physical infrastructure
in schools is also a concern, more so in Brazil and Colombia than in Argentina.
Aimed at tackling the aforementioned problems, a myriad of different reforms have been tried in
the three countries –wage increases, teacher-career rest u tu i g, the diffusio of a testing culture ,
funding reforms, the introduction of weak and strong accountability schemes, and so on–. And that
happened as the economies were growing, unemployment rates were decreasing, and inequality
and poverty levels were retrenching, all of which would suggest further positive impacts on
children´s education.
If the improvements in achievement levels –on average and regarding their distribution across
the population– have been unsatisfactory, we must first admit that it would have been impossible to
advance in this respect given the poor initial education indicators, particularly so in Brazil and
Colombia. It must also be said that changes in education –especially in qualitative matters– are
inevitably slow. While poverty rates, for example, can follow the economic cycle in developing
countries, a person´s skills and knowledge a e ot so elasti , even more so given the fact that
parental education is always a good predictor of a person´s test scores.
While acknowledging all those caveats, we should not be too complacent. Latin America´s
education is still in need of deeper, structural, reforms. It is clear that the most difficult challenges
are ahead. Those reforms should allow to: (i) attract talented students to the teacher occupation,
especially to public schools; (ii) increase the average number of effective hours of instruction (with
positive spill-overs, for example to women´s participation in the labour market); (iii) tackle the social
segregation which separates the better-off and the worse-off into schools well-equipped –both in
labour and in capital–, and poorly-equipped, respectively; (iv) ensure sub-national governments have
adequate funding to provide the services entrusted to them. To accomplish all that, increasing public
investment in education in those countries, while not a sufficient condition, is certainly a necessary
29
Table 1. School Attendance Rates
Totala Equivalised income quintiles Area Age groups
1 2 3 4 5 Rural Urban 5 6-8 9-11 12-14 15-17
Argentinab
c2000 74.2 75.4 72.7 72.6 73.3 78.1 - 74.2 73.7 99.1 99.2 97.7 85.2 c2012 75.8 76.7 75.1 74.4 74.9 78.5 - 75.8 93.6 99.5 99.5 97.4 88.3
Brazil
c2000 69.7 72.2 69.0 66.7 65.8 75.5 67.8 70.1 65.9 93.1 97.9 95.0 81.1 c2012 69.5 76.2 70.1 65.1 61.5 70.9 71.7 69.1 86.6 97.6 99.1 97.8 83.7
Chile
c2000 74.9 74.0 72.3 73.8 74.8 81.9 68.0 76.0 71.8 97.9 99.3 97.9 87.8 c2012 73.3 76.1 71.3 68.9 69.5 81.4 69.2 73.9 93.9 98.9 99.5 99.0 92.0
Colombia
c2000 63.0 64.8 63.6 59.9 59.4 67.7 58.9 65.6 77.7 94.1 96.2 89.3 67.8 c2012 68.2 71.3 67.7 65.1 65.1 72.4 63.2 69.9 86.9 96.6 97.1 93.5 75.5
Mexico
c2000 64.6 65.2 61.5 62.0 62.8 73.0 61.7 66.6 85.2 95.9 97.1 88.8 57.9 c2012 66.9 66.3 64.9 66.3 65.2 73.4 62.6 69.7 96.4 98.4 98.2 91.6 66.2
Uruguayb
c2000 69.6 66.2 65.8 68.2 72.4 82.4 - 69.6 91.9 98.5 99.4 95.0 77.2 c2012 73.2 71.0 71.2 70.6 74.7 85.1 68.2 73.2 96.3 98.5 98.1 95.3 77.2
Notes: a Population aged 7 to 24 years; b Only urban area.
Source: CEPALSTAT (Economic Commission for Latin America and the Caribbean, ECLAC) and Sistema de
Información de Tendencias Educativas en América Latina (SITEAL, IIPE-UNESCO/OEI); based on special
30
Table 2. Percentage of Overage Students a
Year Total Gender Income Area
Male Female lower 30% mid 30% upper 40% Rural Urban Argentinab
Primary c2000 8.9 10.1 7.7 12.3 4.5 2.9 - 8.9
c2012 6.6 6.9 6.3 8.7 4.1 2.7 - 6.6
Secondary c2000 27.5 31.7 23.2 31.2 27.6 19.5 - 27.5 c2012 31.2 34.1 27.9 32.4 30.4 27.2 - 31.2
Brazil
Primary c2000 20.8 24.2 17.0 22.3 9.8 4.9 36.3 16.2 c2012 6.7 8.4 4.9 6.8 3.1 1.9 12.9 5.1 Secondary c2000 25.2 27.9 22.5 31.4 23.0 13.4 36.0 23.5
c2012 12.9 15.1 10.5 14.5 10.2 5.6 19.6 11.5
Chile
Primary c2000 11.0 12.4 9.5 13.3 8.2 5.2 17.1 10.0 c2012 11.2 12.9 9.5 14.5 9.2 6.8 11.5 11.2 Secondary c2000 13.8 15.3 12.3 14.9 13.5 9.2 18.2 13.2 c2012 5.2 6.7 3.6 6.5 4.6 2.6 6.6 5.0
Colombia
Primary c2000
c
24.9 27.3 22.1 25.6 18.2 8.9 35.6 19.5 c2012 17.5 20.6 14.1 19.2 11.8 8.0 27.7 14.6 Secondary c2000
c 25.6 28.6 23.5 26.1 23.0 15.6 38.8 22.3
c2012 30.2 33.7 26.3 33.4 26.3 20.2 42.1 27.8
Mexico
Primary c2000 10.4 12.0 8.8 9.5 4.7 3.3 17.1 7.1 c2012 6.8 8.6 4.8 6.1 3.7 1.8 10.4 5.4 Secondary c2000 21.5 23.9 19.2 20.9 20.8 18.0 25.8 20.4
c2012 14.3 16.2 12.4 13.6 14.8 15.0 13.9 14.5
Uruguayb
Primary c2000 13.0 14.9 11.1 17.3 7.1 4.2 - 13.0 c2012 9.3 11.2 7.2 13.5 4.0 2.1 8.6 9.5 Secondary c2000 24.9 26.5 23.3 29.9 25.0 16.0 - 24.9
c2012 29.4 31.6 27.2 32.1 30.0 26.0 23.9 30.1
Notes: a 2 or more years behind the corresponding grade level; b Only urban area; c 2003.