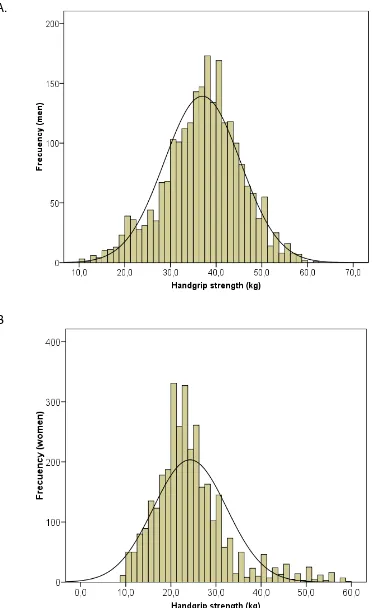
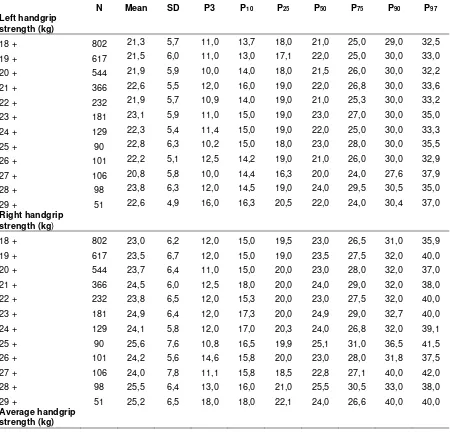
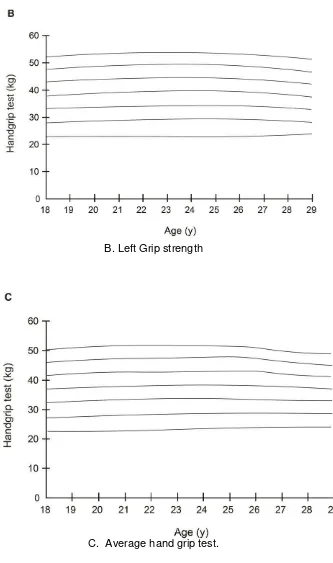
Reference values for handgrip strength in among healthy young adults
Texto completo
Figure


Documento similar
However, bibliometric indicators explain reasonably well the final decision on granting research proposals (Table 7) and thus, we suggest they could be used as a complement to
Assume the test data is typed with the right hand; then typing keys on the right hand side of the keyboard will be typed in a normal manner, while keys on left hand side of the
To assess the functionality of the hand in the pathological subjects, the values of the angles recorded for them were compared with the reference sample in two different ways: (1)
For this reason, the main aim of this study was to define quantitatively the flexibility profile reference values in 20 professional futsal players by assessing the flexibility of
Left-hand panel: two-planet fit (model B2) to the observed data with no quadratic trend removed.. Right-hand panel: periodogram of residuals to
weighted mean values of the different functional traits for each grazing intensity level and year, 694. in productive (left) and unproductive
To characterise and compare maximum and explosive strength, anaerobic power, execution speed and running speed based on age group and playing position in young female
Figure 6.7 – Quantum bit error rate (left-hand axis), background rate and secure key rate R net (right-hand axis) measured the 31 st of July 2012 for a 300 meter optical link at


