Attribution-NonCommercial-NoDerivatives 4.0 International (CC BY-NC-ND 4.0) license DOI. http://dx.doi.org/10.22201/fi.25940732e.2018.19n3.028
Abstract
Pineapple drying kinetics and its best fitting mathematical models were studied. Pineapple slices of 1 cm thickness were dried using a high precision lab-scale dryer developed at Hohenheim University, Germany using a controlled air stream at a specific humidity of 25 gwaterkgair-1 with three temperature levels of 50, 60 and 70°C along with air velocity of 0.5, 1.0 and 1.5 ms-1. The
best fitting model of the ten used was the one proposed by Hasibuan and Daud followed by the models of Haghi and Angiz-IV and Sripinyowanich and Noomhorm, correspondingly. Predicted and experimental data matched acceptably. In order to assess the pineapple drying behaviour, the model by Hasibuan and Daud was used to simulate and optimise an efficient pineapple drying operation. After drying pineapple color fades slightly without major quality changes. From 50 to 70°C at 0.5 ms-1 drying
time decreased subsequently from 26 to 12 hours; from 50 to 70°C but with an air velocity of 1.0 ms-1 drying time went down
from 20 to 10 hours and finally with an air velocity of 1.5 ms-1 and same temperature rise drying time is reduced from 16 to 8
hours. It was not observed any drying constant rate.
Keywords: Pineapple, thin-layer drying, drying models, high precision laboratory dryer.
Resumen
Tanto la cinética del secado de piña como sus respectivos modelos matemáticos más apropiados se estudiaron. Un laboratorio seca-dor de alta precisión, desarrollado en la Universidad de Hohenheim, Alemania se utilizó para el secado de rebanadas de piña de 1 cm de grosor usando una corriente controlada de aire de una humedad específica de 25 gaguakgaire-1 a temperaturas de 50, 60 y 70°C
y velocidades de 0.5, 1.0 y 1.5 ms-1 , respectivamente. En total, diez modelos se estudiaron, de los cuales el propuesto por Hasibuan
y Daud obtuvo el mejor ajuste seguido por el modelo sugerido por Haghi y Angiz–IV y por Sripinyowanich y Noomhorm. Las pre-dicciones de los modelos y los datos experimentales se ajustaron de forma aceptable. Tanto para la simulación y optimización de un proceso de secado eficiente se usa el modelo de Hasibuan y Daud para evaluar el comportamiento de la piña. La piña, después del secado, presentó un ligero descoloramiento sin detrimento de la calidad. De 50 a 70°C a 0.5 ms-1, el tiempo de secado disminuyó
de 26 a 12 horas; en cambio, de 50 a 70°C a 1.0 ms-1 hubo una disminución de 20 a 10 horas y de 50 a 70°C a 1.5 ms-1 se redujo
de 16 a 8 horas. No se observó ninguna tasa constante de secado.
Descriptores: Piña, secado en capa delgada, modelos de secado, secador de alta precisión a escala de laboratorio.
Thin layer drying of Pineapple (
Ananas comosus, L
.)
Secado de piña (
Ananas comosus, L
.) en capa delgada
López-Cerino Ignacio
University of Chapingo, Texcoco, México Graduate Agricultural Engineering Program E-mail: cerino3@gmail.com
López-Cruz Lorenzo Irineo University of Chapingo, Texcoco, México Graduate Agricultural Engineering Program E-mail: ilopez@correo.chapingo.mx Nagle Marcus
Hohenheim University, Stuttgart, Germany
Institute of Agricultural Engineering in the Tropics and Subtropics E-mail: marcus.nagle@uni-hohenheim.de
Mahayothee Busarakorn
Silpakorn University, Nakhon Pathom, Thailand
Department of Food Technology, Faculty of Engineering and Industrial Technology
E-mail: busarakornm@yahoo.com Müller Joachim
Hohenheim University, Stuttgart, Germany
IntroductIon
Pineapple (Ananas, comosus, L.) fruit is appreciated by its
exotic tropical flavour and nutritional value; it is also con
-sumed by itself as well as for producing juice. It has served
also like symbol throughout the human history. Pineapple is originally from the Western Hemisphere and it is
se-cond America’s favourite tropical fruit next to bananas. Fruit drying process consists of thermally removal of volatile components like solvents and specially water
in a natural way using sun drying, or through the use of specialized dryers and dehydrators. Although drying characteristics of Ananas comosus, L. have already been investigated by some researchers (Hossain et al., 2001; Simal et al., 2007; Agarry et al., 2013; Talla et al., 2005; Herman and Garcia, 1999; Olanipekun et al., 2014;
Kingsly et al., 2009; Nicoleti et al., 2001; Ramallo and
Mascheroni, 2012) laboratory high precision drying has not been used so far to study the drying process
beha-viour of thin layers of pineapple. A recent study about
drying of pineapple cut in thin layers (Agarry et al.,
2013) was focused on the effects of a physical
pre-treatment (blanching). Drying kinetics studies are
cha-racteristic of fitting measured drying properties into
empirical equations in order to predict both drying
pa-rameters and behaviour of the material at alternative conditions. It is important to remove each of these to obtain a smoothed curve that can be used for designing
purposes. Experiments carried out in the high precision
lab-scale dryer at Hohenheim University, Germany
produce trustful data because of the high control
tech-nology applied to the different process parameters. It is the first time that drying experiments applied to pi -neapples cut in thin layer are carried out in a laboratory scale dryer. Similarly, to our best knowledge, it has not
been any research or study using pineapple variety MD2. Therefore, the main objectives of the current stu
-dy were to investigate the generated effects of three temperatures levels (50, 60 and 70°C) combined with three different air velocities (0.5, 1.0 and 1.5 m s-1) on drying kinetics of pineapple; as well as, modelling of thin layer drying process by evaluating the most rele
-vant empirical mathematical models.
MaterIalsandMethods
Dryingexperiments
Materials
Fresh-bought ripen pineapple fruits (Ananas comosus, L.) MD2 variety (large size, 1.5 – 2.2 kg, oval shape and
mostly yellow with patchy light green) were obtained
at the local market (Stuttgart, BW, Germany) later sto
-red at 8°C. The fruits were manually peeled, transver -sely cut with 10 mm thickness using an electrical slicer
(Bosch, Germany) and finally cored. Initial moisture content was bounded by 456-683 % (db). The pineapple slices were placed inside the overflow drying chamber
of the laboratory scale dryer.
experiMentaldryer
The high precision lab-scale dryer used for the pi -neapple drying (Figure 1) was designed by the
de-partment of Agricultural Engineering, University of Hohenheim (Stuttgart, Germany). In this system a wide range of operating parameters can be controlled. The main structure is divided in four units:
1) An air flow control unit
2) An air conditioning unit with a
thermostat-contro-lled water bath and sprayed Raschig-ring bed
3) A heating control unit with primary and secondary heating elements
4) Two drying compartments to provide either through flow or over flow (Argyropoulos et al., 2011). Each unit is electronically controlled by a
proportional-integral-derivative (PID) controller. A detailed des -cription of the working process of the system with
its correspondent schematic figures can be found
elsewhere (Janjai et al., 2011).
dryingconditions
Before running the drying experiment, the high preci -sion laboratory scale dryer was in operation mode for at least two hours in order to obtain steady-state parame-ters. Pineapple thin layer drying scenarios were set up
at a temperature of 50, 60 and 70°C; air velocity of 0.5,
1.0 and 1.5 ms-1 and specific humidity of 25 g
waterkgair-1. Pineapple samples were weighted automatically every 30 minutes. Nine experiments with three replications
were carried out.
physicochemicalproperties
Moisturecontent
The moisture content was calculated (θmass, %) by mass
which is defined as
(1)
where
mw (kg) = mass of water and
mmaterial(kg) = mass of the dry material
The moisture in the material comes from three sources: external water, internal liquid water and water vapour present in the surrounding air. Gravimetric determina -tion is a direct method that is considered as the best
procedure to measure the average moisture content, i.e.
to weight the sample before and after drying (Erich and Pel, 2011).
Weight difference between wet and dry sample is
used for absolute moisture content determination of the (θm, kg/kg).
(2)
where
mwet (kg) = mass of the wet material
mdry (kg) = mass of the dry material
Basicqualityspecificationsforpineapple (Md2)
Determination of total soluble solids or sugar (TSS) by refractometer
During the development of pineapple flesh nutrients
are stored as starch, which during the ripening
pro-cess is transformed into sugars (OECD s.f.). A Pallet Type Refractometer ATAGO model PR-201was used to measure TSS. Checking and recalibrating to zero
was mandatory for each test. Juice sample was extrac-ted uniformly.
Determination of pineapple acids by Titration
Sugar/acid ratio contributes to the characteristic flavour
of pineapple, thus it is an indicator of commercial and organoleptic ripeness. During the ripening process the fruit acids are degraded, the sugar content increases
and the sugar/acid ratio achieves a higher value (OECD s.f.). The determination of the titratable acidity of pi -neapple (%) used a pH meter, which is a Potentiometric method.
Color measurement
Color determination of both fresh and dried samples was carried out with a Konica Minolta Colorimeter (CR-300; Minolta Co., Ltd., Osaka, Japan). Device cali -bration was done with a standard white tile at D65
illu-mination (Y = 85.8,x = 0.314, y = 0.331). Three readings
were performed per pineapple slice surface by placing
the colorimeter head directly above the slice. Twenty seven measurements were considered in each experi -ment for both fresh and dried pineapple samples.
The CIE L*, a*, b* color space developed in 1976 pro
-vides uniform color differences in relation to human perception of differences and it is commonly used in
the food industry (Pathare et al., 2013).
Color parameters are characterised by L* describing lightness (L* = 0 for black, L* = 100 for white), a* descri-bing intensity in green-red (a* < 0 for green, a* > 0 for red) and b* describing intensity in blue-yellow (b* < 0 for blue, b* > 0 for yellow). Color differences are defined
as DL* = L*d- L*f for lightness, Da* = a*d- a*f for redness and Db* = b*d- b*f for yellowness, where subscript “f”
refers to fresh samples and “d” to the values of dried materials respectively. Total color difference is expres -sed as DE = ((DL*)2 + (Da*)2 + (Db*)2 )1/2 being larger DE*
denotes greater color change from the fresh material.
Similarly, Chroma (C*) is defined as:
C* = (a*2 + b*2) 1/2 (3)
indicating color saturation, which is proportional to its
intensity. The hue angle (h) is defined as
(4)
For the h value, an angle of 0° or 360° indicates a red hue, while angles of 270°, 180° and 90° represent blue,
green and yellow hue correspondingly (Argyropoulos
et al., 2011; Pathare et al., 2013). Because Chroma (C*)
portrays the quantitative attribute of colorfulness, it is used to determine how different is the hue in compari
-.100% w mass material m m
θ
= wet dry m drym
m
m
θ
=
-1 1tan ( * / *) ( * 0)
180 tan ( * / *) ( * 0)
b a when a
h
son to a grey color with the same lightness. The higher the Chroma value is, the higher is the color intensity of samples perceived by humans (Pathare et al., 2013).
mathematicalmoDelling
Calculation of moisture ratio
Data obtained at different drying temperatures were transformed to the moisture content ratio (MR, dimen -sionless) calculated as
(5)
where M,db decimal, M0, db decimal and Me,db decimal
are the moisture content at any given time, the initial
moisture content and equilibrium moisture content,
respectively.
dryingModels
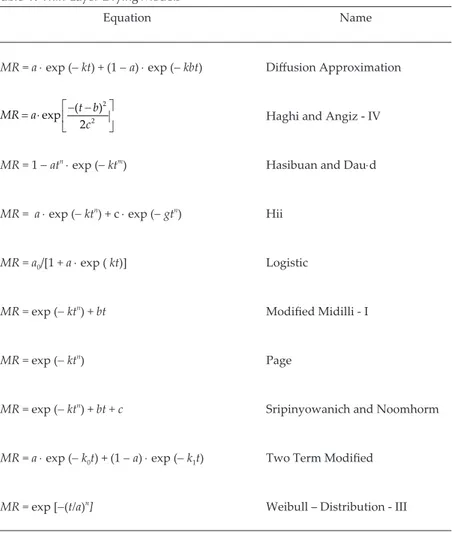
The drying curves generated by data coming from the High Precision lab-scale dryer at Hohenheim, were fit -ted with ten empirical and semi theoretical thin-layer
drying models (Table 1) suggested by (Ertekin and Fi
-rat, 2015). These equations were chosen since they have shown better fit behaviour for this category of drying experiments (Togrul and Pehlivan, 2002; Koua et al.,
2009; Janjai et al., 2011)The models were selected from a total of 26 discarding the ones with large Root Mean Square Error (RMSE). The constants estimation and RMSE with nonlinear regression was performed using MatLab® (Version R2013b).
Although, it was found in literature that
Logarith-mic model had produced good fitting in predicting pi -neapple drying (Kingsly et al., 2009), results with data
from the high precision laboratory showed that the fit -ting was not appropriate therefore the model was ex-cluded.
e
o e
M M MR
M M
-=
-Table 1. Thin-Layer Drying Models
Equation Name
MR = a ⋅ exp (-kt) + (1 - a) ⋅ exp (- kbt) Diffusion Approximation
Haghi and Angiz - IV
MR = 1 -atn⋅ exp (- ktm) Hasibuan and Dau⋅d
MR = a⋅ exp (- ktn) + c ⋅ exp (- gtn) Hii
MR = a0/[1 + a⋅ exp (kt)] Logistic
MR = exp (- ktn) + bt Modified Midilli - I
MR = exp (- ktn) Page
MR = exp (- ktn) + bt + c Sripinyowanich and Noomhorm
MR = a⋅ exp (- k0t) + (1 -a) ⋅ exp (- k1t) Two Term Modified
MR = exp [-(t/a)n] Weibull – Distribution - III
2 2
( )
exp 2
t b MR a
c
- -
= ⋅
statisticalevaluation
The Table 1 shows the suitable thin-layer drying mo
-dels. Three different thin layer drying models were se
-lected to fit the pineapple drying experimental data. The coefficient RMSE was chosen because it helps to
eliminate the problem of compensation between under-
and over-prediction.
For a good fit the root mean squared error (RMSE) should be close to zero, defined as
(6)
where Mpre,i and Mobs,i are the predicted and observed
dimensionless moisture ratios respectively and N is the
number of measurements.
The Root Mean Squared Error (RMSE) is comparable with a generalised standard deviation, which measures the given difference between known locations and inter -polated ones. Another criterion for selection uses the mean absolute error (MAE), which is a statistical measu-re of how accurate the estimates ameasu-re in comparison with
the actual values. MAE avoids compensation between under- and over-prediction. The MAE is given by:
(7)
where
fi = prediction and
yi = true value
|ei|= an average of the absolute errors. Units of MAE are the same as yi, thus there are no large differences
over-weighting.
Modelling efficiency (EF) considers measures of distan
-ce, which have an upper and/or lower bound giving allowance for completely different cases to be compared (different data, different models) and it is defined as
(8)
where
(9)
is the average of the yi.
equilibriummoisturecontent
In this research equilibrium moisture content of the pi-neapple slices is considered at the point where the
moisture content does not vary in a considerable period of time, at a given temperature and relative humidity.
Pineapple slices were weighted before and after each experiment using an analytical balance (Sartorius
ED224S-OCW, Max. 220g; Graduation=0.0001g). The
moisture content (mi) of each pineapple sample was de-termined from the dry weight of the pineapple samples by applying the equation 10.
(10)
where the terms IMi(g) (g) and FM(g) refers to the
ini-tial mass and final dry mass respectively; FMC (%,db)
refers to final moisture content.
resultsanddIscussIon Dryingkinetics
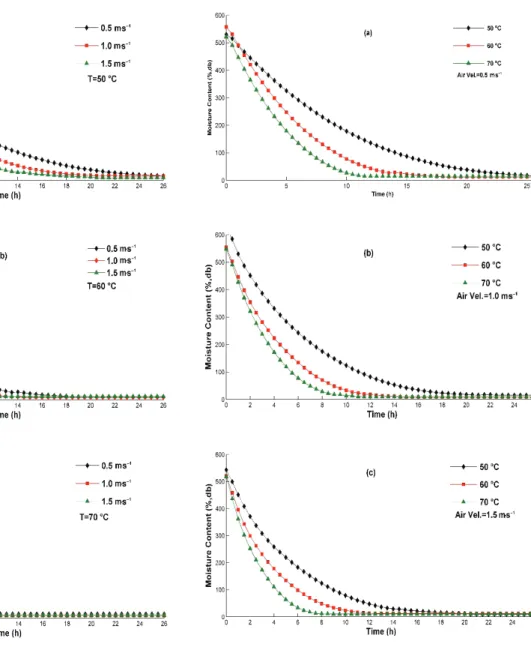
Pineapple drying behaviour
Figure 2 shows drying effect in moisture content at di
-fferent combinations of drying air temperature with constant air velocity. Final moisture content under di
-fferent conditions resulted to be bounded from 8.54% to 15.53% (db.). By comparing figures 2a, 2b and 2c it can be seen that minimum final moisture content de -pends, to certain extent, on higher drying rate and
hotter temperatures. Moreover, it can be noticed, for each applied temperature, that the higher the air velo -city is, so the initial rate is. Figure 3 shows the existent relationship between moisture content reductions
with the applied air flow in the range of 0.5 ms-1 to
1.5 ms-1. By comparing Figures 3a, 3b and 3c it can be observed that the greater air flows are, the rate of pi
-neapple drying increases. Thus, from 50 to 70°C at
0.5 ms-1 drying time decreased from 26 to 12 hours; similarly with higher air flow rates, from 50 to 70°C at
1.0 ms-1 drying time decreased from 20 to 10 hours and from 50 to 70°C at 1.5 ms-1 drying time decreased from 16 to 8 hours.
0.5 2
1{ , ,}
N
i Mpre i Mobs i RMSE N = - =
∑
1 11 N 1 N
i i i i i
MAE f y e
N = N =
=
∑
- =∑
2 1 2 1 ( ) 1 ( ) N i i i N i i y f EF y Y = = =-∑
∑
1 1 N i i Y y N = =∑
1 100 %
Figure 2. Thin layer drying of pineapple at different
Models T(°C) Air Vel.
a (-) b (-) c (-) k (-) m (-) n (-)
RMSE
MAE EF
(m/s) (%)
Hasibuan and Daud
50 0.5 0.08283 0.08695 0.8377 1.164 0.708 0.47751 0.99948
60 0.5 0.1371 0.16210 0.7926 1.233 2.170 1.48648 0.99657
70 0.5 0.162 0.11370 0.9309 1.187 1.593 2.28995 0.99008
50 1 0.1707 0.10710 0.7865 0.958 2.126 1.70607 0.99591
60 1 0.223 0.13290 0.8333 1.016 2.278 1.80406 0.99595
70 1 0.2625 0.17960 0.8417 1.113 1.776 1.55350 0.99744
50 1.5 0.205 0.16440 0.7172 0.992 2.820 1.19154 0.99873
60 1.5 0.3128 0.26130 0.6772 1.024 2.132 1.38361 0.99833
70 1.5 0.3186 0.06939 1.141 0.898 2.016 1.42355 0.99844
Haghi and Angiz-IV
50 0.5 2.522 -20.66 15.27 1.440 0.86924 0.99827
60 0.5 2.14 -11.13 9.086 3.512 3.41095 0.98194
70 0.5 1.525 -5.567 6.095 2.859 3.39284 0.97816
50 1 34.5 -47.76 17.92 3.904 2.62780 0.99030
60 1 4.525 -15.04 8.642 3.483 2.90971 0.98945
70 1 2.515 -7.844 5.781 2.775 2.78244 0.99179
50 1.5 106.5 -53.44 17.48 4.039 2.34020 0.99506
60 1.5 53.11 -31.05 11.01 3.432 2.32970 0.99527
70 1.5 3.454 -7.941 5.027 4.161 3.39556 0.99114
Sripinyowanich and Noomhorm
50 0.5 -0.00020 -0.00706 0.07014 1.185 2.196 1.81023 0.99252
60 0.5 0.00058 -0.01099 0.10880 1.244 3.772 3.91705 0.97618
70 0.5 -0.00362 -0.00152 0.14620 1.210 2.674 3.74709 0.97353
50 1 -0.00023 -0.00991 0.14720 1.031 4.426 3.94660 0.98687
60 1 -0.00009 -0.01203 0.19260 1.109 4.725 3.94660 0.98061
70 1 -0.00003 -0.00960 0.22640 1.178 4.192 2.83610 0.99152
50 1.5 0.00000 -0.00930 0.17260 1.030 4.471 2.08441 0.99608
60 1.5 -0,00137 -0.00328 0,26420 1.011 3.428 3.41924 0.98985
Modelling of thin-layer drying process
Moisture ratios of dried pineapples at different tempe
-rature and air velocity were fitted with three thin layer models. Parameter values of the models and the statis
-tics RMSE, MAE and EF are shown in Table 2. Hasibuan
and Daud model was the best, followed by Haghi and
Angiz IV’s and Sripinyowanich and Noomhorm’s. For these three cases the value of RMSE was less than 5.6%
indicating a good fit. The average value of RMSE for the Hasibuan and Daud model was 1.96%, MAE was 1.48
and EF= 0.99.
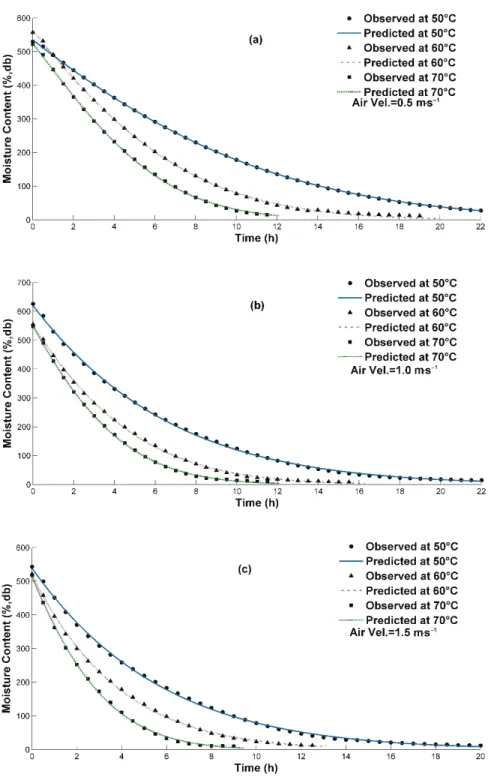
coMparisonofdryingModelswithexperiMentaldata
Figure 4 to 6 show predicted and experimental data of
pineapple thin layer drying according to Hasibuan and
Daud, Haghi and Angiz – IV and Sripinyowanich and
Noomhorm models, respectively. Predicted and mea
-sured values show good fitting. Successful models ex -press pineapple moisture ratios as functions of both
empirical parameters and time. Pineapple has a homo-genous texture, which means obtained results are
re-presentative for most pineapples that are marketed.
physicochemicalpropertiesofDrieDproDucts
Basicqualityspecificationsforpineapple (Md2)
In Table 3 are summarized the basic quality specifica -tions that are required for fresh and dry pineapple
samples. TSS dry values indicate an increase of ap -proximately 35% of sugar concentration from fresh to dried pineapple causing sweeter taste in the dried
sli-ces. Titratable acidity (TA) and juice pH are measured in order to have a pineapple maturity overview du
-ring harvest. A minimum flavour acceptance by most
consumers is achieved by having a soluble solids con -tent of at least 12% and a maximum acidity con-tent of
1 % (Kader, 1996).
colorchange
Table 4 describes the variations in color for both fresh and dried slices in relation with temperature and air ve
-locity; this change of color is due to the evaporation of
the water in the fruit. Figure 7 shows the drying
tempe-rature influence on pineapple color indices. From Table 4 and Figure 7 is observed that the lightness value is
Table 3. Basic quality specifications for fresh and dry samples of pineapple TEMP
(°C)
AIR VEL
(ms-1) TSSFresh(%Brix) TSSDry(%Brix) TA(%) pH Fresh MC(%)Fresh MC(%)Dry Fresh(-)aw awDry(-) 50 0.5 13.46 51.78 0.98 3.48 85.40 11.25 0.98 0.56
60 0.5 12.98 43.15 1.17 3.49 85.79 11.00 0.98 0.56
70 0.5 13.42 52.76 0.93 3.44 85.02 11.57 0.97 0.61
50 1 13.15 55.10 1.00 3.51 87.97 12.83 0.98 0.58
60 1 12.79 31.68 0.86 2.35 57.71 9.81 0.97 0.53
70 1 13.07 34.29 1.04 3.49 85.65 8.93 0.98 0.51
50 1.5 13.73 48.80 0.80 3.49 86.89 13.31 0.97 0.55
60 1.5 13.19 62.47 0.95 3,61 85.86 11.17 0.99 0.55
70 1.5 13.43 57.62 1.02 3.50 57.38 8.45 0.98 0.46
Table 4. Color variations of Pineapple dried at different temperatures
Status Treatments Color value
L* a* b* C* h
Fresh Average of 27 observations 72.89 -3.21 33.24 33.05 95.44 Dried Pineapple Average of three observations at
50°C and 0.5 ms-1 79.23 1.10 39.29 39.32 88.33 Average of three observations at
60°C and 0.5 ms-1 75.24 2.50 39.94 40.07 86.51 Average of three observations at
70°C and 0.5 ms-1 75.79 2.72 42.10 42.21 86.30 Average of three observations at
50°C and 1.0 ms-1 79.48 0.16 43.60 43.62 89.89 Average of three observations at
60°C and 1.0 ms-1 78.86 0.91 43.70 43.73 88.85 Average of three observations at
70°C and 1.0 ms-1 79.36 1.02 38.90 38.95 88.48 Average of three observations at
50°C and 1.5 ms-1 81.83 0.61 32.74 32.76 91.05 Average of three observations at
60°C and 1.5 ms-1 77.82 1.34 44.16 44.19 88.24 Average of three observations at
higher in dried pineapple compared with the one of
fresh pineapple. Redness and yellowness do not increa
-sed significantly, which means that yellow color varied in a meagre extent. The Chroma (C*) reacted in the
same way as redness and yellowness (negligible chan-ge) indicating that any color saturation took place. Hue angles (h) of dried pineapple decreased no more than 8
units evidencing that color moves around red and ye -llow resulting in a scant presence of brown color on the
dried pineapple. For this reason, there is not a signifi -cant change in the color indexes when the pineapple
are dried at 50°C, 60°C and 70°C. These temperatures
are suitable for drying pineapple in slices.
conclusIons
Thin-layer drying of pineapple was investigated and it was found that when the temperature and air velocity
were increased, drying time went down. From 50 to
70°C at 0.5 ms-1 drying time dropped from 26 to 12 hours; from 50 to 70°C at 1.0 ms-1, drying time decrea-sed from 20 to 10 hours and from 50 to 70°C at 1.5 ms-1 from 16 to 8 hours. Constant drying period rate was not observed.
Ten thin-layer drying models were fitted, selecting
only three models for the experimental pineapple data.
The Hasibuan and Daud model was the best fitted mo -del, followed by Haghi and Angiz-IV and
Sripin-yowanich and Noomhorm. Predicted and experimental data fit appropriately. Simulation and optimisation of an efficient drying operation can use Hasibuan and Daud model to assess pineapple drying behaviour.
Quality of color is acceptable. Sugar concentration
con-tent significantly increased providing a pineapple with a sweeter flavour.
acknowledgeMents
This research has been supported by CONACYT-Méxi
-co (grant 95103). The financial support by Nutrición y Transformación Alimentaria S.A. de C.V. is greatly ack -nowledged.
references
Agarry S.E., Ajani A.E., Aremu M.O. Thin layer drying kinetics of pineapple: Effect of blanching temperature-time combination. Nigerian Journal of Basic and Applied Science, volume 21 (issue 1), 2013: 1-10.
Argyropoulos D., Heindl A., Müller J. Assessment of convection, hot-air combined with microwave-vacuum and freeze-drying methods for mushrooms with regard to product quality. Inter-national Journal of Food Science and Technology, volume 46 (issue 2), 2011: 333-342.
Kemp I.C., Fyhr B.C., Laurent S., Roques M.A., Groenewold C.E., Tsotsas E., Sereno A.A., Bonazzi C.B., Bimbenet J.J., Kind M. Experimental drying kinetics data. Drying Technology, volume 19 (issue 1), 2001: 15-34.
Erich B.J.F. and Leo P. Moisture content measurement; Adan O.C.G., Samson R.A. (eds), Fundamentals of mold growth in indoor environments and strategies for healthy living. Eind -hoven, the Netherland, Wageningen Academic Publishers, 2011, pp. 305-334.
Ertekin C. and Firat M.Z. A comprehensive review of thin layer drying models used in agricultural products. Critical Reviews in Food Science and Nutrition 2015 [on line]. [date of consul -Figure 7. Influence of drying temperature on lightness L*, hue
tation: 06 may 2015]. This is a version of an unedited manus -cript that has been accepted for publication. 2015. Available on: http://dx.doi.org/10.1080/10408398.2014.910493.
Herman E., De la Cruz J., García M.A. Prediction of pineapple sorption isotherms using the Ross equation. Drying Technolo-gy: An International Journal, volume 17 (issues 4-5), 1999: 915-923.
Hossain M.D., Bala B.K., Hossain M.A., Mondol M.R.A. Sorption isotherms and heat of sorption of pineapple. Journal of Food Engineering,volume 48 (issue 2), 2001: 103-107.
Janjai S., Intawee P., Kaewkiew J., Sritus C., Khamvongsa V. A large-scale solar greenhouse dryer using polycarbonate: Mo -delling and testing in a tropical environment of Lao People’s Democratic Republic. Renewable Energy, volume 36 (issue 3), 2011: 1053-1062.
Kader A.A. Pineapple: Recommendations for maintaining postharvest quality. UC Davis. Postharvest Technology Cen -ter, 1996, [on line] [date of consultation: 29 september 2015]. Perishables Handling #88. Available in: http://postharvest.uc
-davis.edu/PFfruits/Pineapple/.
Kingsly A.R.P., Balasubramaniam V.M., Rastogi N.K. Effect of high-pressure processing on texture and drying behavior of pineapple. Journal of Food Process Engineering, volume 32 (is -sue 3), 2009: 369-381.
Koua K.B., Fassinou W.F., Gbaha P., Toure S. Mathematical modelling of the thin layer solar drying of banana, mango and cassava. Energy, volume 34 (issue 10), 2009: 1594-1602.
Nicoleti J., Telis-Romero J., Telis V. Air-drying of fresh and osmo -tically pre-treated pineapple slices: Fixed air temperature ver -sus fixed slice temperature drying kinetics. Drying Technology, volume 19 (issue 9), 2001: 2175-2191.
Olanipekun B.F., Tunde-Akintunde T.Y., Oyelade O.J., Adebisi M.G., Adenaya T.A. Mathematical modelling of thin-layer pi -neapple drying. Journal of Food Processing and Preservation, 2014; 1-11 [on line]. Available on: https://onlinelibrary.wiley. com/doi/abs/10.1111/jfpp.12362.
Pathare P.B., Opara U.L., Al-Said F.A. Colour measurement and analysis in fresh and processed food: A review. Food and Bio-process Technology, volume 6 (issue 1), 2013: 36-60.
Ramallo L.A. and Mascheroni R.H. Quality evaluation of pi -neapple fruit during drying process. Food and Bio product pro-cessing, volume 90 (issue 2), 2012: 275-283.
Simal S., Femenia A., Castell-Palou A., Roselló C. Water desorp -tion thermodynamic properties of pineapple. Journal of Food Engineering, volume 80 (issue 4), 2007: 1293-1301.
Talla A., Jannot Y., Nkeng G.E., Puiggali J.R. Experimental deter -mination and modelling of sorption isotherms of tropical fruits: Banana, Mango, and Pineapple. Drying Technology, vo -lume 23 (issue 7), 2005: 1477-1498.
Suggested citation: Chicago style citation
López-Cerino, Ignacio, Irineo Lorenzo López-Cruz, Marcus Nagle, Busarakorn Mahayothee, Joachim Muller. Thin layer drying of Pi-neapple (Ananas comosus, L.). Ingeniería Investigación y Tecnología, XIX, 03 (2018): 329-342.
ISO 690 citation style
López-Cerino I., López-Cruz I.L., Nagle M., Mahayothee B., Muller J. Thin layer drying of Pineapple (Ananas comosus, L.). Ingeniería Inves-tigación y Tecnología, volume XIX (issue 3), July-September 2018: 329-342.
abouttheauthors
López-Cerino Ignacio. Studied the major of Agricultural Mechanical Engineer, a Master Degree in Automatic Control and a PhD of Agricultural Engineering and Integral Use of Water. In 2015 visited for one year the Hohenheim University in Stuttgart, Germany. Two and a half month doing solar drying experiments research at the Silpakorn University in Bangkok, Thailand, invited by the Prof. Dr. S. Janjai. One year working in private company doing research on the drying of agricultural product with greenhouse solar drying.
López-Cruz Irineo Lorenzo. Got his PhD in Agricultural Engineering at the Wageningen University (The Netherlands, 1997-2002). Master Degree in Artificial Intelligence at the Arturo Rosenblueth Foundation (México, 1990-1992). Has held two re -search stays at Humboldt University (Berlin, 2009-2012). Professor re-searcher at the Graduate Agricultural Engineering Program of the University of Chapingo, Mexico. Member of the National System of Researchers of CONACyT (level II). Nagle Marcus. Got his PhD in Agricultural Sciences by the University of Hohenheim
and is lecturer for the postharvest technology section of its Institute of Agricultu -ral Engineering, Tropics and Subtropics Group. His main interests are the study of drying technologies and application of sensors and renewable energies in drying processes. He dedicated his doctoral thesis to explore the optimization of drying technologies for high-value fruit crops. He has worked in several interna -tional projects on solar drying for various crops as well as development of new solar drying technologies.
Mahayothee Busarakorn. Prof. Mahayothee comes from the Silpakorn University, Thai -land. She started her academic career with a B.Sc. and a M.Sc. in Food Technology at the Chulalongkorn University, Thailand. In 2005 she earned his PhD in Natural Science / Food Technology at the University of Hohenheim. In October 2013, Prof. Dr. Busarakorn Mahayothee joined the FSC in Hohenheim as a visiting professor. Currently is at the Silpakorn University, Bangkok, in the Department of Food Technology.