C
C
|
E
E
|
D
D
|
L
L
|
A
A
|
S
S
Centro de Estudios
Distributivos, Laborales y Sociales
Maestría en Economía Universidad Nacional de La Plata
Poverty among the Elderly in Latin America and the
Caribbean
Leonardo Gasparini, Javier Alejo, Francisco Haimovich,
Sergio Olivieri y Leopoldo Tornarolli
Background paper for the World Economic and Social Survey 2007 The World Ageing Situation
Poverty among the Elderly
in Latin America and the Caribbean
*Leonardo Gasparini **
Javier Alejo Francisco Haimovich
Sergio Olivieri Leopoldo Tornarolli
CEDLAS***
Universidad Nacional de La Plata
Abstract
This paper provides evidence on the incidence of poverty among the elderly in Latin America and the Caribbean, based on household survey microdata from 20 countries. The situation of older people is characterized in terms of income, employment, education, health and access to services vis-à-vis the rest of the population. The paper identifies the role played by the current pension systems in Latin America, and assesses the efforts needed to achieve substantial improvements toward the reduction of old-age poverty.
Keywords: elderly, ageing, poverty, Latin America, Caribbean
* We are very grateful to Ana Cortez, Robert Vos, Oliver Paddison, Marva Corley, Codrina Rada, and
Diane Horton for valuable comments and suggestions. We also thank Luis Lima, Georgina Pizzolitto, Pablo Gluzmann, Ana Pacheco, Rocío Carbajal, Gimena Ferreyra, Luis Casanova, Carolina García Domench, Ezequiel Molina, Adriana Conconi and Martín Guzmán for excellent research assistance. The usual disclaimer applies.
** Corresponding author: [email protected]
*** CEDLAS is the Center for Distributional, Labor and Social Studies at Universidad Nacional de La
1. Introduction
Poverty has a relevant age dimension. Both needs and income potential change over the life cycle, modifying the probability of falling into poverty. This paper is focused on the situation of the elderly relative to the rest of the population. In developed countries the combination of strong social security systems, well-developed capital markets, and small households contribute to higher living standards for the elderly, relative to the rest of the population. These conditions are not replicated in many developing countries, where pensions systems are weak and mostly favor the non-poor, the long-term formal credit market is almost inexistent, and the elderly usually live in large extended households sharing the budget with a large number of children.
Identifying the extent to which older persons are affected by poverty vis-à-vis the rest of the population is essential to include the age dimension into social policy discussions. Unfortunately, the task of measuring relative poverty across age groups is plagued by methodological problems and data limitations. Moreover, these limitations do not bias the results in only one direction: old age poverty may be higher or lower than what the statistics show.
This paper is aimed at assessing the situation of the elderly in terms of income poverty and other dimensions of well-being in Latin America and the Caribbean (LAC). The evidence is drawn from a large database of household surveys from 20 LAC countries. To our knowledge this is the first large-scale study that focuses on the poverty situation of the elderly in Latin America based on a large comparable set of household surveys.
closes the paper with an assessment of the results and their policy implications toward the aim of mitigating old age poverty.
2. The elderly in Latin America and the Caribbean
The population ageing process all over the world is a well-acknowledged fact. Latin America and the Caribbean have not been the exception from this widespread
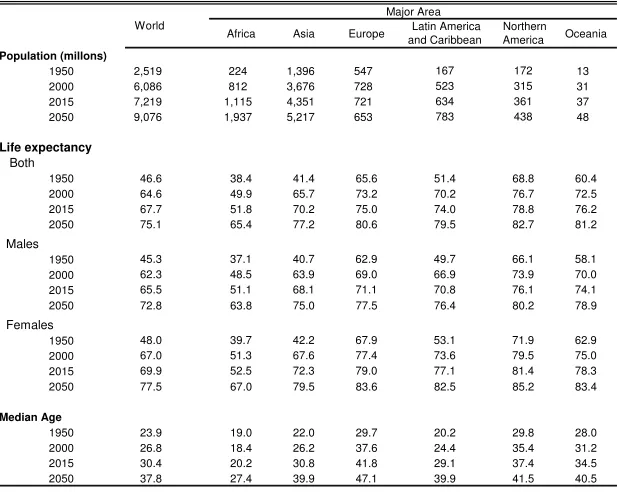
phenomenon. According to the United Nations World Population Prospect, the life
expectancy in the region will grow 55% between 1950 and 2050: a person who will be born in 2050 will live 28 years more than a similar person who was born in 1950 (see table 2.1). In fact, life expectancy has been growing in LAC at rates above the world mean.
In LAC, as in the rest of the world, the gender gap in terms of life expectancy has widened in favor of women in the last 50 years (from 3.4 years in 1950 to 6.7 years in 2000). That gap is expected to slightly shrink in the coming decades, due to a more intense fall in the male mortality rate.
The fact that the world, and Latin America in particular, are ageing is clear from the last panel of table 2.1. The median age of the world population has increased from 23.9 to 26.8 since 1950, and it is expected to grow to 37.8 by 2050. The speed of the ageing process has been faster in Latin America compared to the rest of the world, and it is expected to continue being faster in the following decades. In fact, while in 1950 the average Latin-American was almost 4 years younger than the average person in the world; in 2015 a typical inhabitant of Latin America will be 2 years older than the world average.
Another way to illustrate the ageing process is by dividing the population in age brackets. We consider four groups: <15, 15-24, 25-59, and +60, and label the latter group as the elderly. This definition, although entirely arbitrary, is useful for the analysis, as any reasonable alternative definition not based only in age is almost impossible to implement with the usual data at hand. We follow the general practice in LAC to define the elderly as those aged 60 or more. In some sections of this document we assess the robustness of the results to changes in that threshold.
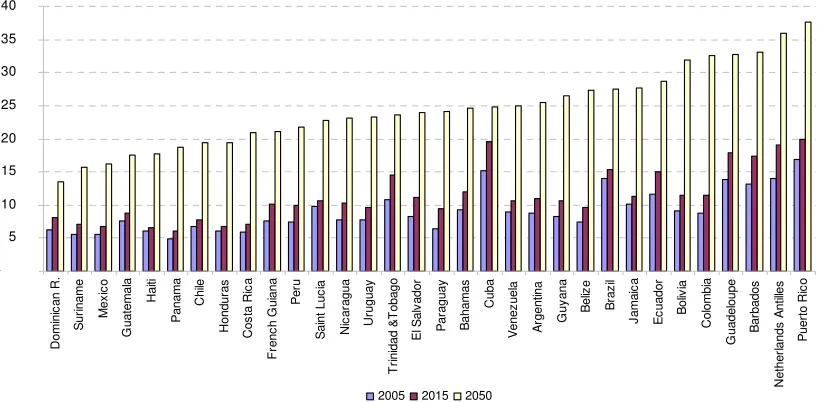
The ageing process discussed above has implied a substantial increase in the share of older people in the population (see figure 2.1). This pattern holds in every continent, but it is particularly significant in Europe. In LAC the share of the elderly in the population increased from around 6% in 1950 to more than 8% in 2000, while it is expected to reach 24% at the end of the century. This ageing process implies an estimate of around 200 million people older than 60 in LAC by 2050.
will continue to enlarge during the first two decades of the new millennium (reaching a value 4 times bigger than in 1950), and then probably will start shrinking (Figure 2.2).
The intensity of the population ageing process has been heterogeneous across LAC countries. Figure 2.3 illustrates this heterogeneity by showing the annual growth rate of the population ratio +60/<60 in each LAC country. That ratio has substantially increased in Argentina, Venezuela and Cuba, while it almost has not changed in Mexico, Costa Rica and Nicaragua. Only two LAC countries experienced a substantial fall in the ratio +60/<60: Paraguay and Haiti.
The current (2005) and the estimated future (2015 and 2050) population share of the elderly in each LAC country is displayed in figure 2.4. In all countries the share of the elderly is expected to substantially grow in the coming decades. All LAC societies will have to face the challenges related to an ageing society in the near future. However, as this and the previous figures show, the intensity of these challenges will vary across countries.
Socio-demographic characterization of the elderly
In order to get deeper into the analysis of the socio-economic situation of the elderly in LAC we need to go beyond the basic demographic information included in Census, and use microdata from household surveys. In the rest of the paper we present a socio-economic characterization of older people in LAC based on a large database of
household surveys from 21 countries: the Socio-Economic Database for Latin America
and the Caribbean (SEDLAC), assembled by CEDLAS (Universidad Nacional de La Plata) and the World Bank’s LAC poverty group (LCSPP). SEDLAC includes more than 150 household surveys in 20 countries: Argentina, Bolivia, Brazil, Colombia, Costa Rica, Chile, Dominican Republic, Ecuador, El Salvador, Guatemala, Haiti, Honduras, Jamaica, Mexico, Nicaragua, Panama, Paraguay, Peru, Uruguay and Venezuela. For this paper we select a sample of surveys corresponding to the latest observation in each country (see table 2.2).
The sample covers all countries in mainland Latin America and three of the largest countries in the Caribbean – Dominican Republic, Haiti and Jamaica. In each period the sample of countries represents more than 92% of LAC total population. Most household surveys included in the sample are nationally representative. The main two exceptions are Argentina and Uruguay, where surveys cover only urban population, which nonetheless represents more than 85% of the total population in both countries.
The share of the elderly in the population is larger in rural areas than in cities (Figure 2.6). One possible reason behind this fact is that urban areas offer a wider range of labor possibilities for younger people, which may encourage them to migrate into those areas in order to improve their socio-economic situation.
Table 2.4 shows the population ratios between the elderly and the rest of the population in each country. On average, the elderly are 32% of the children (<15). Figure 2.7 shows the heterogeneity within LAC. While in Uruguay the number of older people is roughly the same as the number of children (<15), in Guatemala the proportion is 1 older people for around 8 children. As expected, the population ratio elderly/children is greater for women than for men. In Uruguay, for instance, there are 15% more older women (>60) than girls (<15), but there are 25% fewer older men than boys.
As expected from the differences in life expectancy shown above, the gender structure differs by age group. In almost all countries the share of women among older people is substantially larger than the corresponding share for the youth (figure 2.8). The average masculinity index, defined as the ratio between the male population and the female population, is 13% higher for the youth (0.97) than for the elderly (0.86) (table 2.5).
Older people tend to live in households of smaller size than younger people (table 2.6). On average in LAC, the elderly live in households with 1.5 persons less than the rest of the population. This gap varies from 1 person in Colombia and Venezuela to around 2 in Guatemala, Argentina and Bolivia. Even though the average family size in rural areas is larger than in cities, we do not find significant differences within the older population (figure 2.9.b).
Table 2.7 helps us to learn on the type of households where the elderly live. On average in Argentina a typical older people lives in a household with 1.37 older people (counting herself), 0.77 adults, 0.26 youngsters and 0.28 children. There is not much variation across countries in the number of people older than 60 living in households with older people (from 1.40 in Peru to 1.25 in Nicaragua). Differences are sharp in terms of children and adults. The average old person in Venezuela lives with 1.52 adults, while the average old Uruguayan lives with 0.64 adults. In rural areas the average LAC old person lives with 20% more children than in cities.
Around a quarter of all LAC households are headed by an older person. Once again there are dissimilarities within the region. For instance, older household heads in Bolivia represent 17% of all heads, while in Argentina and Uruguay that proportion goes up to 31% and 41%, respectively (table 2.8). In rural areas the share of older household heads is higher than in urban areas (figure 2.10.b).
3. Old age poverty
poverty to that of income deprivation. In section 4 we extend the analysis to other relevant variables as education, health, housing, water, sanitation, and labor market opportunities.
An individual is considered as poor if her living standard indicator is lower than a given threshold, known as the poverty line. The practical implementation of this definition requires the choice of a proxy for the individual well-being and a poverty line. Most of the economic literature suggests using household consumption adjusted for demographics as the welfare variable, and a poverty line that combines a certain threshold (largely arbitrary) in terms of consumption of calories, with the consumption habits of the population, and the domestic prices of goods and services.1
Although household consumption is a better proxy for welfare than household income, in this study we follow the literature in LAC and use income as the well-being indicator. A simple reason justifies this practice: few countries in the region routinely conduct national household surveys with consumption/expenditures-based questionnaires, while all of them include questions on individual and household income.
The elements needed to construct a poverty line are idiosyncratic to each community, a fact that leads to wide differences in the national lines across countries, and introduces serious comparability problems. For this reason cross-country comparisons are usually made in terms of some simple international line. The most popular one is the USD1-a-day line proposed in Ravallion et al. (1991). It is a value measured in 1985 international prices and adjusted to local currency using purchasing power parities (PPP) to take into account local prices. The USD 1 standard was chosen as being representative of the national poverty lines found among low-income countries. The line has been recalculated in 1993 PPP terms at USD 1.0763 a day (Chen and Ravallion, 2001). The USD-2-a-day line is also extensively used in comparisons across middle-income countries, like most in LAC. Although the USD-1 or 2-a-day lines have been criticized, their simplicity and the lack of reasonable and easy-to-implement alternatives have made them the standard for international poverty comparisons.2 For instance, the United Nations’ Millennium Development Goal 1 – eradicate extreme poverty and hunger – is stated in terms of USD-1-a-day poverty – halving between 1990 and 2015 the proportion of people whose income is less than USD 1 a day.
The measurement of poverty among the elderly poses some additional relevant problems. The first one is related to the lack of consumption data. Some older people may be living on the assets they accumulated during their lifetimes. The sale of an asset is not usually included as current income, and then not considered in a poverty analysis. While this could be the proper practice for, say, a young adult that sells his car to later buy a new one, it might be incorrect for an older person who periodically sells assets to keep his/her living standard.
1 See for instance Deaton and Zaidi (2003).
2 See Srinivasan (2004), Kakwani (2004) and Ravallion (2004) for a discussion on the merits and
An additional problem is posed by the fact that resources may be unevenly allocated within households. The typical information included in an income-based household survey does not allow identifying the specific allocation scheme adopted by each household. For these reason the usual practice is to assume complete within-household equality in living standards.
Another relevant problem arises from the fact that older people usually live in households with a significantly different demographic structure than the rest of the population, as documented in the previous section. That difference makes the poverty comparisons between the elderly and the non-elderly population highly dependent on the assumptions about the impact of the household structure on individual well-beings. In particular, older people tend to live in households of smaller size, which impedes them taking advantage of the household consumption economies of scale.
In summary, although we recognize that poverty is a multidimensional complex problem, data limitations restrict this paper (and most of the literature) to simply consider the poor as those individuals living in households whose per capita income is lower than a certain international poverty line in terms of PPP dollars. Most researchers and practitioners seem to agree that this is a reasonable approximation to a complex problem. In this paper we use that widespread definition and assess the robustness of the results to some methodological changes (economies of scale, adult equivalents and consumption data).
Evidence
We provide evidence on poverty by age groups for a sample of 20 LAC countries. Evidence is drawn from microdata of the SEDLAC database described in section 2. Even after agreeing on the income variable and the poverty line, a large number of methodological problems should be solved to compute poverty in each country. Specific details on methodological issues could be found in the SEDLAC web page.3
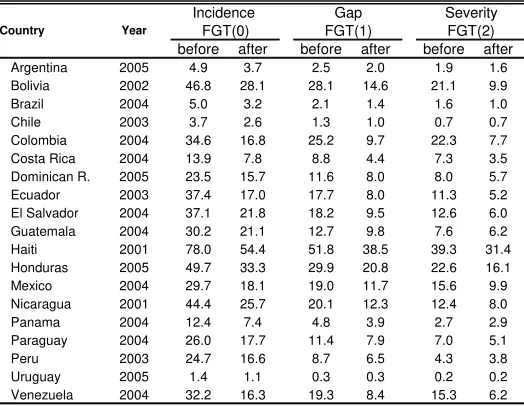
Poverty rates significantly differ across LAC countries. Table 3.1 shows the headcount ratios for the USD2-a-day poverty line. While the share of persons with household per capita income below that line is 5.1% in Chile, the share climbs to 78% in Haiti. Poverty is substantially higher in rural areas.4
The correlation between national poverty and poverty in any age group is very high. For instance, the linear correlation coefficient for the case of the elderly (older than 60) is 0.95. Figure 3.1 illustrates this close relationship. It is interesting to notice that most points lie close but below the 45° line, implying lower poverty rates for the elderly when compared to the rest of the population. That is the case in both urban and rural areas. This piece of evidence does not imply that poverty is always decreasing in age. In
3 www.depeco.econo.unlp.edu.ar/cedlas/sedlac
4 See Cicowiez
fact when compared to the adult population in most countries poverty is higher for the elderly (figure 3.2). Defining the elderly as those older than 60 or those older than 65 does not make a significant difference.
To further document the age-poverty profile in figure 3.3 we show non-parametric (kernel) estimates of the poverty headcount ratio by age in each LAC country. The curves are clearly downward sloped along all the age range for the set of Southern Cone countries (Argentina, Brazil, Chile and Uruguay). In contrast, for the rest of the countries poverty is clearly decreasing only until around the age of 40, and then becomes either constant (e.g. Paraguay, El Salvador, Nicaragua), slightly increasing (e.g. Bolivia, Ecuador, Venezuela) or substantially increasing (e.g. Colombia, Mexico). For the South American countries with well-developed pensions systems poverty reaches its minimum levels in the older age brackets (table 3.2). In Argentina and Chile the poverty rate for those older than 60 is around a third of the poverty rate for the total population. That proportion drops to 20% in Brazil and just 10% in Uruguay. In contrast, in some other LAC countries old age poverty is more than 20% higher than the national rates. That is the case of Jamaica and Mexico.5
The shape of the age-poverty profiles is surely dependent on factors like the extent of the pension system and the age-education profile. We postpone a discussion on these factors to first investigate another likely determinant of the poverty gaps by age: the demographic structure of households.
The role of the demographic structure
So far, we have measured poverty using per capita income as the individual well-being indicator. It has long been argued that needs differ across age groups and that households can take advantage of their size by exploiting consumption economies of scale (Deaton, 1997). These economies allow a couple to live with less than double the budget of a person living alone.6 According to this approach individual well-being is proxied by total household income deflated by an equivalence scale, defined as a function of the size of the household and its demographic composition. There is a long-standing literature on equivalence scales (see Deaton and Paxson, 1998). We follow the
approach of Buhmann et al. (1988) and Deaton and Paxson (1997) by assuming a
parametric form for the equivalence scale and examining the consequences of changing the parameters. In particular, we assume that the living standard of an individual i living in household h is given by
θ α
α )
( 1C1 2C2 A
Y
x h
ih = + +
5 Notice that although the ratio in Costa Rica is high, the difference in poverty points is small, and even
probably not significant.
where A is the number of adults, C1 the number of children under 5 years old, and C2 the number of children between 6 and 14.7 Parameters α allow for different weights for adults and kids, while θ regulates the degree of household economies of scale. When
θ=1 there are no economies of scale, while in the other extreme when θ=0, there are full economies of scale, meaning that all goods in the household could be shared completely (i.e. they are all public goods, with no rivalry in consumption). In very underdeveloped economies where people spend nearly all their income in food, there is no much scope for economies of scale (a potato eaten by one member of the household cannot be eaten by another member). In developed economies where a much larger share of the budget is spent in housing, entertainment and other goods easier to share, consumption economies of scale are more important. Following the suggestion of Deaton and Zaidi (2002) for middle-income countries like those in LAC we take intermediate values of the αs (α1=0.5 and α2=0.75) and θ (0.8) as the benchmark case.
To illustrate the adjustment for economies of scale, consider two households, labeled as A and B, for simplicity comprised only by adults, with the same household per capita income ($1000) but with different household size (2 persons in A and 5 persons in B). Using θ=0.8 implies that, despite per capita income is the same in both households, equivalized income is 20% higher in household B ($1380 in B, and $1149 in A).
Notice that in the same way as in the above example, countries where family arrangements imply larger households can take advantage better of the consumption economies of scale, even with a common parameter θ. In addition, one can assume or estimate different parameters θ across countries based on different consumption budget structures (see Deaton, 1997), but this is well beyond the scope of this paper.
In practice it is convenient to work with a transformation of the above equation to make poverty estimates comparable to those obtained with household per capita income and the USD-2-a-day line. The need for an adjustment comes from the fact that by deflating
by instead of by just the number of family members ,
the indicator of individual welfare x
θ α
α )
( 1C1+ 2C2 +A (C1+C2 + A)
ih increases, and then poverty estimates go down. We alleviate (although not eliminate) this nuisance by following the procedure suggested by Deaton and Paxson (1997), and multiplying the above equation by
, where C
) /(
)
( 0 0
2 0 1 0 0 2 2 0 1
1C + C +A C +C +A
θ
α
α 10, C20 and A0 are the number of
children under 5, children between 6 and 14 and adults in the “base” household. We take the average number of children and adults in each country to construct the base family.
Table 3.3 shows older people relative poverty using four alternative income variables: (i) per capita household income, (ii) household income per adult equivalent, (iii) household income adjusted for economies of scale, and (iv) household income per adult equivalent adjusted for economies of scale. The consideration of these demographic
7 Van Praag has suggested the possibility of using different weights for the elderly as their nutritional
needs may be lower than those of the adult population. The argument loses strength when expanding the
factors implies an increase in the relative poverty of the elderly. As seen in section 2 older people live in smaller households, and then they are not able to take advantage of consumption economies of scale. Also, the increase in equivalized income after the adjustment for the lower needs of children does not particularly favor the elderly, who on average live in households with a smaller number of children.
Figure 3.4 illustrates the change in poverty when carrying out the adjustments. Relative old age poverty significantly increases in Bolivia and Mexico when considering adult equivalents and economies of scale. The effect goes in the same direction in the cases of Argentina and Brazil, although the impact is quantitatively less relevant. This is not surprising, given the smaller household size (and number of children) in Argentina and Brazil, compared to Bolivia and Mexico.
The impact of considering different parameters for economies of scale is analyzed with the help of Table 3.4 and Figure 3.5. As the parameter goes from 1 to 0 consumption economies of scale internal to the household turn more important, and relative old age poverty increases in all countries. In many countries the sign of the poverty comparison between the elderly and the rest does not depend on the parameter of economies of scale (given the adult equivalent scale used). For instance, in Bolivia old age poverty is always higher than national poverty, while the opposite is true in Brazil, regardless of the degree of economies of scale. In some other countries the sign of the difference depends on the parameter: that is the case of Guatemala, El Salvador, Nicaragua, Paraguay and Venezuela. The curves for other countries like Argentina and Chile also cross the unity line, although they do so at improbable values of the parameter of economies of scale.
Characterizing poverty-age profiles
As shown above, old age poverty substantially differs across LAC countries. Countries are different not only in terms of total old age poverty, but what is more relevant for this study, also in elderly poverty relative to the rest of the population. What are the factors behind the country differences in poverty-age profiles? This question is important since it helps to understand why in some countries old age poverty is not a particularly urging problem, at least when compared to poverty for other age groups. Unfortunately, disentangling the complex process leading to old age poverty, even in a single country, is a very difficult topic that goes beyond the scope of this paper. Rather than attempting econometric estimations that will face all sort of data and endogeneity problems, in this section we just show some simple correlations that motivate the possible links between certain characteristics of the economy and old age poverty.
(+60/-60) and the share of old people in the population receiving pension payments. The linear correlation is -0.85 suggesting a strong positive relationship between both variables.8 The relationship is driven by the presence of two clearly different set of countries: those Southern Cone countries with a relatively-well developed pension system where more than half of the population is covered (on average, 66%), and the rest of LAC countries where on average only 14% of the elderly is covered. Within this group the correlation poverty-pensions is not statistically significant.
Older people might be poorer just because they are less educated than the younger generations. As will be documented in the next section, all LAC countries have experienced an education upgrading process which implies that younger people are more skilled and hence better prepared for the labor market. The second panel in figure 3.6 shows that there is a positive relationship between relative old age poverty and the gap in years of education between the elderly and the adult population. The correlation coefficient however is small and barely significant (0.27).
As argued above, the size of the household could be linked to the degree of income poverty. The third panel of figure 3.6 shows the scatter plot of relative old age poverty and the gap in household size between those older than 60 and the rest of the population. In countries where that gap is large, that is where older people live in households substantially smaller than younger people, relative old age poverty is lower. However, this positive link is entirely driven by two countries, Argentina and Uruguay, with low old age poverty and family arrangements such that a large fraction of the elderly, many of whom receive pension payments, lives alone. The linear correlation coefficient is 0.42; it falls to 0.34 when computing poverty with household income adjusted for economies of scale and adult equivalents, and vanishes to zero when deleting Argentina and Uruguay from the sample.
In a cross-country regression (with only 20 observations!) the coefficient of the size of the pension system is always significant, even when controlling for education and household size. In contrast, when controlling for the pension system the coefficients of education and household size become non-significant. In summary, this preliminary evidence suggests that there exists a strong negative relationship between relative old age poverty and the development of the pension system. The evidence about the links between old age poverty with education and household size is weaker.
Older people in the income distribution
Table 3.5 shows the distribution of people older than 60 across quintiles of the income distribution. The elderly are over-represented in the top quintile of the household per capita income distribution in all countries, except Jamaica. When considering the distribution of equivalized household income (θ=0.8, α1=0.5, α2=0.75) the elderly
8 The correlation coefficient is -0.87 when computing relative poverty as +60/-15, and -0.85 when
become under-represented in five countries. While in the first panel the share of old people in the top quintile exceeds 25% in 15 countries, that number falls to 5 countries in the second panel. When using equivalized income as the welfare indicator, in more than half of the LAC countries the share of the elderly in the bottom quintile is larger than 20%, implying over-representation of older people among the poorest.
Another way of showing the location of the elderly in the income distribution is through concentration curves. Each curve shows the cumulative share of the elderly for the
poorest p percent of the population. Figure 3.7 shows these curves for a sample of
countries. If the curve lies above the diagonal (the perfect equality line) means that the distribution of older people is biased toward the low-income strata. Suppose the government implements a transfer of $1 to each old person. That policy will be pro-poor (pro-rich) in those countries where the concentration curve lies above (below) the diagonal.
Some results are worth mentioning. First, the curves do not locate too far from the diagonal, meaning a not particularly biased distribution of the elderly in the population. Second, there is not a homogeneous location of the concentration curves across LAC economies. In some countries the curves lie below, in others above, and in others they cross the diagonal.
Box 3.1: Income vs. consumption poverty. The case of Nicaragua
In this box we illustrate the differences between income and consumption poverty of the elderly vis-à-vis the rest of the population, using the Living Standard Measurement Survey of Nicaragua, 2001. This LSMS is one of the few Latin American surveys with reliable information on both income and consumption. The following table shows the ratio of poverty levels between age groups using the two alternative indicators of well-being.
Relative poverty
60 +/<60 60+/<15
income poverty 0.82 0.70
consumption poverty 0.78 0.66
Source: own calculations based on the EMNV 2001.
Box 3.2 Subjective poverty and the elderly. The case of Colombia
An alternative approach to determine whether a person achieves a minimum standard of living consists in asking if they consider themselves to be poor. It is interesting to study whether subjective poverty is higher among the elderly, independently of objective measures of deprivation.
Colombia’s Encuesta de Condiciones de Vida asks household heads (or their spouses) whether they would rate themselves as poor. Figure B3.2 illustrates the relationship between self-assessment of welfare and age. As people age, the negative perception of their economic well beings tends to slightly increase.
Whereas on average around 66% of people aged 25 to 59 consider themselves as poor, that share increases to 70.3% for people older than 60 (table B3.1). Notice that around 90% of the elderly living in rural areas are poor under this subjective measure.
For people older than 25, we estimate a basic probit model for the probability of being poor according to the subjective perceptions of individuals. The set of control covariates includes two age dummies (“old people” is the omitted category), a gender dummy, a set of educational dummies, an urban dummy, household size and dummies regarding labor status. As table B3.2 shows, once controlling by observable characteristics the conclusions are different. The likelihood of rating oneself as poor is not significantly different for the elderly and adults aged 50 to 59. Moreover, individuals between 25 and 49 years old are more likely to be poor according to this approach than old people. The higher non-conditional likelihood of being poor of the elderly seems to be due to differences in other observable characteristics, like educational levels. The other estimated coefficients, in general, show the expected sign.
Inequality
Is income inequality higher among the elderly? The answer seems to depend again on the relevance of the pension system in each country. Table 3.6 shows that the Gini coefficient for the income distribution among the elderly is lower than for the rest of the population in Argentina, Brazil, Chile and Uruguay. The results are robust to the change in the individual well-being indicator.
vanishes (the linear correlation coefficient becomes non-significant). Similar results arise when using the share of older people in the population instead of mean age. At least in the context of LAC where pension systems are poorly developed, the equalizing effect of an ageing society does not show up, at least at a first glance.
Old age poverty in the developing world
The evidence on relative old age poverty in the developing world is still too scarce and non-systematic to identify a clear pattern. Comparisons across studies are mined by all sort of methodological problems, arising from the choice of different poverty lines, different measures of well-being, and different definitions of later life (Barrientos et al., 2003). But even within a specific study patterns are not easy to identify. As we have found for the case of Latin America, other studies report that in other regions of the developing world while in some countries old age poverty is lower, in others it is higher than national poverty. Moreover, the results of these comparisons are affected by the assumptions on economies of scale and adult equivalents (Lanjouw et al., 1998). In contrast to the mixed results for the developing world, most studies find that in advanced economies poverty is significantly lower among older people (Whitehouse, 2000).
In table 3.7 we reproduce some results of previous studies on developing countries. Deaton and Paxson (1997) conducted a detailed analysis of old age poverty for countries of different regions, while Grootaert and Braithwaite (1998) and Lanjouw et
al. (1998) use information from the Household Expenditure and Income Data for
Transition Economies. In none of these studies a clear pattern for old age poverty arises. In a recent study Kakwani and Subbarao (2005) find that while poverty is higher among households with older persons (particularly in rural areas) in Malawi, Uganda and Zambia, this is not the case in Madagascar, Mozambique and Nigeria, where children were assessed to be in worse situation. Based on these pieces of evidence Barrientos et al. (2003) conclude that “poverty in later life broadly reflects aggregate poverty”. This conclusion seems correct on average, but does not apply to many countries, as table 3.7 and the LAC evidence shown in this paper suggest.
4. The socioeconomic situation of the elderly
discussed above, these biases may distort the poverty comparisons between the elderly and other age groups.
In this section we examine the socioeconomic situation of the elderly compared to the rest of the population in terms of access to the labor market, housing, basic infrastructure, education and health, by exploiting the dataset of household surveys introduced above. We begin by exploring labor opportunities which provides an additional understanding of structural poverty, and give us further insight into income deprivation of the elderly.
Access to the labor market
One of the main assets of poor people is their capacity to carry out unskilled work both in market activities and in home production. Compared to the non-poor, the work performed by the poor involves, in general, a greater amount of physical strength. As people age, their ability to perform this kind of tasks diminish, affecting their capacity to keep a job or to get another one, exacerbating poverty.
In order to explore the access of the elderly to the labor market we start by computing labor force participation rates for different age groups in all the countries in our sample. Table 4.1 shows that in all countries the elderly are less likely to be in the labor force than adults aged 25 to 59. The largest differences, in general, correspond to countries with stronger pension systems (Argentina, Brazil, Chile, Costa Rica, Panama and Uruguay). In these countries the age gap in labor market participation, which exceeds 45%, is mainly driven by the lower participation rate of older people, since in those economies the participation rate of adults is similar to the regional average.
Explaining the participation choices of the elderly is an extremely complex issue that goes beyond the scope of this paper. In this section we just carry out an exploratory analysis of this topic. A reasonable starting point is to compare the participation rate of old people receiving pension payments with those who are not receiving these payments. As expected, the columns (v) to (vii) of table 4.1 suggest that the former are less likely to be in the workforce in all the countries. This could be due to legal requirements to stop working once retired, or just to different labor dynamics of old age pensioners. The differences are larger than 30 percentage points in the cases of Argentina, Bolivia, Haiti and Uruguay.
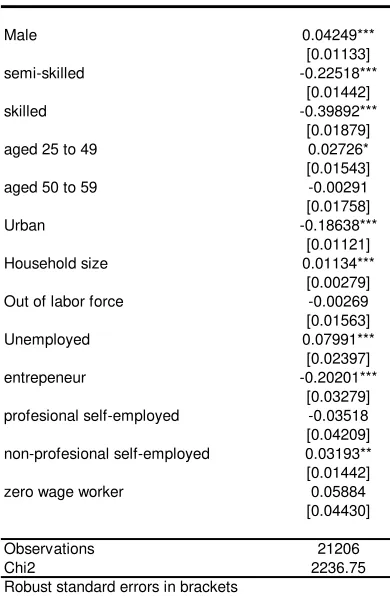
To further analyze this issue we estimate binary choice models for the labor force participation of older people.9 These models are aimed at estimating the likelihood of the elderly of being employed or actively seeking for a job.10 We include as independent variables two dummies identifying old people receiving different kinds of non-labor
9 We restrict the sample to those surveys with appropriate information for estimating those models.
10 The dependent variable is a dummy with value 1 if the individual is employed or unemployed, and 0 if
income (pensions payments and other non-labor income), a set of educational dummy variables (“at most 8 years of formal education” is the omitted category), age, marital status, a gender dummy, household size, the number of household members with positive income (without including the analyzed individual) and a set of regional dummies. Table 4.2 displays the marginal probabilities of being part of the labor force obtained from the probit regressions. Consistently with the non-conditional analysis, we find that receiving pension payments significantly reduces the likelihood of being in the workforce. In general, other non-labor incomes also decrease this likelihood (except in some few countries), but it is quantitatively less important, presumably because pensions represent most of non-labor income in many countries. Besides, in most cases the number of household members receiving income significantly decreases the likelihood of being in the workforce. This is consistent with the previous result. Other relatives working or receiving non-labor income provide a safety net (in some way similar to pension payments), which could make work for surviving not necessary. On the other hand, it is interesting to notice that among the elderly, in most cases, those who live in rural areas or are skilled (more than 13 years of formal education) are more prone to be in the labor force.11
We now turn to the analysis of the age differences in the employment rate. Table 4.3 shows that old age employment is much lower that the national means. Obviously, this could be a sign not only of the higher difficulty of finding jobs for the elderly, but also of retirement choices. Some of the older people just choose not to work. Moreover, a large employment share of the elderly is not necessarily a social encouraging sign. In fact, this could be the consequence of the lack of a strong social security system.12 In countries such as Argentina, Chile, and Uruguay, which have relatively developed social security systems, the employment rate of the elderly reaches the lowest values in our sample. In these countries, the average share of older people employed is around 25% (the lowest being Uruguay with 17%). In contrast, the highest rates correspond in general to poorer countries without extended pension systems (Bolivia, Guatemala, Honduras, Haiti, Paraguay).
So far, we have shown that the elderly are less likely to be employed, but they are also more likely to be out of the labor market. Since the rate of unemployment is defined as the share of economically active people who are out of work and seeking jobs, it is not clear whether the unemployment rate for the elderly is higher or lower than for the rest
11 In most cases there is very little difference between old people with low or intermediate level of formal
education when analyzing participation choices. Increasing the level of qualification from unskilled to semi-skilled does not significantly affect the likelihood of being part of the labor force in 11 out of 17 countries.
12 The participation models explained above contribute with some evidence to this point. We find that
of the population. The evidence from household surveys suggests that in most LAC countriesthe elderly are less likely to experience unemployment (see table 4.4).
As mentioned above, one of the main problems of analyzing unemployment rates of the elderly is that we restrict the analysis to those people in the labor force. Indeed, a large share of old people is not clearly out or in the workforce. Their decision to search for a job is strongly linked to the availability of suitable jobs. In an extreme, if all the elderly sought employment only if they had high chances of obtaining it; their unemployment rate would tend towards zero. This could be one of the reasons behind the lower unemployment rate of the elderly.13
In the third panel of table 4.4 unemployment rates between the poor and the non-poor elderly are compared. In several countries non-poor elderly unemployment is significantly lower than that of the poor. It is important to be cautious about the interpretation of these results. Even though they point to the scarce labor opportunities for the old poor, the differences could be attributable to the interaction among other factors. For instance, many professionals and entrepreneurs that work into later life would receive higher income than the poverty line even if they stopped working (possibly they have saved enough money during adulthood to not need working to survive), but the nature of their work allows them to continue working. In other words, we should not conclude that these people are not poor because of working during old age. Continuing with the example mentioned above, professionals and entrepreneurs usually have more flexible jobs that are not physically demanding, and this could be the reason why they choose to keep on working. There is some evidence pointing out that elderly labor supply is more sensitive to this kind of non-pecuniary benefits (see for example Haider et al., 2001).
Figure 4.1 illustrates that the elderly and adult people differ considerably in their distribution by type of work. The elderly are more likely to be self-employed or entrepreneurs than wage earners.
Table 4.5 reports hourly wages and hours of work for the employed population. As can be seen in the first panel, in LAC the elderly tend to work fewer hours. Only in Nicaragua and the Dominican Republic, are hours worked by old people not significantly different from that of adults aged 50 to 59. The decrease of hours worked over the lifetime is drastic in Argentina, Brazil, Costa Rica, Ecuador, Honduras, Uruguay and Haiti, as illustrated in figure 4.2.
13
Hourly wages are higher for the elderly only in Argentina, Brazil, Chile, and Uruguay (panel II in table 4.5). In all LAC the elderly are over-represented in the lowest quintile of the hourly wage distribution.
Summarizing, in the majority of the countries the elderly face a lower employment rate, and those who are employed tend to work less hours at a lower hourly wage. Likewise, they are more likely to be self-employed or entrepreneurs.
Access to housing and basic infrastructure
Table 4.6 shows statistics regarding housing. It is interesting to notice that, for the most part, the elderly are less likely to be tenants, as well as less likely to live in “poor” areas (i.e. shantytowns). Only in Brazil and Haiti is the share of old people that reside in “poor” areas significantly larger vis-à-vis adults. This is also illustrated in figure 4.3. In contrast, the third panel of table 4.6 shows that in several countries, the elderly are more likely to live in dwellings constructed using low-quality materials. Such is the case of Bolivia, Chile, El Salvador, Guatemala, Honduras, Mexico, Paraguay, Dominican Republic and Haiti. The differences are considerably large in Bolivia, where the elderly are 15% more likely to live in such dwellings than adults aged 25 to 49. The converse is true in the cases of Costa Rica, Nicaragua, Uruguay, Jamaica, and particularly Peru.
The access to basic infrastructure is essential to achieve a minimum standard of living. The access to water, sewerage and hygienic restrooms directly affects individual well-being, and indirectly health status. Clearly, these services play a key role in the household hygiene and in the prevention of water and sanitation-related diseases (like parasitic diseases). The first panel in table 4.7 reports statistics about access to drinking water in the house lot. The elderly seem to have less access to this service in Bolivia, Paraguay and Chile, but are in a better position in Nicaragua, Colombia and Venezuela. In
Peru and El Salvador, the likelihood of having water seems to be related in a non-linear
fashion to age. Older people have more access than adults aged 25 to 49, but less than people aged 50 to 59. In a number of countries, such as Costa Rica and Ecuador, the differences between age groups are not statistically significant. The panorama of the elderly worsens when considering hygienic restrooms. Older people are more likely to live in dwellings without this facility in the cases of Bolivia, Brazil, Chile, Ecuador, El Salvador, Guatemala, Honduras, Peru and the Dominican Republic. Only in Nicaragua, Uruguay and Venezuela the converse is true. When considering the hardships related to sewerage deprivation we find diverse results. In Chile, Ecuador, El Salvador, Honduras, Mexico and Jamaica, the elderly are in a worse situation in this dimension. The opposite occurs in Bolivia, Costa Rica, Nicaragua, Uruguay and Venezuela.
phenomena are a manifestation of the complexity of measuring welfare, and point out the usefulness of considering each attribute in a separate way, together with aggregate measures of well-being.
Education
When analyzing the socioeconomic situation of the elderly, education becomes a key issue. Besides enhancing the likelihood of having a well-paid job (and therefore reducing the chances of suffering from income deprivation), education affects many aspects of life, being a fundamental attribute of individual welfare. For instance, literacy and numeric skills are used in many daily activities, like buying food. Among other scourges, illiterate people suffer from social exclusion and face serious difficulties in accessing to information.
Table 4.8 reports statistics on literacy rates. For all countries the percentage of older people with literacy skills is smaller than that of adults aged 25 to 59. The gap tends to increase when examining rural areas (panel III in table 4.8). When comparing with people aged 25 to 49, the differences are considerably large in Bolivia, Haiti, Honduras and Nicaragua, the poorest countries in the sample. Figure 4.4 suggests a positive correlation between this literacy gap (in absolute terms) and the level of national poverty. In general, the poorer the country, the larger the elderly relative disadvantage in this basic skill. This fact has a positive side, since it reveals the advance of literacy for the younger generations in the poorest countries. The negative side is that the increase in literacy has not included older people, who are left behind regarding this basic skill.
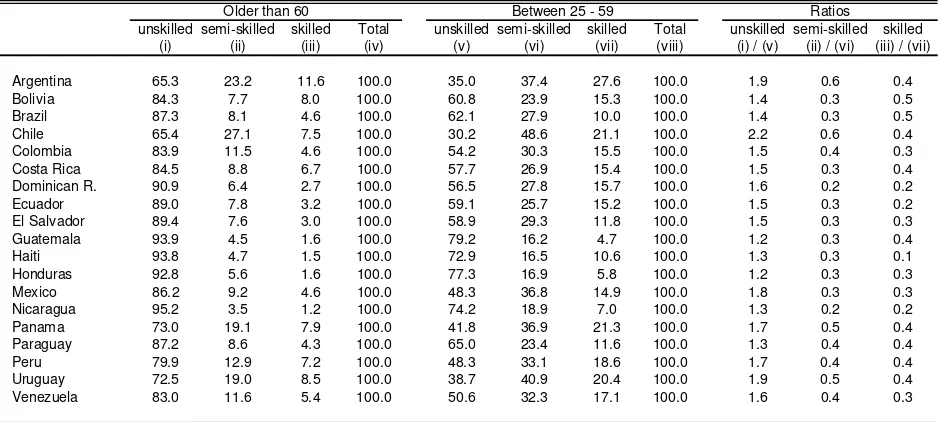
In table 4.9 individuals are classified according to years of formal education in three groups: unskilled (at most 8 years), semi-skilled (9 to 13 years) and skilled (more than 13 years). In countries like the Dominican Republic, Ecuador, El Salvador, Guatemala, Haiti, Honduras and Nicaragua, around 90% or more of older people are unskilled. In all the countries, the likelihood of being in this group is larger for old people, and is around twice as large as that of adults in countries with relatively low levels of poverty like Argentina, Chile and Uruguay (see panel III in table 4.9). A slight negative correlation between national poverty and the ratio between the percentage of unskilled old age and the percentage of unskilled adults is shown in figure 4.5. This suggests that, in contrast to the changes in literacy discussed above, the education upgrading process has been more intensive in the less poor countries in the sample.
An aggregate indicator
substitutes. For instance, deprivation in health may be compensated by a sufficiently high level in another dimension (e.g. education).14 Specifying a welfare function and setting the relevant thresholds allows us to rank people according to their level of welfare and to identify the poor.15
To deal implicitly with this issue, an aggregate indicator of deprivation (usually labeled as NBI – Necesidades Básicas Insatisfechas) is frequently employed by researchers and National Statistics Offices in Latin America. A particular aspect concerning aggregate indicators is that insufficient levels of welfare in one attribute cannot be compensated by improving (even substantially) the other dimensions, i.e. there is no substitutability. A person is considered poor under this approach by not fulfilling at least one of the selected conditions.
We construct an aggregate indicator of deprivation according to the following criteria:16 (i) more than 4 persons per room, (ii) the household lives in “poor” areas (iii) the dwelling is made of low-quality materials, (iv) the household does not have access to water in the lot, (v) the dwelling does not have an hygienic restroom, (vi) the household head does not have a primary school degree (vii) the household head does not have a high-school degree, and there are more than 4 household members for each income earner. As mentioned above, all persons in a household are considered poor if they meet at least one of these conditions.
The results obtained are shown in table 4.10. It is important to take into consideration that in some countries the information in the household surveys does not allow to implement the seven criteria listed above. For that reason this aggregate indicator should not be compared across countries. Our main objective, however, is to compare this measure within countries and across age groups. In most cases the elderly are more prone to live in poor households according to the aggregate indicator. The more substantial differences are observed in Brazil, Costa Rica, the Dominican Republic and Panama. Table 4.11 examines each condition included in this indicator.17 The result of the disadvantage of the elderly regarding the aggregate indicator is mainly due to differences in terms of education and house material. On the other hand, the indicators related to a large household size (rooms per capita, dependency rates) tend to reduce the gap between the elderly and the rest regarding this aggregate measure of deprivation.
14 See Thorbecke (2005) for a discussion on this point.
15 See for instance Perry
et al (2006), Bourguignon and Chakravarty(2002) and Thorbecke (2005) for
more theoretical references about this issue.
16 See Gasparini (2006) for more details of each criterion.
17 For each criterion we report the difference between the proportion of older people who live in
Box 4.1 Hunger and the elderly
Some countries measure food insecurity using an indirect approach. They estimate the cost of a basic food bundle and then identify the household that cannot afford it. A different approach consists in directly asking about alimentary deprivation. In particular, the United States Department of Agriculture developed a methodology that allows establishing whether a household have enough food according to the perception of the adult members.18 If the converse is true, it is said that the household suffer from hunger.
In order to compare the elderly’s chance of suffering from hunger vis-à-vis that of the rest of the population, we employed this methodology and the component of food security included in a special survey of Argentina.19 This module included 10 questions to assess if the household faces difficulties in satisfying its food needs. The answers to
these questions were employed to construct a hunger indicator.20 In table B4.1,
household are classified according to the age of the head. As it can be seen in the first panel of this table, there are not statistically significant differences in the likelihood of having hunger between different age groups.
Colombia’s ECV allows constructing a more rudimentary indicator of hunger21, but
with the advantage of having a much larger sample size than in Argentina.22 The second panel of table B4.1 shows that the results are similar to those found for Argentina, except for the rural areas. Among rural people, households where the head is old are more likely to suffer from hunger than those where the head is aged 25 to 49.
Health
Health is an important dimension of poverty. Poor people usually suffer from precarious sanitary conditions. This not only directly affects welfare but also interacts with many related aspects. For example, bad health reduces productivity and diminishes the ability to manage knowledge.23 In order to analyze the health dimension, we use a sample of surveys (in most cases Living Standard Measurement Surveys) which include questions on several health issues for a group of countries: Argentina (Encuesta de Condiciones de Vida, 2001), Bolivia (Encuesta Continua de Hogares, 2003-2004), Colombia
18Hamilton et al (1997). The details about this methodology can be found in Hamilton
et al. (1997) and
Nord y Bickel (2002)
19 Encuesta de Impacto Social de la Crisis en Argentina (ISCA), 2002
20For technical details see Haimovich and Winkler (2005)
21 This survey asks if a member of the household had nothing to eat (at least during a whole day of the
previous week) due to economic reasons. This question is similar to one of the ten questions employed to construct the hunger indicator of Argentina.
22 The sample size of Colombia’s ECV is around ten times larger than that of the ISCA survey
(Encuesta de Condiciones de Vida, 2003), Guatemala (Encuesta Nacional sobre Condiciones de Vida, 2000), El Salvador (Encuesta de Hogares de Propósitos Múltiples, 2004), Nicaragua (Encuesta Nacional de Hogares sobre Medición de Nivel de Vida, 2001), Panama (Encuestas de Niveles de Vida, 2003) and Peru (Encuesta Nacional de Hogares, 2003).
Health issues are particularly interesting when studying old people’s well-being. Aging is strongly linked to health deterioration. Other things being the same, the health of older people is expected to be worse than that of the rest of the population. We illustrate this idea with a subjective measure of health status. Colombia’s ECV asks individuals about self-perception of health. Figure 4.6 shows that the proportion of people who consider themselves to be healthy drastically falls with age. Whereas around 80% of the population aged 5 to 30 have a positive self-perception, this share drops to values close to 30% for people older than 70. Naturally, this phenomenon is also reflected in the likelihood of being ill.24 Table 4.12 shows that in all the countries this likelihood is significantly higher for the elderly. The differences are particularly large in Bolivia and Nicaragua. In the latter, whereas 38% of people aged 25 to 49 fell ill during the previous month, this percentage reaches 73% for older people.
In Bolivia, Nicaragua, Panama and Peru, among those who are ill, the likelihood of visiting a doctor is higher for the elderly. This could be due to differences in the severity of the illness or to different attitudes toward health care, but it does not seem to be due to a larger capacity to afford medical attention. Only in Bolivia, people between 25 and 59 years old are more likely to face economic barriers to visit a doctor (see panel III in table 4.12). In Panama, Peru, Guatemala and El Salvador the converse is true, and in the cases of Nicaragua and Argentina there are not significant differences in this likelihood.25
Other relevant aspect is access to health insurance. Table 4.13 shows that the panorama regarding this issue is ambiguous. In Guatemala, El Salvador and Nicaragua older people are in a worse situation, with lower access to health insurance. The opposite happens in the rest of the countries.
5. The role of the pension systems
In this section we extend the analysis of the relationship between old age poverty and the pension systems, started in section 3, by presenting evidence on the coverage of pensions in LAC, and carrying out microsimulations in order to assess the potential effectiveness of different pension schemes to reduce poverty.
24 The illness condition is referred to the month previous to the field work of the survey.
25 However, in Argentina the elderly are much more likely (10 percentage points) to face economic
Coverage
Most LAC countries have contributory pension systems. In these kinds of employment-based schemes only people with a stable formal job have access to a pension upon retirement. Most Latin-Americans, however, are self-employed or salaried workers in small, precarious firms without a signed contract in compliance with labor regulations, and without access to social security. The evidence suggests that there are no signs of a
reduction in the high levels of labor informality in the region in the last 15 years
(Gasparini and Tornarolli, 2007; ECLAC, 2006). In fact, in several countries labor informality has increased since the early 1990s.
In table 5.1 and figure 5.1 we present the share of people receiving income from pensions. As expected, the coverage of the pension system in LAC is very low: in 13 out of 19 countries in the sample the share of the elderly receiving income from pensions is lower than 20%. As mentioned earlier, Southern Cone countries have relatively well-developed pension systems, with coverage for the elderly ranging from around 55% in Argentina and Chile to 78% in Brazil and Uruguay. The other two countries with coverage higher than 20% are Costa Rica and Panama, with levels near 40%.
The picture does not look very different if we consider only urban areas. Table 5.2 and figure 5.2 show that in most countries the coverage of pension systems in cities is higher than in the whole country, but the difference does not seem large. The main exception to this conclusion is Panama. The level of urban coverage in this country is similar to Argentina, with more than 50%.
The case of Brazil stands out from the rural statistics in table 5.3 and figure 5.3. In rural Brazil the share of elderly receiving income from pensions is 85%. This high level of coverage is due to the implementation of a non-contributory program geographically targeted: the Brazilian rural pension program, which has been very important in reducing poverty in the poorest rural areas of that South American country. The results achieved in rural Brazil highlight the potential effectiveness of non-contributory mechanisms in reducing poverty, especially in countries with a large proportion of their population excluded from formal labor markets, and thus unable to have access contributory pension systems. Of course, the possibility to implement non-contributory mechanisms depends on fiscal revenues, usually scarce in LAC countries.
All the results shown above are not significantly different if we restrict the analysis to inactive elderly people or define the elderly as those older than 65. In fact, both changes reinforce the advantage in favor of Southern Cone countries, with the share of covered people changing slightly in the remaining countries. The exception is Argentina: in this country 76% of inactive people older than 65 receive income from pensions, while only 56% of people older than 60 receive income from pensions.
pension when retired. Unfortunately, information on the access to the pension system in the LAC household surveys is either restricted to wage earners or not available altogether.
In 8 out of 13 countries less than half of the workers have the right to receive a pension upon retirement. If we added to this scenario the fact that labor informality is surely very high among the self-employed, and that unemployment rates are high in many LAC countries, we would end up with a very disappointing result: most participants in the labor force are not included in the contributory pension systems of LAC, and therefore they do not have the right to perceive a pension in the future.
The situation regarding labor informality is not homogeneous across countries. In Chile almost 90% of salaried workers pay social protection contributions, and in Uruguay 3 out of 4 salaried workers contribute to the pension system. There are three countries with intermediate levels of informality: Venezuela, Argentina and El Salvador. In the remaining countries the share of formal salaried workers is less than 50%. The case of Brazil is interesting: while only 20% of rural salaried workers pay social protection contributions, it was shown above that 85% of rural people older than 60 receive income from pensions. This highlights the importance of the non-contributory mechanism in Brazil.
In the four Southern Cone countries with the lowest overall rates of labor informality, the share of workers older than 60 who are formal is similar to the national average. On the contrary, in almost all the remaining countries the percentage of informal salaried workers older than 60 is significantly higher than the national mean.
Finally, table 5.4 informs that a very low proportion of salaried rural workers have the right to pensions when retired, with the exception of Chile.
Impact of pension on poverty
pension system on poverty. A deeper analysis requires a behavioral model that is beyond the scope of this document.
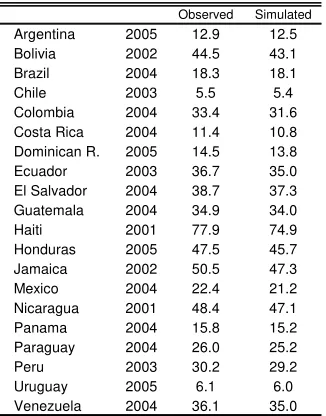
In table 5.5 we show the results of this simple exercise. The evidence supports the conclusions of section 3: pension systems in Argentina, Brazil, Chile and Uruguay have an important role in alleviating old-age poverty (given the assumptions of this exercise). In these four countries, those with overall poverty rates markedly higher than old-age poverty, the existence of pension systems with high coverage helps to eradicate poverty almost completely among the elderly. The strongest impact occurs in Brazil: while only 3.7% of Brazilians older than 60 are poor, 47.9% of them would be poor without pensions (keeping all the rest constant). The situation is very similar in Argentina: while poverty among the elderly is low (4.5%), the situation would be different without social security: old-age poverty would reach a level of 39.5%. In Chile and Uruguay, two countries where poverty among the elderly is very low, pension systems contribute to decrease old-age poverty in almost 20 points. In the remaining countries, with the exception of Mexico and Venezuela, the impact of pension systems on poverty is low. This is an expected result, considering the very low coverage of pension systems in these countries. Tables 5.6 and 5.7 display the results of the same exercise for urban and rural areas, separately. The main finding is not surprising: the impact of the pension systems on poverty is higher in the cities than in the countryside, due to the higher coverage of pension systems in urban areas. The results presented in Tables 5.5 to 5.7 are robust to the definition of the elderly.
Simulating the impact of a universal pension system on poverty
Policies traditionally applied to fight poverty are usually designed with the intention of improving the productivity of poor people. The aim of specific policies like training and educational programs is to strengthen their endowment of human capital, augmenting their capacity to find employment and generate income. But, as we have already commented in section 4, most elderly people just do not participate in the labor market, and hence those policies may result ineffective to fight old-age poverty.
A powerful instrument to alleviate poverty among the elderly is to transfer real income to them, specifically through pension systems. In order to analyze the impact of this kind of policy on old-age poverty, we carry out microsimulation exercises following Bourguignon et al. (2006), who simulate the introduction of minimum pension systems in all LAC countries.
the poor elderly. Obviously, this restriction imposes indirect costs in terms of identifying poor people. The two minimum pension systems considered in our microsimulations (similar to Bourguignon et al, 2006) are the following:
Microsimulation 1: a transfer equal to the poverty line net from income perceived as pension, granted to all the elderly:
T = max (0, z – yp) if age>59 (or 64)
where T = transfer, z = poverty line, yp= income perceived as a pension
Microsimulation 2: a transfer equal to the poverty line net from income perceived as a pension to all the poor elderly:
T = max (0, z – yp) if age>59 (or 64) and y<z where y = household per capita income.
Notice that the impact on poverty of these two schemes is the same, since poor elderly receive the same transfer under both mechanisms. As mentioned earlier, the difference between them is the amount of money required by each one. Direct costs are lower in the second scheme, in which only poor people aged more than 60 receive the transfer.
Following Bourguignon et al. (2006) we present results under different scenarios
regarding the way in which the transfer is shared within the family, and the possible incentive effects of the transfer, particularly work incentives. The scenarios analyzed are the following:
• Benchmark: the transfer is shared within the household. Each member will have
an income equal to (Y+P)/n, where Y = total household income, P = minimum pension and n = total family members.
• Altruism: the older person gives away half of his/her pension to the rest of the members of the family. The older person will have an income equal to Y/n + P/2n, and the other members equal to Y/n + P/2n + P/2(n-1).
• Egoism: the old person keeps his/her pension to him/herself. In this case her/his income is Y/n + P, while the other members of the family receive only Y/n.
• Labor Supply: we suppose that because of the minimum pension the labor
supply of the other members of the family decrease. We assume a reduction of labor income equal to the 50% of the pension.
In table 5.8 we present the poverty headcounts resulting from both microsimulations, under the four scenarios. The first panel shows results for all the population, for the elderly and people younger than 60, while the second panel breaks down the latter group into children, young and adults.
takes place for countries with low coverage of pension systems. In countries with well-developed pension systems most of the elderly are already receiving income from pensions: the extension of the current schemes simulated in the exercise only affects a limited number of older people. Additionally, it is probable that people receiving the transfer in the exercise belong to the poorest families of the population of these countries, so the amount of the transfer given to the elderly would be usually not enough to allow the family to escape poverty. 26
As expected, the greatest impact on old-age poverty occurs under “egoism”, i.e. when the older member of the family keeps the pension for him/herself. In this case the poverty rates for younger than 60 are not modified. An opposite conclusion is obtained under “altruism”: the poverty rate of the elderly does not fall as much as without “altruism”, but the other age groups experience a larger decrease in their poverty rates. However, in practice the poverty reduction in these groups turns to be very small. In the “benchmark” case, the results are intermediate between “egoism” and “altruism”: poverty rates fall for all age groups, but old-age poverty does not decrease as much as under “egoism”, and poverty rates of the non-elderly do not decrease as much as under “altruism”.
In the “labor supply” case the poverty rates of all age groups decrease less than under the “benchmark” case. However, the welfare of each group may increase, because of lower rates of labor force participation (and hence more leisure).
The fact that old-age poverty is not eradicated completely in spite of the minimum pension reflects that the pension is shared among all household members. Even under “egoism”, poverty for the elderly is not eliminated. This is explained by the fact that we have supposed that the elderly keeps for him/herself only the pension received from the new scheme, but they still share the pension received before the implementation of the universal pension system. Table 5.9 shows that these conclusions are robust to the definition of the elderly.
In order to assess the feasibility of the implementation of these kinds of universal minimum pension systems, we calculate the costs in terms of household per capita income of each scheme. Table 5.10 shows the results of these calculations. As expected, the program with the lowest cost is that in which only the poor elderly receive the transfer. The cost of both programs is smaller in countries with well-developed pension systems. In fact, in Argentina, Brazil, Chile, and Uruguay the cost of the programs is negligible.
26 People excluded from the contributory pension system in these countries are normally those who do not