Developing a Subdomain-Oriented Software
Product Line
Patricia Pernich1?, Agustina Buccella1, Alejandra Cechich1, Maria del Socorro Doldan2, Enrique Morsan2, Maximiliano Arias1, and Matias Pol’la1
1 GIISCO Research Group
Departamento de Ingenier´ıa de Sistemas - Facultad de Inform´atica Universidad Nacional del Comahue
Neuquen, Argentina
[email protected],{abuccel,acechich}@uncoma.edu.ar,ariasmaxi89@ gmail.com,[email protected]
2 Instituto de Biolog´ıa Marina y Pesquera “Almirante Storni”
Universidad Nacional del Comahue - Ministerio de Producci´on de Rio Negro San Antonio Oeste, Argentina
{msdoldan,qmorsan}@gmail.com
Abstract. Reuse-oriented software methodologies have emerged to pro-vide a set of rules or guides for development and evolution of software systems by reusing existing domain engineering artefacts such as require-ments, architecture, components, test cases, etc. Domain engineering methods, such as software product lines engineering, aim at reducing development time, effort, cost, and complexity by taking advantage of the commonality within a portfolio of similar products. However, these methodologies are not based on specific domains, instead they cover a wide range of domains without considering particularities within them. Therefore, in this work we define a novel approach in which the creation of a software product line is guided by a subdomain analysis process, oriented to a particular case within the marine ecology domain. The methodology is then applied to a specific organization in order to create a product of the line.
Keywords: Geographic Information Systems, Software Product Lines, Services, Marine Ecology, Domain Analysis
1
Introduction
The great increment in the number of developed systems and the emerging methodologies to specify a well-design software development have generated new reuse-oriented paradigms. Although this practice of software reuse started since at least thirty years ago [1, 6], it is during the last few years that a new explosion of different methodologies have emerged. In general, the reuse-oriented software
?This work is partially supported by the UNComa project 04/E072 (Identificaci´on,
engineering aims at improving the known drawbacks of the traditional software development. Thus, they are focused on reducing the development costs, time-to-market, and complexity; and improving some non-functional requirements as maintenance, evolution, etc. Within this software reuse research line, the Soft-ware Product Line Engineering (SPLE) has emerged from the advances in the software architecture area. In [4] the SPLE is introduced as a set of systems sharing common features and satisfying specific needs of a segment of a market. The main characteristics involved in this discipline are [10]:variability, in which individual systems are considered as variations of a common part; architecture-based, in which the software must be developed by considering the similarities among individual systems; and two-life cycles approach, in which two engineer-ings in every software product line process must be considered: domain engi-neering andapplication engineering [8, 10]. In the last ten years have emerged several proposals [2, 9] based on the feature oriented paradigm within the do-main analysis area [1]. In general, these proposals provide extensions of the Feature-Oriented Domain Analysis (FODA) proposed by Kang et.al [6]. Thus, the feature-oriented paradigm is used as de-facto standard for representing vari-ability in SPL. However, there exists no a standard methodology and/or tools to be used in a software product line development. In addition, the new SPL methodologies are aimed at a wide-spectrum of domains, without considering particularities of some of them. For instance, when we consider the domain of geographic information, we can find a set of common services that can be easily extracted from any GIS, such as map panning and zoom, edition of geographic features, layer management, etc. Also, the standard information defined by the Open Geospatial Consortium3 (OGC) and the ISO Technical Committee 2114 (ISO/TC 211, Geographic Information/Geomatics) provide a taxonomy of ge-ographic services that can be used as a starting point to define these common services. However, although this standard is useful to understand the wide range of services every GIS is able of offering, these services are defined in a very generic and abstract way. Creating a software product line with these services would generate too many open issues that could be handled only by very complex variabilities. Therefore, it is necessary to delimit the set of geographic services to a specific subdomain, in our case, the marine ecology domain. The abstract services defined in the standard can be adapted to this subdomain in order to obtain and manipulate information useful for organizations working in this subdomain.
This work emerges as an extension of a previous work presented in [7] in which we have shown an implementation of a SPL in the marine ecology subdomain. In this work, we define a new methodology for creating a software product line for geographic information within the same subdomain. Geographic software here shares a set of common services that are essential for every application; therefore these common services must be identified and modeled as part of the product line together with different variations. To do so, we refine the services provided
by the ISO 19119 std adapting them to the user’ requirements in the domain. Also, we define a set of steps and rules used in the creation of an application framework to be used as a platform for each product of the line. The framework covers the behavior that is common for all products and allow developers to add product-specific features. The methodology applies the knowledge obtained in the subdomain in order to guide the activities for creating the SPL.
This paper is organized as follows: next section describes our methodology to create a product-line for marine ecology applications based on the particularities of this domain. Then, we describe the instantiation of the product line applied to an real project. Future work and conclusions are discussed afterwards.
2
A Subdomain-Oriented Software Product Line
Methodology
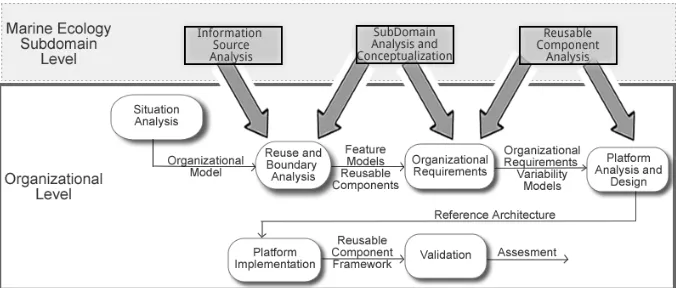
Our development methodology combines advantages of several methodologies widely referenced in academy and industry [3, 5, 6, 8] and extend them in order to apply a subdomain view which guides the development of a software prod-uct line. Figure 1 shows the main activities of the methodology concerning the domain engineering phase. This phase is divided into two levels:subdomain and
[image:3.595.139.479.494.638.2]organizational. At the first level we define three processes which impact directly on the activities defined at the second level. The colored in gray rectangles in the figure denote the processes of the subdomain analysis and their influence into the activities of the organizational analysis. The processes of this subdo-main level collect and model information concerning the particularities of the marine ecology domain. On the other hand, at the organizational level, the sub-domain information is used to be applied to an organizational analysis in which organizations within the subdomain are analyzed. The information modeled and implemented at the organizational level will be a subset of the information cap-tured at the subdomain level.
The three processes of the marine ecology subdomain level include the fol-lowing tasks:
– Information source analysis: This process involves three sources to be consid-ered within the marine ecology subdomain: standards, existing applications and domain experts. The standard information is obtained from the ISO 19119 standard in order to extract, classify and refine general services of GIS domain. The existing applications correspond to an analysis of geographic open source tools available on Internet. The analysis of these tools is useful to know which software components or applications can be reused to imple-ment specific services. To do so, we classified the tools into three categories:
thin web clients such as Mapfish5, p.mapper6, Ka-Map7, and MapBender8,
geographic databasessuch as MySQL GIS9and Postgis10databases, andmap serverssuch as UMN MapServer11and GeoServer12. Finally, the domain ex-perts are people experienced in the marine ecology subdomain who can be currently (or not) working at organizations in this subdomain. They provide useful information about different aspects to be considered. Also, software engineers and developers are part of this group and they are responsible for capturing, understanding, and analyzing all the information about the marine ecology subdomain.
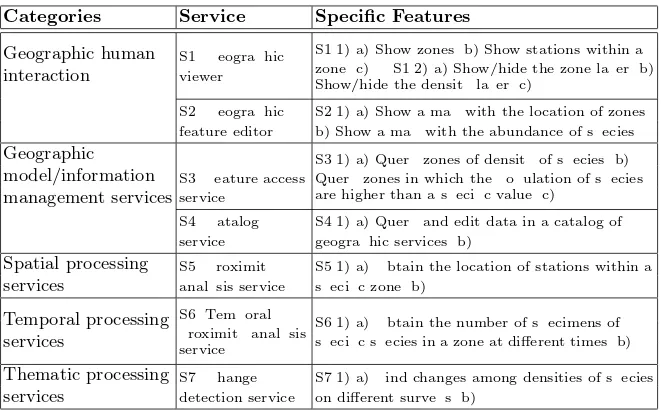
– Subdomain analysis and conceptualization: Here, the information recovered in the previous process is used to analyze and organize the features13 or services that subdomain should offered. These features are defined by tak-ing into account the standard services (ISO 19119 std) and the information provided by domain experts. Table 114 shows part of the resultant features that are specifically defined for the marine ecology subdomain. For brevity reasons we do not include here all of them.
In addition in this process the subdomain must be conceptualized. Different software artefact can be used here, such as class models, process models, etc. – Reusable component analysis: This process identifies the set of reusable com-ponents that could be used to implement the features defined in the last process. Aspect as flexibility, evolution and maintenance must be carefully
5 http://mapfish.org/ 6 http://www.pmapper.net/ 7 http://ka-map.maptools.org/ 8 http://www.mapbender.org/
9 http://dev.mysql.com/tech-resources/articles/4.1/gis-with-mysql.html 10http://postgis.refractions.net/
11http://mapserver.org/ 12http://geoserver.org/
13In [3] a feature is defined as logical unit of behavior that is specified by a set of
functional and quality requirements
Categories Service Specific Features
Geographic human
interaction S1. Geographicviewer
S1.1) a) Show zones. b) Show stations within a zone. c) ... S1.2) a) Show/hide the zone layer. b) Show/hide the density layer. c) ...
S2. Geographic feature editor
S2.1) a) Show a map with the location of zones. b) Show a map with the abundance of species...
Geographic model/information
management servicesS3. Feature accessservice
S3.1) a) Query zones of density of species. b) Query zones in which the population of species are higher than a speci c value. c) ...
S4. Catalog
service S4.1) a) Query and edit data in a catalog ofgeographic services. b) ...
Spatial processing services
S5. Proximity analysis service
S5.1) a) Obtain the location of stations within a speci c zone. b)...
Temporal processing services
S6. Temporal proximity analysis service
S6.1) a) Obtain the number of specimens of speci c species in a zone at different times. b) ...
Thematic processing services
S7. Change detection service
[image:5.595.143.474.113.318.2]S7.1) a) Find changes among densities of species on different surveys. b) ...
Table 1.Part of geographic services required by the marine ecology subdomain
specified by means of the definition of the general structure of the subdo-main. This process defines a reference model which will be refined for the activities at the organizational level. Thus, it must be created a preliminary structure composed of reusable components derived from the features ob-tained in the previous processes. In this process we define several reusable components. One of them is theGraphical Interface which implements some of the subfeatures define in feature S1. This component is in turn connected to other component (named Manage Geographic Features) implementing some subfeatures of features S1 and S2 (see Table 1).
Following, we briefly described the main activities at the organizational level (Figure 1) driven by the marine ecology subdomain analysis processes (described previously).
the second phase, we analyzed what we needed to implement future prod-uct lines by instantiating the framework. The output of this activity is an organizational model considering all these aspects.
– Reuse and boundary analysis: The analysis performed in the previous ac-tivity provides the information about which development approach can be used. In this case, as the organizations did not have previous software de-velopments, the line adopts an evolutionary approach. However, by using the information provided by theinformation source analysis process at the subdomain level, we consider the use of existing open source software tools for GIS to be used as part of the development process. In addition, the activity defines the organizational boundary and commonality and variabil-ity features. Thus, by considering the features specified in the subdomain analysis and conceptualizationprocesses (Table 1) and the information from domain experts, the scope of the product line is defined. Then, this activity analyzes which of the features can be implemented by the geographic open source tools. For instance in our analysis we define that several of the thin web clients tools can implement features S1, S2 and S5. All this informa-tion is put in a feature/tool matrix in order to visualize which open source tools implement which features and define the future component/application reuse. In addition to functional features, other task in this activity is to iden-tify non-functional requirements (quality aspects). In general, this type of requirements are defined by the software engineers and will impact on the tasks of the next activities.
– Organizational requirements: In this activity, we use the information of the commonality and variability features identified in the last activity and the information provided by thesubdomain analysis and conceptualization and
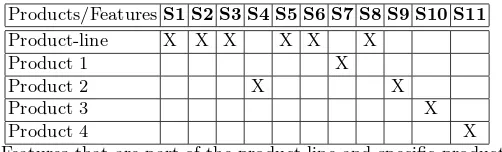
reusable component analysis processes. The main goal here is to define the range of products and features that the line is able to implement. As our methodology follows a minimalist approach, only the features used in all products are part of the product line. In our case, this approach allowed us to fully implement only common features and let the product-specific features be implemented by each different organization. Thus, our software product line is then seen as aplatform [10]. The first task here is to create a product/feature matrix indicating the features required by each product. Then, by using this matrix in the second task the features to be part of the line must be derived. Table 2 shows a subset of features that are part of the product-line and a subset of features that are product-specific features. As we can observe, features S1-S3, S5-S6 and S8 are part of the product-line. S7 is a product-specific feature that will be implemented only by Product 1. Similarly, features S4, S9, S10 and S11 are part only of each Product 2, 3 and 4, respectively. In addition, within each feature we determined the commonality and variability models. For example, for the feature S2.1, the variability model describes the two variants of editing and seeing geographic features - by using maps or tables.
Products/FeaturesS1 S2 S3 S4 S5 S6 S7 S8 S9 S10 S11
Product-line X X X X X X
Product 1 X
Product 2 X X
Product 3 X
[image:7.595.184.435.114.190.2]Product 4 X
Table 2.Features that are part of the product-line and specific-product features
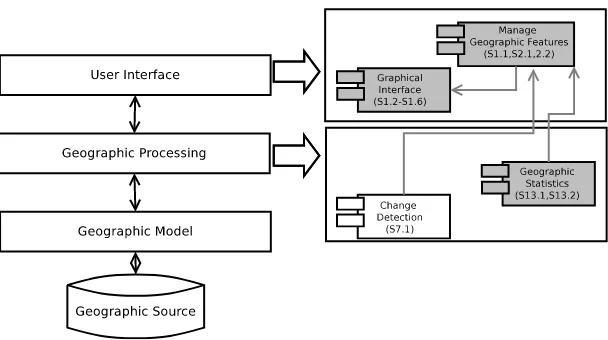
preliminary structure of reusable components defined in the reusable com-ponent analysis process is reorganized and refined in order to perform two tasks. Firstly, the components can be refined in order to add the variability. Decisions about specify different components for each variability or include the variability within the components, or a merge between both, must be taken into account. Secondly, the features must be reorganized into two sets of requirements to separate functional from non-functional (quality) needs. These sets will be the basis to define our architecture’s components. Here, we define a layered architectural style to facilitate dealing with modifiabil-ity and scalabilmodifiabil-ity requirements. Figure 2 shows the reference architecture in which three main layers are defined. In addition, the figure shows which features (defined in Table 1) are implemented by which components and the dependences among them. For instance, the change detection component (of the geographic processing layer) implements the feature S7.1 and the ge-ographic statistics component implements features S13.1 and S13.215. The components colored in gray are components that are part of the platform and the others are specific for one o more products in the line.
– Platform implementation: In this activity the components that are common for all products, that is, the components of the line, are implemented. This activity creates the application framework which will be used as a platform for each product of the line. The framework also allows developers to add the product-specific features.
– Validation: There are several aspects to analyze within this activity. Firstly, some test cases must be defined in order to test the framework and the specification of the product line. Secondly, when a new product is developed we must test this new instantiation (as the one we will describe in the next section).
3
Instantiating the Product Line: A Case Study
In this section we show a instantiation of the SPL created specifically for the marine ecology subdomain. We build the Product 1 (Table 2) containing features of the product line plus a set of product-specific ones (S7). The other products
Fig. 2.Reference architecture of the SPL for the marine ecology domain
in the software line (Products 2 4) will belong to other organizations within the marine ecological domain (Instituto Argentino de Oceanograf´ıa16, Centro Nacional Patag´onico17, and Laboratorio de Moluscos y Crust´aceos belonging to the University of Mar del Plata).
Product 1 emerged from a project between GIISCO research group18 and the Instituto de Biolog´ıa Marina y Pesquera “Almirante Storni”19 (IBMPAS). IBMPAS is responsible for analyzing and storing information about sea surveys in the San Mat´ıas Gulf, Patagonia Argentina. Each survey, performed once a year (when it is possible), collects information about the population of specific species living in this area. This information is then used for spatial processing in order to obtain information about spatial distribution of data, population variation patterns in different scales, etc.
In order to instantiate and develop the Product 1 we have performed the following steps:
– We have defined the features of Table 1 according to the requirements of the product. The features were refined to include the specific layers required by the IBMPAS. Thus, in this product we implemented several layers including surveys, sea zones20, and stations21.
– We have instantiated the variability models associated to the features (Table 2). For instance, the feature S2.1 in this product is implemented by using tables (not by using histograms).
16http://iado.criba.edu.ar/web/ 17http://www.cenpat.edu.ar/ 18http://giisco.uncoma.edu.ar/ 19http://ibmpas.org/
20A zone is a maritime area bounded and defined with a specific name in the gulf. 21A station is a geographic point located within one of the defined zones. In this
– Finally, we have created the architecture based on the reference architecture defined in the domain engineering process (Figure 2). This architecture con-tains the components defined for the SPL and those components specifically created for this product (S7).
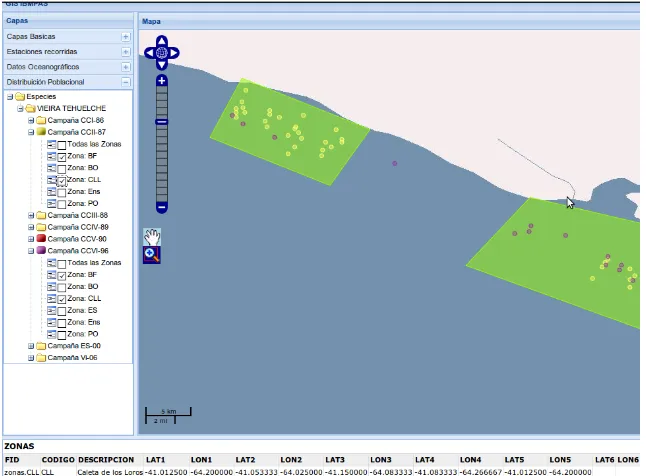
Part of Product 1 is already implemented. As an example, we describe here two of the services implemented – change detection and query geographic fea-ture services. The first one is shown in Figure 3 and returns information about the places (stations) in which a species (Viera Tehuelche) is found in different surveys (year 87 in yellow and year 96 in violet) in different zones (polygons in green). This service is very useful to analyze migration movements of species. Feature S7.1 is implemented in this service. The other service, query geographic feature, can be also shown in Figure 3. The service presents a description ta-ble in the bottom when one or more zones are selected (in this case two zones were selected). This service is the implementation of feature S2.1 with thetable
[image:9.595.147.470.343.581.2]variability instantiated.
Fig. 3.A map showing thechange detectionandquery geographic feature services
4
Conclusion and Future Work
In this work we have defined a methodology oriented to create a software product line in the marine ecology domain. Our work emerges as a solution to different organizations within this domain. Although a great effort must be put initially for creating the product line, benefits appear when creating each new product. In this paper we have shown a real case study in which we have instantiated the line in order to create a specific product for the IBMPAS. The benefits of this model of development have not been directly measured, but one indicator of the success is that the development cost was drastically reduced.
As future work, the methodology and the framework need more validation, but we are aware that developing management guidelines is also crucial for suc-cessfully applying the approach. Within this line, we are developing a supporting tool (as Eclipse plug-in) which interacts with software engineers and developers in the process of creation a new product in the line.
References
1. Arango, G.: Domain Analysis. In: Marciniak, J. (ed.) Encyclopedia of Software Engineering, vol. 1, pp. 424–434. WILEY (1994)
2. Benavides, D., Segura, S., Ruiz-Cort´es, A.: Automated analysis of feature models 20 years later: A literature review. Information Systems 35, 615–636 (September 2010)
3. Bosch, J.: Design and use of software architectures: adopting and evolving a product-line approach. ACM Press/Addison-Wesley Publishing Co., New York, NY, USA (2000)
4. Clements, P., Northrop, L.: Software Product Lines : Practices and Patterns. Addison-Wesley Professional (August 2001)
5. Czarnecki, K., Helsen, S., Eisenecker, U.W.: Formalizing cardinality-based feature models and their specialization. Software Process: Improvement and Practice 10(1), 7–29 (2005)
6. Kang, K., Cohen, S., Hess, J., Nowak, W., Peterson, S.: Feature-Oriented Domain Analysis (FODA) Feasibility Study. Technical Report CMU/SEI-90-TR-21, Soft-ware Engineering Institute, Carnegie Mellon University Pittsburgh, PA. (1990) 7. Pernich, P., Buccella, A., Cechich, A., Doldan, S., Morsan, E.: Reusing geographic
e-services: A case study in the marine ecological domain. In: Cellary, W., Es-tevez, E. (eds.) Software Services for e-World, IFIP Advances in Information and Communication Technology, vol. 341, pp. 193–204. Springer Boston (2010),
http://dx.doi.org/10.1007/978-3-642-16283-1_23
8. Pohl, K., B¨ockle, G., van der Linden, F.: Software Product Line Engineering : Foundations, Principles and Techniques. Springer (September 2005)
9. Sinnema, M., Deelstra, S.: Classifying variability modeling techniques. Information and Software Technology 49, 717–739 (July 2007)