Design of an Adaptive-Rate Video-Streaming
Service with Different Classes of Users
1I.V. Martín, Mónica Aguilar-Igartua, and Jorge Mata-Díaz Telematics Engineering Department, Technical University of Catalonia
(UPC), Jordi Girona 1-3, 08034, Campus Nord, Barcelona, Spain. {isabelm, maguilar, jmata}@ entel.upc.es
Abstract. The provision of end-to-end Quality of Service (QoS) for multimedia services over IP-based networks is already an open issue. To achieve this goal, service providers need to manage Service Level Agreements (SLAs), which specify parameters of the services operation such as availability and performance. Additional mechanisms are needed to quantitatively evaluate the user-level SLA parameters. This work is focused on the evaluation and assessment of different design options of an adaptive VoD service providing several classes of users and fulfilling the SLA commitments. Based on a straightforward Markov Chain, Markov-Reward Chain (MRC) models are developed in order to obtain various QoS measures of the adaptive VoD service. The MRC model has a clear understanding with the design and operation of the VoD system.
1 Introduction
During the last years, Video-on-Demand (VoD) applications for the transmission and distribution of video have experienced a growing development and acceptance from the users. Video-streaming systems have a special relevance in wired and wireless networks. In these systems, the video is distributed for its reproduction in real-time [1]. The video server of a video-streaming system stores a set of movies that can be requested by any client. If the connection request is accepted, a session is initiated; then a multimedia stream flows through a set of heterogeneous networks from the video server to the client terminal.
In end-to-end Quality of Service (QoS) scenarios, QoS measures such as packet loss, packet delay and jitter must be guaranteed when the connection is accepted. These real-time guarantees required by the VoD systems could be achieved using QoS differentiation between traffic classes over heterogeneous networks. On the
1
other hand, with the aim of reducing the huge amount of information generated by the video source, loss compression techniques are applied. The most common coding techniques are H.26x and MPEG standards [2]. The price to pay for a high compression level is a degradation level in the image quality.
The adaptive VoD services employ a set of policies for dynamic resource allocation. It is accomplished by means of signalling protocols used between the service and the network. Thus, related to the bit rate variability of the flow, the service raises renegotiations to the network in order to modify the allocated resources during the session. These renegotiations are performed at the temporal-scale of the scenes in a video sequence. In this way, the amount of network resources reserved during the session are reduced substantially and a more efficient exploitation of these resources is achieved [1, 3, 4]. However, in congestion situations the service adapts the transmission bit rate to the available network resources applying a higher compression level or managing the enhanced layers when scalability techniques are employed [1]. Thus, the final QoS provided to the customers of these streaming services depends on the available network resources.
Both the service providers and the customers are indeed interested in tools which quantify the performance of these systems from their points of view. To facilitate the required evaluations, these tools should provide feasibility to incorporate modifications into the system in an easy way. Further, these tools also must admit a computational evaluation. Analytical tools are the most appropriate mechanisms to facilitate the required evaluation. This kind of analytical tools help to address some of the typically required main objectives: to maximize the use of network resources, to fulfil the QoS offered to the users and to define billing metrics. Likewise, these tools could compute diverse parameters in order to specify, to manage and to control the fulfilment of the Service Level Agreements (SLAs). The management of SLAs is a current challenge into the multimedia services area. There are diverse recent proposals about SLA management (e.g. [5, 6]), although none of them specifies how to quantitatively evaluate the user-level SLA parameters.
parameters such as the image quality, reserved resources, or effectively-used resources.
In the present work we construct analytical models to analyze the performance of a VoD service for different configuration parameters. Firstly, we define different QoS user-profiles to evaluate the measures of user-level QoS parameters when only one of these classes of user is accepted. After that, we analyze the interaction between users’ classes, i.e. when there are users belonging to more than one QoS profile in the system. Finally, we analyze the trade-off between service providers’ profits and a variable pricing policy which depends on the video quality perceived by the customers.
The rest of the work is organized as follows. Section 2 describes the VoD system under evaluation. A background of the previous works presented in [11] and [13] are summarized in section 3. In section 4 we assess some design options of VoD services providing several classes of users and fulfilling the SLA commitments. Finally, conclusions and future work are presented in section 5.
2 The System Description
Figure 1 depicts the VoD system analysed in this work. Video sequences of movies have previously been coded using the VBR MPEG-II algorithm and then stored in the video server. When any customer of the VoD service demands one of these sequences, a connection is established if the video service has enough resources to provide the contracted user's profile, i.e. the agreements specified in the service contract. In many IP QoS-aware networks, the RSVP (Resource reSerVation Protocol) is employed as signalling protocol to manage resource reservation requests [14]. Video-streaming services send RSVP requests to the network in order to renegotiate the required resources of the video-stream transmitted. The description of these resources is specified by means of the Traffic Specification (TSpec) parameters carried in the PATH messages of the RSVP. The RSVP requests are associated with the scene changes of the video sequence. The TSpec of each RSVP request is set according to the complexity of scene. Thus, different network resources are requested over the whole transmission of a sequence. Moreover, this renegotiation process yields to changes of the available network resources due to the interaction between the multiplexed connections. With the aim that the video sources are capable to adapt their output bit rate to the time-varying network resources, each available sequence has a set of MPEG flows coded with different quantization step (Q). Then, each available flow offers a different image quality according to Q [2]. For each accepted session, the transmitted stream will match with one of the different available coded flows of the requested sequence. This selection changes depending on the image quality contracted by the user and on the result of the reservation request produced by the end-to-end admission control of the RSVP-based system.
parameters of each scene and the events of resources renegotiation in each sequence. When scene changes or variations of the available resources happen, the
Regulator/Negotiator block decides which flow (Qi) will be transmitted. To
guarantee a minimum video quality, the minimum reservation needed to transmit the lower image quality flow must always be assured. The Traffic Shaper block extracts the variability introduced by the frame coding modes (Intra, Predicted and Bidirectional-Predicted) of the MPEG algorithm. In this way, the bit rate is smoothed and it is maintained constant (rGoP) for a GoP (Group of Pictures) interval.
Fig. 1. System model for the VoD service. Fig. 2. Required bit rate.
3 Background
3.1 Scene-based Markovian models for a video sequence
In order to efficiently characterize the network resources required by a constant-quality flow of a video sequence, we need to identify the groups of frames with same complexity or activity in the sequence. The identification process of these consecutive groups of frames has been called in the literature as Segmentation [15].
[image:4.595.139.475.218.302.2]Design of an Adaptive-Rate Video-Streaming Service with Different Classes of Users 79
3.2 Generic Method to Develop Analytical Models of VoD Systems
A generic method to construct Markov Reward Chain (MRC) models for VoD systems was proposed in [11]. Then, to carry out computations of QoS measures, the method of Randomization [18] was applied to the MRC. The generic modelling methodology presented there consists on 5 steps to obtain a MRC that statistically characterizes the network resources required by a connection and the resources amount available for this connection. Also, applying this methodology, an analytical model of a particular VoD system was derived in [11]. We proposed some modifications to this model obtaining new models which reduced the space of states and therefore provided a faster computation of expected results [13]. The reader can find the full explanation of this analytical model and the generic method in [11] and [13]. We summarize these models, using this method, as follows
In Step 1, a markovian model for each available fixed-quality video flow in the VoD system is derived in a similar way as it was developed in [3]. This model is composed by three states that define three activity levels (see section 3.1).
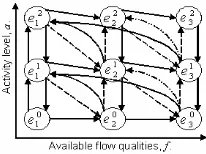
The Continuous-Time Markov Chain (CTMC) shown in Fig. 4 was derived in [11] applying Step 2. For the sake of the clarity, only 3 different constant image-quality flows have been depicted in the draw. Each column corresponds with the model of each available flow, which was obtained in step 1. This CTMC models the behaviour of a connection in the system, where eaf is a connection state where flow
of quality f (1: worst quality… F: best quality) in the activity level a (0: regular, 1: medium, 2: high) is transmitted through the connection. The transitions between states reflect the scene changes and renegotiation decisions that have been designed in the VoD system. In addition, in this example while the stream remains in the same activity level, the system periodically tries to improve by sending requests for the next better image-quality. We call this process polling of improvement. The transition rates in this CTMC depend on the required resources and on the available resources. In order to formally express these dependencies, two boolean factors are defined:
{
1 , if ( , ) ( )0 , otherwise.
a available
f RSV f a RS
e
α = ≤ and (1)
1 , if ( , ) ( , ) ( , )
0 , otherwise.
a b
f g
RSV f a RSV g b
e e
β = ≥
, (2)
where RSavailable is the amount of available resources for the connection and RSV(f, a)
is the amount of network resources that the system reserves for the connection when the server transmits a flow of quality f in activity level a
Let ψ(eaf,ebg) be the transition rate from state
a f
e to state ebg for a connection. These rates in the CTMC, related to increments or decrements of the activity level in the video sequence, are formulated by means of equations which depend on the rates
λa,b and on the factors β (see [11]). Finally, transitions owing to the polling of
improvement are formulated as a function that depends on the poll rate λp and on the
connections are being served, RSavailable vary throughout time. In this case, it is
mandatory to know the state of all the connections that interact with the one under analysis. This state leads to know the amount of resources available for the connexion under analysis, RSavailable.
In Step 3, to achieve the goal of knowing the state which represents the rest of all the connexions except the one under analysis, we developed a model for those N
accepted sessions. Firstly, the state of all the connections with a same QoS profile is defined. In this homogeneous case, each connection is characterized with the same parameter values of the generic connection model that has been described in step 2. Let S* = { 0 1 2
1 1 1
(n ,n n, ), (n n n20, 21, 22),… , (nF0,n1F,nF2)} be the system state, where
a f
n
is the number of connections transmitting a flow of quality f in activity level a. Let
( , ) ( , ) f a g b
S+− be a system state with one more connection transmitting a flow of quality g
in activity level b and one less connection transmitting a flow of quality f in activity level a, regarding state S*. If all transmissions are uncorrelated, only transitions from state S* to state S+−( , )( , )g bf a can occur. Then, the transition rates Ψ
(
S S*, +−( , )( , )g bf a)
are expressed as a function of rate ψ multiplied by naf . Where, generalizing (1) for Nconnections and with a conservative admission control, the factor α(S*) is expressed as:
* 1 , si · ( , )
( )
0 , otherwise. a
f total
f a
n RSV f a RS S α ∀ ∀ ≤ =
∑ ∑
. (3)To develop the heterogeneous customers’ situation, the simpler way is to redefine the system state as the joining state of all the user-classes, that is: S = {S1,
S2, …, SC}.
Step 4 is applied to evaluate the performance of a session in the system with other N accepted sessions. Let
{ }
e Saf, be a system state, where eaf describes the state of the connection under evaluation and S characterizes RSavailable. The state Smay be described e.g. as the one obtained in step 3, where RStotal is the total amount
of resources available for the VoD service which could be either a constant value or a variable amount characterized by any Markovian model of channel capacity.
The analytical models that were obtained applying this methodology provide accurate results for measures of the VoD system performance. Nevertheless, as the number of users N grows or the number of classes of users C grows, the computational cost of these models increases combinatorially [19]. To address this issue, in [13] we proposed a way to reduce the number of states that characterize the amount of resources reserved by the other N sessions accepted in the system,
RSavailable. We observed that, for any video sequence, the probability to achieve the
Fig. 3. Scene-based Markovian model. Fig. 4. Generic model of an accepted connection.
4 Evaluation of Different Design Options in the Video Service
Section 2 describes the general operation of the VoD system under analysis. However, there still are open options to configure the final video service offered to the customers. Many QoS measures of these adaptive VoD services can be evaluated using our analytical model as it has been summarized in section 3. We also can easily compare the system performance under these different design options. Some of these design options are: the set of coded flows with different video qualities for each film; the resources assignment policy and the admission control policy for each user-class.
Service providers must design these sets of coded flows according to the QoS that they want to offer to each class of user. The question is to decide how many flows of different qualities are going to be arranged and which are going to be the most proper video qualities of these flows to satisfy the QoS requirements of each class of user. Service providers can design different user classes, i.e. different user profiles with different QoS characteristics. All the connections from the different user classes are interacting and sharing the system resources. Therefore, the quality perceived by each user-class depends on the proper design of the VoD operation. Service providers must carry out the design fulfilling the SLA parameters of each user class. Even though we seek to accomplish the committed levels of QoS when designing the system, the service provider also asks for maximizing his/her profits. Hence, not only must we set a charging policy to attract customers, but also we must consider all the factors that produce a cost for the service provider to supply that service to the customers. On the one hand, an adaptive charging policy that varies according to the received video quality throughout time may be very interesting for the customers. On the other hand, the designing options to configure the service have a straight influence on the costs that the service providers must assume to provide the VoD service.
4.1 Designing the Set of Video Flows Available to Each User-Class Maximizing
the Service Provider’s Profits
The basic configuration parameters of the VoD system used here are the same ones used in [13]. Likewise, the designed user profile makes that each accepted connection can access to all the available resources, without distinction among the users or the classes of user. However, in the present work another admission control has been designed and evaluated. Now, a new connection request is accepted if the amount of resources is sufficient to transmit the minimum quality (RSVmin) for all the
connections. The quality will be lowered for the already accepted connections, if it is necessary. This VoD system only guaranties the resources for the flow with minimum quality. As a consequence, this admission control is more permissive, it maximizes the number of accepted users even though they may notice a high level of QoS degradation.
Several measures of the QoS offered to a customer of the VoD service have been computed, such as the PSNR, the failure time, the transmitted bit-rate and the reserved BW. The expected mean value of these measures for an observed user and the standard deviation among all the users, have been evaluated. For space reasons only some of them are shown here. The computation of these measures from the analytical models has been done using the MRC solution proposed in [19].
First of all, we examine the performance of the VoD system with only a class of user. The transmitted sequence is “The Graduate”, and the stored flows have been coded with quantization step Q equal to 4, 8 and 16. We will refer to these flows as
vrb4 (highest video quality), vbr8 and vbr16 (lowest video quality), respectively. Table 1 summarizes the values of the RSV parameters (reserved resources) used for the analytical model of the different classes of user. We call class0 to the exigent
user-class which has available the two flows with higher quality (vrb4, vbr8), class1
to the tolerant user-class which has available the three flows (vrb4 and vbr8 and
vbr16), and class2 to the conformist user-class which has available the two flows with lower quality (vrb8 and vbr16). Remember a minimum bandwidth must be reserved to assure the transmission of the lower image quality flow of the requested movie. We call RSVmin to this minimum reserve. RSVmin is determined by vbr8 for class0 and by vbr16 for class1 and class2. As vbr8 has a higher quality than vbr16,
RSVmin is higher for class0 than for class1 or class2. We also may design another class3 that arranges the highest quality and the lowest quality flows (vrb4 and
[image:8.595.150.458.588.652.2]vbr16). In fact, this option is inefficient. We could verify that the mean PSNR was lower in class3 than in class1 for the same reserved BW in both classes, as Fig. 9 in [13] shows.
Table 1. Estimated required resources, RSV [bits/GoP].
Class1
Class0 Class2
Figure 5 depicts the Mean PSNR provided to a user and the Mean Bit Rate Reserved to each accepted sessions, when there is only one of the three user classes (class0, class1, class2) in the system. These figures are represented as a function of the total BW assigned to the VoD service and with the number of accepted streaming sessions (N) as a parameter. For each N, the curves start at the minimum BW required to accept the Nth session in the VoD system. For example, the curves pointed out as N1_class1 correspond to N=1 user of class1, where the value of
RSVmin is 1.5 Mbps (=364476.06 bits/GoP, see Table 1). Discontinuities in the
analytic curves are produced as a result of the discretization of the activity levels of the flows. For more details please refer to [11] and [13]. These curves prove the fact that class0 users have assured a high PSNR, class2 users are limited to a low PSNR while class1 users experiment a wider range of PSNR that depends on the available resources. The reserved BW to a class0 user or a class2 user is almost constant (3 Mbps for class0 and 1.6 Mbps for class1). Users of class1 use well the resources because they always take up the available bandwidth, as the black line from Figure 5 shows.
A service provider could already use these results to design the VoD service with a single class of user. On the one hand, from a particular VoD service the service provider could estimate the QoS parameters that he/she could offer to the customers. On the other hand, the service provider may design a VoD service given a certain level of QoS required for the customers. However, if the service provider wants to give service to different user profiles, these figures would be just a rough reference of the system performance. The reason is that the behaviour of users from one class influence on the QoS of the other classes. In this case, it is necessary to evaluate the system model when different classes of user are simultaneously accepted in the system.
Figures 6 to 8 present measures of PSNR and Profits, when heterogeneous users of class0, class1 and class2 can be accepted in our VoD system. The total bandwidth that the provider has available to offer the service is 12 Mbps. We evaluate a simple function of variable benefits: The revenues are adjusted to the video quality effectively transmitted to the users and the service provider’s costs depend on the reserved resources. Many more complex billing functions can be evaluated as well. They could consider different factors, e.g. different charges and costs. As an example, [20, 21] show billing functions based on fixed and variable costs due to the connection setup and the consumed bandwidth, respectively. Any proposed policy trades off performance degradation with monetary incentives to improve user benefit and network revenue. To facilitate the performance evaluation considering the costs, we define a monetary unit [u] equivalent to the price to pay for the transmission of the whole movie with the flow of maximum quality (Q=4). The cost C that the service provider must assume depends on the reserved resources; Here we have set C
equal to 2·10-5 [u] per reserved Mbit. The price that each user would pay has been estimated using our analytical model applying a set of assigned rewards equal to 0.0023692, 0.003948667 and 0.000789733 [u] per each GoP transmitted for flows
Fig. 5. Mean BW reserved and mean PSNR provided to a single class. The available quality flows are: Q=4 and 8 (class0); Q=4, 8 and 16 (class1); Q=8 and 16 (class2).
[image:10.595.138.471.399.626.2]Fig. 7. Mean PSNR provided to a customer and profits for the service provider. Users of class0, class1 and class2 interact in the VoD system. There are 1, 2, 3 and 4 accepted users of class0.
Figure 6 presents some of the measures that we have calculated when there is no accepted user of class0 in the VoD system. This way, the system capacity is 7 users. The results are shown for 7, 6, 5 (from left to right) users in the system. Measures for
class2 users are independent of the number of accepted users of class1. These values are almost constant and close to those of maximum quality e.g. PSNR=38dB,
Profit_per_user=0,4[u]. On the contrary, measures for users form class1 are quite degraded when a new user from class2 or class1 enters the system. Nevertheless, measures (including profits) for class1 are always the same or better than for class2.
Fig. 8. Mean PSNR provided to a customer and profits for the service provider. There are 2, 3 accepted users of class0, (from left to right).
Figure 7 clearly shows another undesirable situation. When there is one class0
user then the profit per user of class1 is higher or faintly lower than the profit per user of class0. Nevertheless, that is unfair because we are providing a lower PSNR to
class1 than to class0. This incongruity is due to the fact that RSVmin is higher for class0 than for class1 i.e. to transmit the coded flow with the same video quality, the service provider has to reserve a higher amount of resources for class0 user than for
class1 user. That affects in the cost for the service provider, which is higher when giving service to users of class0 than to users of class1, despite both produce the same incomes. To cope with this, the service provider should charge more to users of
class0 for that reason, e.g. a fixed amount depending on the RSVmin.
5 Conclusions and Future Work
References
1. D. Wu, Y.T. Hou, W. Zhu, Y. Zang, and J.M. Peha, Streaming Video over Internet: Approaches and Directions, IEEE Trans. on Circuits and Systems for Video Technology 11(3), 282-300 (2001).
2. M. Ghanbari, Video Coding: An Introduction to Standard Codecs (IEE Telecommunications Series 42), IEE Publishing, (1999).
3. L.J. De la Cruz and J. Mata, Performance of Dynamic Resource Allocation with QoS Guarantees for MPEG VBR Video Traffic Transmission over ATM Networks, Global Telecomunications Conference, IEEE GLOBECOM’99, vol. 2, pp. 1483-1489 (1999). 4. P. Manzoni, P. Cremonesi, and G. Serazzi, Workload Models of VBR Traffic and Their
Use in Resource Allocation Policie, IEEE/ACM Trans. on Networking 7(3), 387-397 (1999).
5. G. Cortese, R. Cremonese, P. Fiutem, S. D'antonio, M. Esposito, S.P. Romano, and A. Diaconescu, CADENUS: Creation and Deployment of End-User Services in Premium IP Networks, IEEE Communications Magazine 41(1), 54-60, (2003).
6. IST Project: TAPAS- Trusted and QoS-Aware Provision of Application Services, (2001) http://www.newcastle.research.ec.org/tapas/
7. G.M. Muntean and L. Murphy, A New Adaptive Multimedia Streaming System for All-IP Multi-Service Networks, IEEE Transactions on Broadcasting 50(1), 1-10 (2004).
8. A. Lombardo and G. Schembra, Performance Evaluation of an Adaptive-Rate MPEG Encoder Matching IntServ Traffic Constraints, IEEE/ACM Trans. on Networking 11(1), 47-65 (2003).
9. C. Luna, L. Kondi, and A. Katsaggelos, Maximizing User Utility in Video Streaming Applications, IEEE Transaction on Circuits and Systems for Video Technology 13(2), 141-148 (2003).
10. R.S. Ramanujan, J.A. Newhouse, M.N. Kaddoura, A. Ahamad, E.R. Chartier, and K.J. Thurber, Adaptive streaming of MPEG video over IP networks, Proceedings 22nd Annual Conference on Local Computer Networks, IEEE, pp. 398-409, (1997).
11. I.V. Martín, J.J. Alins-Delgado, M. Aguilar-Igartua, and J. Mata-Díaz, “Modelling an Adaptive-Rate Video-Streaming Service Using Markov-Rewards Models”, Proc. of the First International Conference on Quality of Service in Heterogeneous Wired/Wireless Networks (QSHINE04), IEEE, pp. 92-99, Dallas, Texas, USA, (2004).
12. J.F. Meyer, Performability Evaluation of Telecommunication Networks, in: Teletraffic Science for Cost-Effective Systems, Network and Services, edited by M. Bonnati, ITC-12, pp. 1163-1172, Elsevier Science Publishers B. V. (North Holland, 1989).
13. I.V. Martín, J.J. Alins-Delgado, M. Aguilar-Igartua, and J. Mata-Díaz, Performability Analysis of an Adaptive-Rate Video-Streaming Service in End-to-End QoS Scenarios, 16th IFIP/IEEE Distributed Systems: Operations and Management, LNCS 3775, 157-168 (2005).
14. Y. Bernet et al., RFC 2998: A Framework for Integrated Services Operation over Diffserv Networks, (2000).
15. U. Sarkar, S. Ramakrishnan, and D. Sarkar, Study of long-duration MPEG-trace segmentation methods for developing frame-size-based traffic models, Computer Networks 44(22), 177-188 2004).
16. Min Wu, R.A. Joyce, Hau-San Wong, Long Guan, and Sun-Yuan Kung, Dynamic Resource Allocation via Video Content and Short-Term Traffic Statistics, IEEE Transactions on Multimedia 3(2), 186-199 (2001).
17. A. Mashat and M. Kara, Performance Evaluation of a Scene-based Model for VBR MPEG Traffic, Performance Evaluation IFIP WG7.3 36(1), (1999).
19. R. Vallejos and M. Barria, Evaluation of Moments of Cumulative Reward in Repairable Systems, Universidad Técnica Federico Santa María Technical Report (unpublished), (2005).
20. A.S. Elmaghraby, A. Kumar, M.M. Kantardzic, and M.G. Mostafa, Bandwidth Allocation in a Dynamic Environment Using a Variable Pricing Policy, 7th International Symposium on Computers and Communications (ISCC’02), IEEE, pp. 589-594, (2002).

![Table 1. Estimated required resources, RSV [bits/GoP].](https://thumb-us.123doks.com/thumbv2/123dok_es/4748410.59918/8.595.150.458.588.652/table-estimated-required-resources-rsv-bits-gop.webp)


