A Proposal of Knowledge Engineering Metrics
Ødwin Hauge1,2, Paola Britos3 and Ramón García-Martínez3,2
1. Norsk Teknisk Naturvitenskapelig Universitet. Norway
2. Intelligent Systems Lab. School of Engineering. University of Buenos Aires. Argentine 3. Software & Knowledge Engineering Center. Graduate School. Buenos Aires Institute of
Technology. Argentine
Abstract: Metrics used on development of expert systems is not a well investigated problem area. This article suggests some metrics to be used to measure the maturity of the conceptualization process and the complexity of the decision process in the problem domain. We propose some further work to be done with these metrics. Applying those metrics makes new and interesting problems, concerning the structure of knowledge to surface.
Key Words: Expert Systems. Metrics. Complexity of the decision process
Workshop: Agentes y Sistemas Inteligentes (WASI)
1. Metrics
In software development measurement is used to provide some type of quantitative information to a decision making process, in many cases related to a development project. The measurement can be on the production process or on the product it self [1, 2, 3, 4]. A metric should have different qualities to be applicable [5, 6]. It should as said be quantitative, but also objective, easy to find and well defined with a defined domain. The process of developing software is not trivial and measurement is done with relatively high uncertainty, but there are several metrics that are widely used today.
2. Suggested Metrics
In this section we propose some metrics that will examine the problem domain. We will give interpretations of the metrics and will describe the expected development of the metrics throughout a development project. A metric should as mentioned have certain qualities as simplicity to be applicable. In the representations of knowledge there are several things that have these qualities. Rules, concepts, attributes and levels of decomposition are easy to count, they are objective and they are easy to find. These things are therefore good candidates to be included in a metric. Then our suggested metrics are based on rules, concepts, attributes and number of decomposition levels.
2.1. Number of Concepts, Number of Rules or Number of Attributes
metric to be increasing all the way throughout the project and converge to an unknown number at the end of the project. Since their values will increase all the way throughout the project it is hard to use them as a metric for maturity. But it could be an indication of maturity when their numbers converge. The table 1 shows the interpretations of these metrics.
Result Cause
Low
Few known concepts, rules or attributes
• The problem area is simple
• We do not know many of the concepts in the domain yet
High
Many known concepts, rules or attributes
• The domain is complex with many concepts
[image:2.595.56.539.167.298.2]• We have good knowledge about the domain
Table 1 interpretations of results from “counting metrics”
These metric could be more useful if the results are compared to history from other projects in the same stages. When comparing to history data it could get an indication of the complexity of the project. These metrics will also be combined to others in the following sections.
2.2. Number of Concepts in a Rule / Number of Concepts
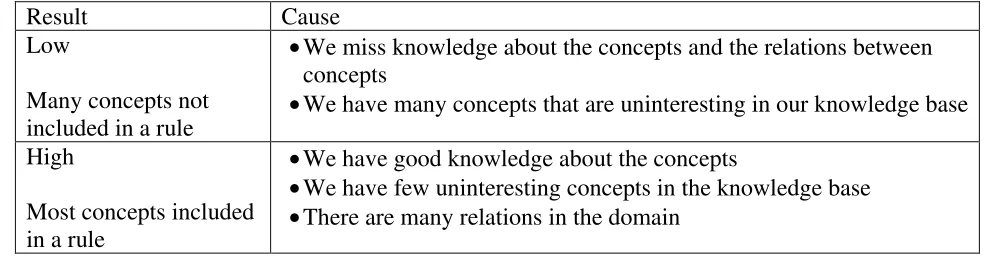
The number of concepts in a rule is the concepts that are already included in a rule. If you have 10 concepts and 7 of them are included in one or more rules the ratio will be 0.7. We believe this metric should converge to 1 when the project matures. The value will of course vary when you find new rules and new concepts. The value of this metric will decrease when we discover new concepts and increase when we include a new concept in a rule. If the value of this metric does not converge to 1 we either miss knowledge about relations between concepts in the domain or we have concepts in our knowledge base that are not used and most likely uninteresting. These concepts should therefore be removed. The interpretation of this metric is shown in the table 2.
Result Cause
Low
Many concepts not included in a rule
•We miss knowledge about the concepts and the relations between concepts
•We have many concepts that are uninteresting in our knowledge base
High
Most concepts included in a rule
•We have good knowledge about the concepts
•We have few uninteresting concepts in the knowledge base
•There are many relations in the domain
Table 2 interpretation of results from “concepts in rule/concepts”
[image:2.595.49.542.532.666.2]2.3. Number of Attributes in a Rule / Number of Attributes
This metric is similar to the previous one but we expect it to be easier to discover the concepts that the attributes. Because the attributes may not be discovered before we need them it is a bit difficult to use them as a measure of maturity. But if we have unused attributes we may miss something or we have included attributes that are unnecessary. If this is the case we should look at the reason and especially if the value of this metric is low. This metric could therefore be used as an indicator or alarm.
2.4. Number of Concepts / Number of Rules
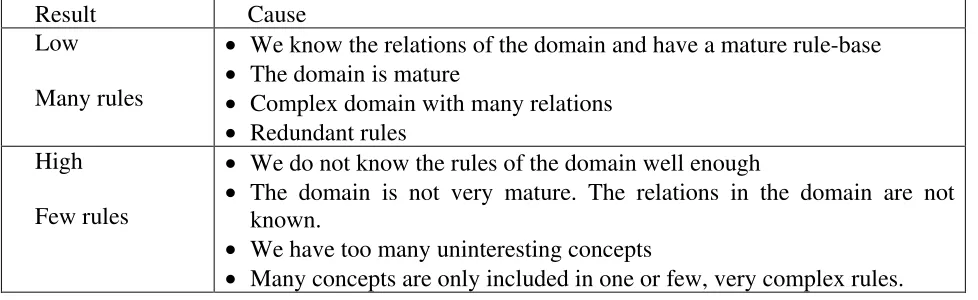
This metric shows the development of the number of rules compared to the number of concepts. We expect that most concepts contribute to the creation of at least one or most likely several rules. And with good knowledge about the relations in the domain this metric will in most cases decrease below 1.0. In highly related problem domain will the value be much lower than 1.0. This metric can still have a high value at the same time as we have a mature knowledge base. In the cases where the domain only contains a small set of very complex relations the number of rules will be low, but the number of concepts will be high. we recommend combining this metric with some metric for complexity of the domain. Interpretation of the metric is found in Table 2.
Result Cause
Low
Many rules
• We know the relations of the domain and have a mature rule-base
• The domain is mature
• Complex domain with many relations
• Redundant rules High
Few rules
• We do not know the rules of the domain well enough
• The domain is not very mature. The relations in the domain are not known.
• We have too many uninteresting concepts
[image:3.595.56.545.383.533.2]• Many concepts are only included in one or few, very complex rules.
Table 2 interpretation of “concepts/rules”
2.5. Average Number of Attributes per Concept
Result Cause Low
Few attributes per concept
• The problem domain is simple and each concept have few interesting attributes
• There are many concepts with few attributes
• We do not know the problem domain well, we have not discovered all the necessary attributes
High
Many attributes per concept
• The domain is big and complex
• There are few concepts with many related attributes
[image:4.595.53.538.115.261.2]• We have good knowledge about the problem domain
Table 3 interpretations “Average attributes/concept”
2.6. A*(Number of Concepts) + B*(Average Number of Attributes Per Concept)
To get a better indication of the complexity of the project we suggest combining the number of concepts and the average number of attributes per concept. This will remove the different outcomes in average number of attributes per concept that was caused by the number of concepts. To be able to get a reasonable result the two metrics must be weighted by the factors A and B. To be able to find values for these factors we propose using history data. This is not within the scope of this paper and will therefore not be done here.2.7. Average Number of Levels in Decision Tree
For the tasks that are decomposed this average will most likely increase throughout the project and stabilize to the end of the project. The metric is calculated by just counting the levels of the decision trees, add them, and divided the sum on the number of trees. Given the example in Figure 1 we will get the following result: (4+3)/2=3.5.
Figure 1 decision trees
[image:4.595.88.521.523.709.2]Result Cause Low
Few levels of decomposition
• The domain is simple
• We have not decomposed the decisions
• We do not have complete knowledge about the domain
• We have discovered all decisions but not decomposed they yet High
Many levels of decomposition
• The domain is complex
• We have good knowledge about the domain
[image:5.595.56.537.113.247.2]• We totally miss information about some decisions in the domain, which would have decreased the average.
Table 4 interpretation of results “Average levels in decisions”
2.8. Average Number of Concepts Included in Each Rule
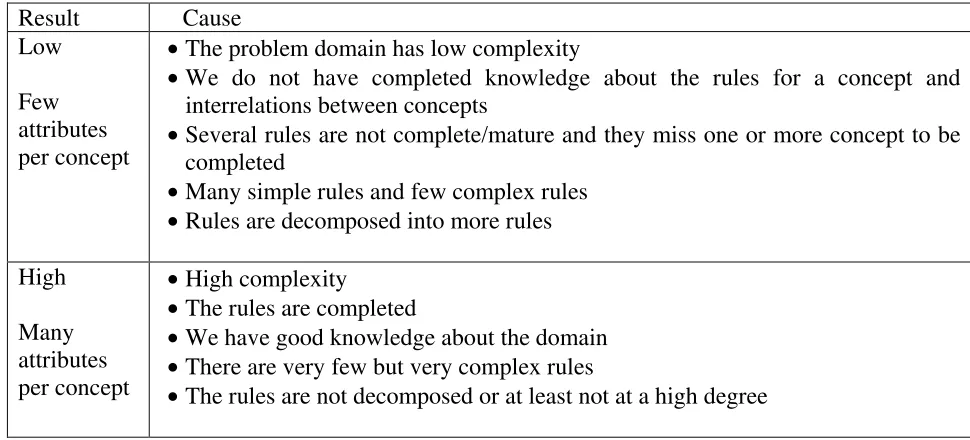
Each rule contains one or more concepts. The number of concepts included in a rule could be a measurement of the complexity of the problem. We expect this number to be increasing as we discover more complex relationships within the problem domain. At the end of the project we suggest that the value converges to a constant. This convergence could be an indication of maturity of the knowledge base. The table 5 shows our interpretations of this metric. We see that the number of rules and the degree of decomposition affects the outcome of this metric, but if the average is high it is likely that we have a complex domain.
Result Cause Low
Few attributes per concept
•The problem domain has low complexity
•We do not have completed knowledge about the rules for a concept and interrelations between concepts
•Several rules are not complete/mature and they miss one or more concept to be completed
•Many simple rules and few complex rules
•Rules are decomposed into more rules
High
Many attributes per concept
•High complexity
•The rules are completed
•We have good knowledge about the domain
•There are very few but very complex rules
•The rules are not decomposed or at least not at a high degree
Table 5 interpretations “Average concept in each rule”
2.9. Average Number of Attributes Included in Each Rule
[image:5.595.53.538.421.641.2]2.10. A*Average Number of Attributes in Rule + B*Number of Rules + C*
Average Number of Decomposition Levels
To try to remove the dependencies from the previous metric we would suppose to combine attributes, rules and decomposition levels into one metric to better understand the complexity of the domain. The constants A, B and C must be found with use of historical data.
2.11. Average Number of Rules Each Concept Is Included in
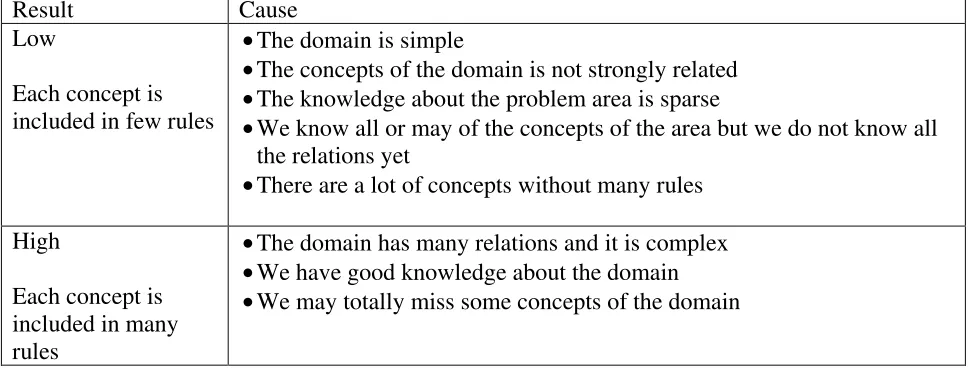
One concept could be included in one but most likely more than one rule. The average number of rules a concept is included in could give us an indication of complexity. We expect it to increase throughout the project as more rules are made. If there is found a lot of new concepts it may decrease a bit. But in the end of the project we think it is more likely to find more rules than new concepts. If the number of concepts is very high the number of rules could be low and we could still have a very complex domain. At the end of the project we believe this metric should converge and thus it could be used as an indication of maturity. The table 6 shows our interpretations of this metric.
Result Cause
Low
Each concept is included in few rules
•The domain is simple
•The concepts of the domain is not strongly related
•The knowledge about the problem area is sparse
•We know all or may of the concepts of the area but we do not know all the relations yet
•There are a lot of concepts without many rules
High
Each concept is included in many rules
•The domain has many relations and it is complex
•We have good knowledge about the domain
[image:6.595.56.541.360.548.2]•We may totally miss some concepts of the domain
Table 6 interpretations “Average rules each concept is in”
2.12. A*Average Number of Rules Each Concept Is Included in*B*Number of
Concepts
To remove the dependency of the number of concepts from the last metric we would propose to combine the previous metric with the number of concepts. The constants must, as mentioned, be found by use of history data.
2.13. Average Number of Rules Each Attribute Is Included in
Result Cause Low
Each attribute is included in few rules
•The domain is simple
•We do not have a mature knowledge base
•The domain is not strongly related
•We do not have a lot of knowledge about the domain
High
Each attribute is included in many rules
•The domain is strongly bound together
•We have good knowledge about the domain
[image:7.595.53.541.113.269.2]•We miss many attributes which would decrease this average. We have good knowledge about just parts of the domain.
Table 7 interpretations “Average rules each attribute is in”
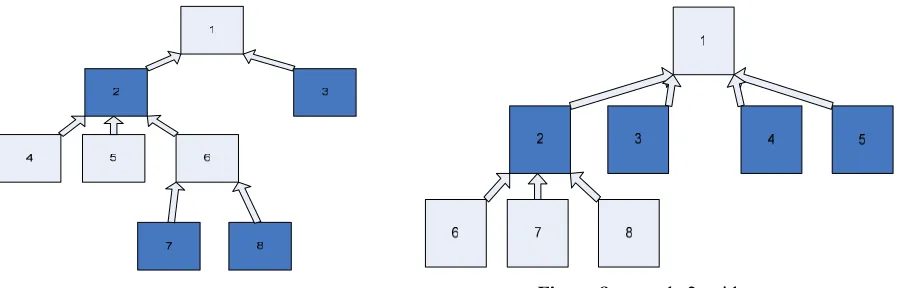
2.14. For all Levels (Number of Decisions at Level i*i) / Total Number of
Decisions
[image:7.595.85.534.436.580.2]This metric will give an indication of the tree width of the decision trees. If the main decisions consist of many different decisions of if the decisions and the end of the tree are very detailed. We expect that the value of this metric will be increasing throughout the project and stabilize at some point between 1.0 and the depth of the tree. To better understand the metric please see example 1 in Figure 8 and example 2 in Figure 9.
Figure 8 example 1: deep tree Figure 8 example 2: wide tree
With the number of decisions at a level, times the level, for instance 2 decisions at level 4 in Figure 8 will give 2*4. The two examples in Table would give these results respectively:
Example Result
[image:7.595.174.423.640.727.2]1 875 . 2 8 ) 4 * 2 3 * 3 2 * 2 1 * 1 ( = + + + 2 25 . 2 8 ) 3 * 3 2 * 4 1 * 1 ( = + +
Table 8 result from examples
kind of decision trees we have on thus what kind of complexity we have. The table 9 shows our interpretations of this metric.
Result Cause
Low
Most decisions at a high level
•The decisions are based on many decisions at a high level (close to the root of the tree).
•The decision process is not very complex
•We have not yet decomposed the tree High
Many decisions are taken at a low level
•Few decisions are based on simple decisions. Most decisions contain many decisions at a low level.
•We have decomposed the tree
•The decision process is complex
Table 9 interpretations “Sum of Decision levels/number of decisions”
3. Applying the Metrics to Real World
To evaluate our metrics, we have used data from two finished expert systems. They were developed as part of the author’s master thesis at ITBA (see Tables 10 and 11).
System 1 Work Accidents
Reference Help Assistant on Work Risks in Argentinean Law. (See [8]).
Author Paola V. Britos
Description This system should help the user to search in the Argentinean laws for material regarding occupational accidents. A lot of time is spent by the lawyers to search for the right material and this system is meant to help them in their search.
Table 10 description of system 1
System 2 Airport Control
Reference Expert System for Decission Making Training in an Information & Control Air Traffic Center. (See [8]).
Author Jorge Salvador Ierache
Description The system described in this thesis is a decision support system for airport control towers.
4. Some Results
We will here present the results from the expert systems described in the last section:
Number of Concepts, Number of Rules or Number of Attributes
System number 1 2
Number of Concepts 17 20 Number of Attributes 81 126 Number of Rules 472 155
These metrics are used as basis for other metrics. But they can also give an indication of the size of the system we have. We see that system 1 has quite many rules. This is because the system contains several simple rules concerning selection of the right document or right law to look up.
Number of Concepts in a Rule / Number of Concepts
System number 1 2
Number of Concepts in a Rule
7 19
Number of Concepts 17 20
Result 0.41 0.95
This metric indicates that system 1 has several concepts that are not related to anything and the knowledge engineer should therefore start working with those concepts.
Number of Attributes in a Rule / Number of Attributes
System number 1 2
Nber of Attributes in a Rule
50 121
Number of Attributes 81 126
Result 0.62 0.96
We see the same indication here as we did with the last metric. System 1 needs to focus on those concepts and attributes not included in any rule or at least find the explanation of the result.
Number of Concepts / Number of Rules
System number 1 2
Number of Concepts 17 20 Number of Rules 472 155
Result 0.04 0.13
These resulting numbers are very small and it is hard to give some conclusions based on these numbers. But it could be interesting to follow the development of this figure throughout a project.
Average Number of Attributes per Concept
System number 1 2
Number of Attributes 81 126 Number of Concepts 17 20
Average 4.76 6.3
The number of attributes per concept can give us an indication of the complexity of the concepts in the domain. We observe that the result indicates that system 2’s domain is more complex.
Average Number of Levels in Decision Tree
System number 1 2
Decomposed decisions
NA NA
Average NA NA
Average Number of Concepts Included in Each Rule
System number 1 2
Average 1.24 1.64
We see that system two has more concepts included in a rule. This is an indication that system 2 may have a more complex domain.
Average Number of Attributes Included in each Rule
System number 1 2
Average 2.17 2.81
This metric is very similar to the previous one and it indicates the same. The domain of system 2 is more complex than the one of system 1.
A*Average Number of Attributes in Rule + B*Number of Rules + C* Average Number of Decomposition Levels
System number 1 2
Attributes in rule 2.17 2.81 Number of rules 472 155 Average
decomposition levels
NA NA
Sum NA NA
We will use all the constants set to 1 since we do not have any historical data from previous projects.
Decision trees were as mentioned above not used in any of the projects. Because of that we omitted applying this metric.
A*Average Number of Rules each Concept Is Included in*B*Number of Concepts
System number 1 2
Average rules each concept is in
34.5 15
Number of concepts 17 20
Sum 586.5 300
We have also used 1 for the constants in this metric since we do not have any historical data so far.
These results indicate that domain 1 is a bigger domain with several relations.
Average Number of Rules each Attribute Is Included in
System number 1 2
Result 12.6 3.45
We see the same here as we did in the two last metrics. System 1 has more relations between the attributes then system 2.
Average Number of Rules Each Concept Is Included in
System number 1 2
Average 34.5 15.0
We see that system 1 has more discovered rules in average that system 2. This could be an indication of fewer relations in domain 2.
For all Levels (Number of decisions at level i*i) / Total Number of Decisions
System number 1 2
Result NA NA
5. Conclusions
The intention of this paper was examining the problem domain and showing the need for metrics in this domain. The metrics were suggested with a theoretical background to create a discussion around use of metrics in the conceptualization phase of an expert system development. We applied most of the proposed metrics to two different expert systems. This is not a large enough data set to draw any statistical conclusions. At this point the metrics serve as indicators and the trend seems to be that system 2 has a more complex domain that system 1. This seems reasonable enough. System 2 is an airport control system and system 1 is a system for finding the right law or text concerning accidents at work. The metrics also show concepts which are not included in any rule. This should alert the knowledge engineer and tell him to focus on these concepts.
6. References
[1] García Martínez, R. & Britos, P., 2004, “Ingeniería de Sistemas Expertos” (Nueva Librería. Buenos Aires).
[2] SEI, 2004, “Software Metrics, SEI Curriculum Module SEI-CM-12-1.1”, (Carnegie Mellon University Software Engineering Institute, Pitsburg, ftp://ftp.sei.cmu.edu/ub/education/ cm12.pdf, downloaded 2004-09-22)
[3] Ford, G., 2004, “Measurement Theory for Software Engineers”, (Pressman & Associates, Inc., at: http://www2.umassd.edu/SWPI/curriculummodule/em9ps/em9.part3.pdf, downloaded 2004-09-24)
[4] Firestone, J., 2004, “Knowledge Management Metrics Development: A Technical Approach” (Executive Information Systems, Inc., at: http://www.dkms.com/papers/kmmeasurement.pdf, downloaded 2004-10-02).
[5] Nilsson, N., 1998, “Artificial Intelligence: A New Synthesis” (Mrgan Kaufmann, Palo Alato) [6] García Martínez, R., 1987, “Calidad de Bases de Conocimiento. Una Medida de Evaluación”
Proc. del III Congreso Internacional de Informática y Telecomunicaciones. (Usuaria, Buenos Aires), Pág. 191-198.
[7] Britos, P., 2001, “Help Assistant on Work Risks in Argentinean Law” (in spanish), Master Thesis on Knowledge Engineering (School of Computer Science, Politechnic University of Madrid).