Effects of applying the site map principle in an online learning environment in higher education
8
0
0
Texto completo
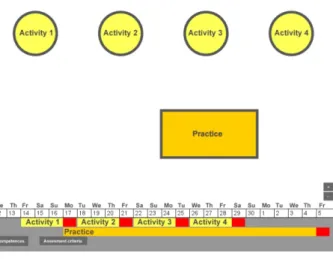
(2) SPECIAL FOCUS PAPER EFFECTS OF APPLYING THE SITE MAP PRINCIPLE IN AN ONLINE LEARNING ENVIRONMENT IN HIGHER EDUCATION Several Learning Management Systems (LMSs) have been developed during the last two decades, such as the UOC LMS [17], Blackboard [20], Moodle [21], Sakai [22] or, more recently Future Learn [18], EdX [19], Claroline [23], Udacity [24], Wemooc [25], Udemy [26], Coursera [27], Collaborize [28], Desire2learn [29], Exploros [30], Agilix BrainHoney LMS [31], Epsilen Learning Management System [32], Follett Aspen [33], Instructure Canvas [34] or Pearson LearningStudio [35].. resources and activities. In her experiments Shapiro employed an interface design in the learning resources which embedded the scaffolding [16]. “Giving learners a view of the big picture provides a perspective on the domain in general and can aid in the creation of global cohesion” [36]. One issue we have tried to overcome with this study is the fact that research in this area has usually been conducted in laboratory experiments [8]. We are conducting our research in a natural and real setting. Specifically, the research has been conducted in a virtual classroom at the UOC, in a higher education degree. Consequently, it can provide more accurate results than laboratory-based research. In other words, this research can give a better idea of what happens when this principle and this interface are applied in a natural setting and in a real learning process. Finally, we remark that we had to design an ad hoc interface instead of adapting the UOC virtual classrooms to the site map principle because the institution does not allow changes to the classroom without evidence supporting them. This is one of the reasons for this pilot. III.. Figure 1: UOC’s virtual classroom. The key teaching and learning elements that can be found in these platforms are very similar, although they appear under different names or visual formats. They are: activities, learning outcomes, evaluation, calendar or planner, discussion boards, resources, notes, teaching plan or syllabus and learning progress. LMSs are becoming increasingly visual. However, they are still organized as wireframes and they are not taking advantage of the huge potential that data visualization offers. A move towards more visual LMSs (or MLMSs) could allow the representation of complex information in an organized and easy way. This ideal MLMS would allow students to develop the educational activities while being aware of the relationships among all the elements that make up the learning process (learning outcomes, activities, etc.). With this goal we are going to use and evaluate the map site principle. According to Shapiro, the site map principle should provide a "bird's eye view of a hypermedia site” [8]. This principle, then, becomes very important in VLEs for distance learning where the entire learning process has to be guided through a web interface. In this context, the function of the graphic map will be to orient learners to avoid cognitive overload and provide access to the learning resources. The interface can help learners find resources in an easier way and it prevents their disorientation in the information space [16]. The web interface, then, was designed trying to fulfil students’ need for guidance through the learning process. First, as already mentioned, this tool would allow users/students to get a precise idea of the structure and content of the course at first glance. Second, the interface should also give information about the time of study, aims, progress and performance. Third, this information should appear as an easily interpretable graphic representation. Finally, the interactivity should provide links to the. 32. LEARNING MANAGEMENT SYSTEM (LMS). THE VISUAL INTERFACE. This section sets out the characteristics of the learning environment interface designed to test the site map principle in a university. It was designed to perform the following functions: A. To guide the learning process, allowing users to get a better sense of content and structure. The graphic representation is designed to work as a guide in the learning process. The interface provides students with all the information on the learning actions to be carried out throughout the module. It is a representation of the learning project, so students will not need any other additional module planning or syllabus. All the information related to the learning project must be represented in a graphic and interactive way. Figure 2 illustrates the first view of the interface. It shows the set of programmed activities and a description of the learning objectives (LOs) to be achieved in each task. At the bottom of the screen, there is a calendar with the recommended timing for this specific set of tasks, which also appears in the calendar timeline as starting date and deadline. As a result, students always have access to the planning information.. Figure 2: Learning project. http://www.i-jet.org.
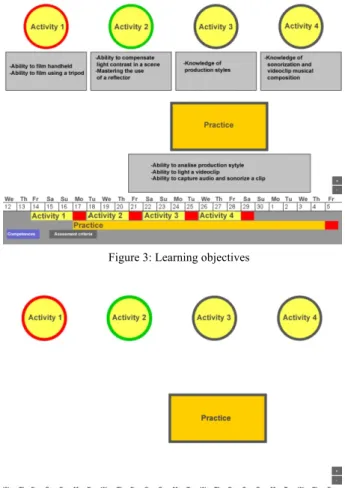
(3) SPECIAL FOCUS PAPER EFFECTS OF APPLYING THE SITE MAP PRINCIPLE IN AN ONLINE LEARNING ENVIRONMENT IN HIGHER EDUCATION There are also two buttons that provide more information about the tasks: intended LO and evaluation criteria for each task.e If the students click on the LO button, for example, detailed information about which LO will be worked on will appear at the bottom of each activity (as shown in Figure 3). Students can show or hide this information by simply clicking on the button. B. To show the relationships between resources, contents and other information. Graphic representations are excellent for describing the relationships between objects and information [37]. This graphic representation will show the relationship between data, resources and contents as well as the relationship between each activity and the LOs. Currently students expect rich navigation experiences [38]. Online students frequently expect to navigate through maps and to extract underlying information from complex visual systems. For example, Google Maps illustrate how data can be added to a map, allowing us to access complex related information. The learning project will therefore be represented as a trip through the course activities, situating them as the structural feature. Traditionally, a linear navigation through contents has been used, but we will plan the learning process over a “map” through the student’s activity as “route”. The graphic representation of the activities will contain the resources and content needed to develop them. C. To show continuously updated assessment (summative and formative) information. The interface will display data about students’ performance. The shape of the representation of the task indicates the type of activity: a circle when it is a non-compulsory and formative task and a rectangle when it is compulsory and summative task. The border of the activities is colour coded to show planning and assessment information, as illustrated in Figure 4. The lecturer marks the tasks finished on time: they are framed in green when the task was assigned a pass mark and in red otherwise. When the activity has a grey border it means it has not been completed yet. As we can see in figure 4, the interface displays information about the relationship between activities and their timing. D. To access the learning resources and content. The interface is the means students use to navigate through and interact with the contents and learning objects. Navigation is easy and intuitive in order to allow students to move to any resource in the module. There are levels of representation (from a general view of the module to a specific view of learning objects and assessment tasks) and navigation through these different levels is carried out by zooming in and out (Figure 5). As mentioned above, at first sight students find the full structure for the course syllabus. They are able to zoom, go inside an activity and observe the learning resources, content or practical tasks. The different nature of the resources is represented with icons linked to the resource, so students can access the learning objects simply by clicking on the icons. The interface is always visible. Navigation through the contents is easily. As illustrated in Figure 5, when zooming in from the global view, more detailed information on the objects appears. Through this interface providing access to learning resources, students have got the learning project at hand. If they go in greater depth into a task, they visualize all the learning objects and learning resources for that activity. iJET ‒ Volume 10, Issue 7: "ALICE 2014", 2015. and have access in an easy way to any module resource, without losing the relationship with the full structure, the LOs and the assessment criteria. The interface, thus, provides access to any level of description of the module and students can navigate through the contents and visualize the academic relationship between them. As the figures show, the information on timing and the buttons with respect to LOs and assessment criteria are always visible. Students always have information about the timing of the activities and can access the tasks assessment and be aware of the achievement of LOs. All this. Figure 3: Learning objectives. Figure 4: Shape and colour codes. Figure 5: Learning resources and zoom. 33.
(4) SPECIAL FOCUS PAPER EFFECTS OF APPLYING THE SITE MAP PRINCIPLE IN AN ONLINE LEARNING ENVIRONMENT IN HIGHER EDUCATION simplifies access to relevant information that in traditional VLEs takes several clicks and potentially complex navigation. With this design students do not need to return to a global view or menu page to access assessment, evaluation and LO information, thus ensuring no relevant information is lost and, more importantly, ensuring that the relationship between these elements is not lost. IV.. METHOD. A. Aims and hypothesis The first aim of this study was to evaluate students' learning satisfaction through the designed interface and to assess whether student satisfaction increases when they work on the new learning environment. Thus, and informed by the reviewed research, we formulated the first hypothesis: H1: The interface has a positive impact on students' satisfaction In this study satisfaction is defined as the perception on the fulfilment of students’ expectations, needs, and the feeling of achievement derived from learning on the interface. In other words, satisfaction is a measure of the students’ perceptions while navigating and accessing learning information through a visual interface. The second aim of this study was to identify the effect of the interface on students' performance and on promoting an active role towards learning. It was assumed that greater student activity improves the learning process and helps them retain knowledge [9]. Two further hypotheses were therefore formulated: H2. The interface has a positive impact on student performance H3. The interface has a positive impact on the active role of students Measurements We measured students’ academic performance by comparing the grades obtained in the same tasks by the experimental and by the control group (with possible values between 0, minimum, and 10, maximum). The submitted activities are an indicator of the active role. We measured the active role of students by comparing the number of optional activities completed by each group. 1) Variables The dependent variables in our study are student satisfaction, student’s performance and student’s active role. All of them combined would lead to learning improvement and to enhancement of the learning experience. The control variable is the use or non-use of the visual interface designed. Finally, the controlled variables are: • Module: All students are enrolled in the same module "Producción y edición de video digital" (Digital video production and editing) in a Multimedia Degree. • Lecturer: The lecturer is the same for both the experimental and control group. • Content: The content and topic covered in the educational resources remains exactly the same for both groups. • Tasks and activities: The compulsory and noncompulsory activities are the same for both groups.. 34. • Assessment criteria: The criteria are the same for the experimental and the control group. • Schedule: The timing is identical for both groups. B. General description of the experiment The study aimed to determine whether a visual interface for e-learning designed following the site map principle [8] and using graphic representations had an effect on students’ satisfaction with the learning process and students’ academic performance. We used an experimental approach for this study. The population of the study comprised undergraduate students from the Multimedia Studies at the Open University of Catalonia (UOC). A total of 115 students volunteered to participate in the study. They were randomly assigned to the experimental (54) or control group (61). However the choice of the module was based on convenience. We chose a module with two groups of students taught by only one lecturer in order not to introduce bias by teacher performance. This is an exploratory study. Hence, we advise caution in interpreting the results. Informed consent was obtained from all participants. Privacy, confidentiality, and anonymity were ensured. Moreover, there was assurance that taking part in the research would not affect their learning process. C. Procedure The teaching and learning activity of the selected module was moved from the UOC LMS to the new interface designed to test the site map principle for the experimental group. The specific technical and practical features of this module should be stressed. The trial took place over three teaching weeks and students, both in the experimental and the control group, needed to carry out nine tasks: TABLE I. TYPES OF ACTIVITIES. Tasks Reading chapter 1 Task 1 Reading chapter 2 Task 2 Reading chapter 3 Task 3 Reading chapter 4 Task 4 Assignment (second compulsory assignment of the course).. Type Compulsory Optional Compulsory Optional Compulsory Optional Compulsory Optional Compulsory. The control group undertook all these tasks through the typical UOC LMS online classroom. The experimental group undertook them through the on porpoise designed visual interface. In order to assure that no other aspects could affect the results, identical conditions were maintained in both groups: lecturer, resources, optional tasks, LOs, compulsory tasks and assignments. Likewise, one of the measurement tools for this experiment was the mark achieved for the exercise, although account was also taken on the number of submitted assignments (compulsory and. http://www.i-jet.org.
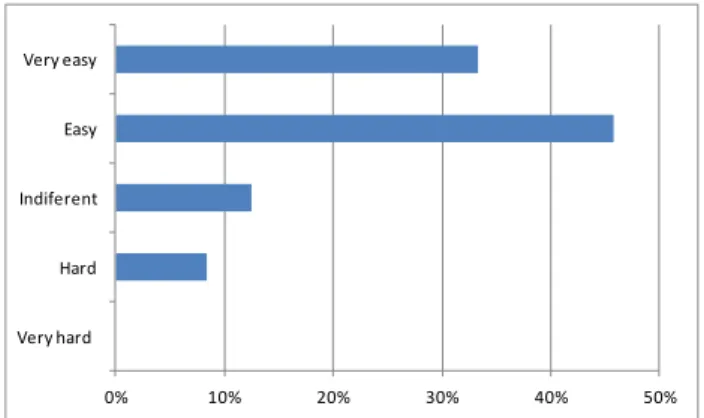
(5) SPECIAL FOCUS PAPER EFFECTS OF APPLYING THE SITE MAP PRINCIPLE IN AN ONLINE LEARNING ENVIRONMENT IN HIGHER EDUCATION summative) and optional activities (formative) and they were compared with the control group. It should be noted that the marks from a previous activity carried out outside the interface for both groups were recorded and taken into account in order to achieve a measurement reference for each group level due to chance (e.g. a bigger number of better students in one group by chance). This activity is called the first assignment. After completing the described teaching period students were given a survey to assess their perceptions about the effect of the visual interface in their learning experience. The survey was administered only to students of the experimental group because students of the control group continued their study in the UOC classroom. Survey Measurement was carried out through an online questionnaire using the Netquest tool [39] and distributed to all participants, who received an email in their inbox at the UOC’s online campus. The questionnaire asked about participants’ opinions, attitudes and feelings regarding the interface. Given the lack of previous questionnaires and measurements the questions included were reviewed and validated by five experts in the area. The questionnaire was quick and easy to answer in order to maximize the number of respondents, which was 44.44 per cent (24 out of 54). It combined closed and open-format questions. Closed questions used Likert scales [40] asking for easiness and agreement. In order to test H1, four questions regarding interface use were asked: i) Students’ perceptions of their capacity to assimilate and manage information quickly (from very easy to very hard); ii) Students’ perceptions of their assimilation and capacity to manage information easily (from very easy to very hard); iii) Students’ perceptions of a deeper understanding of knowledge by graphically illustrating data in effective ways and a greater comprehension by showing hidden relationships between information (completely agree to completely disagree). We also asked about their global satisfaction with the experience of learning through the visual interface (rating from 0 –not satisfied at all– to 10 –completely satisfied). D. Analysis In order to test H1, descriptive statistics and Kendall correlation test were used to analyze the satisfaction results of this study. Inferential statistics were used to analyze the academic results and participation level of this study. In order to test H2, performance comparison between the control and the experimental group was carried on, as well as another comparison between the academic results of the first and second compulsory assignment. T-tests were used for comparisons, after checking the normality of the data with the Lilliefors test. In order to test H3, the same comparison studies were made as in H2, measuring the number of presented noncompulsory activities instead of academic results. Chi-. iJET ‒ Volume 10, Issue 7: "ALICE 2014", 2015. squared tests are used here since this kind of data does not have a continuous distribution. Finally, we used the Kendall correlation test to check whether there was a correlation between H2 and H3. V.. RESULTS. A. Global satisfaction and interface impact First, we describe the results regarding the students´ satisfaction about learning through the visual interface. The questionnaire was answered by 24 students out of 54 within the experimental group. For questions regarding i), students found mainly easy or very easy to assimilate and manage information quickly with the visual interface (figure 6), with an evaluation of 3.3±0.3, with 4=very easy, 3=easy, 2=hard and 1=very hard. ()*+,).7+. 6.7+ 12/34)*)25 0.*/ ()*+,-.*/, !". #!". $!". %!". &!". '!". Figure 6: Survey scores regarding information assimilation. Concerning ii), students thought it was easy or very easy to study with a visual interface (figure 7), with an evaluation of 3.2±0.3, with 4=very easy, 3=easy, 2=hard and 1=very hard. ()*+,).7+. 6.7+ 12/34)*)25 0.*/ ()*+,-.*/, !". #!". $!". %!". &!". '!". Figure 7: Survey scores regarding easiness study. In feature iii), the respondents experienced a good understanding of knowledge (figure 8), obtaining 4.1±0.5, with 5=completely agree, 4=agree, 3=indifferent, 2=disagree and 1=completely disagree. On a scale from 0 (lowest) to 10 (highest), the answer to the specific question about global satisfaction with the proposed learning interface was 7.5±0.8. Figure 9 describes the frequencies for global satisfaction. Finally, we used the Kendall correlation test with a confidence level of 95 and we can say that: The visual interface has guided often or always the students in the learning process when the overall assessment. 35.
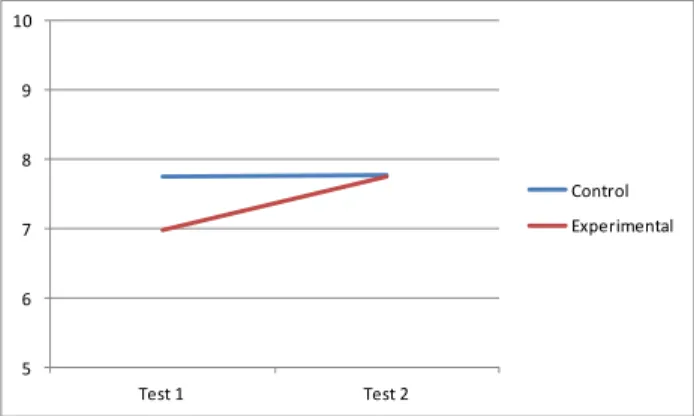
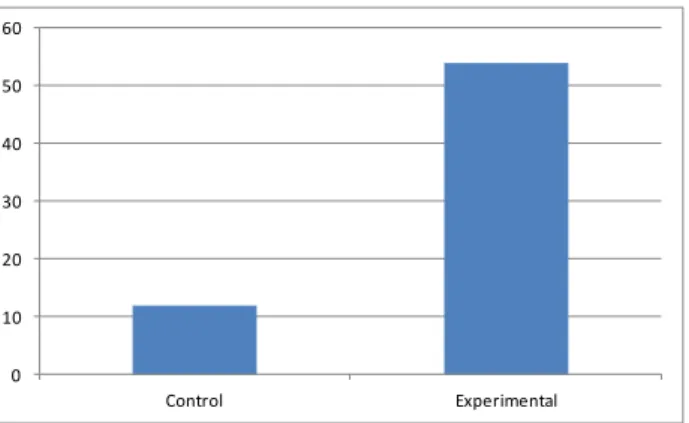
(6) SPECIAL FOCUS PAPER EFFECTS OF APPLYING THE SITE MAP PRINCIPLE IN AN ONLINE LEARNING ENVIRONMENT IN HIGHER EDUCATION on access to information through a visual interface is positive or very positive (p<0.05), (r=0.73). The visual interface has guided often or always the students in their learning process when assessing the overall browsing experience in the visual interface is positive or very positive (p<0.05), (r=0.70). ()*+,-.-,/0456--0. ;56-8912:-6-9.0 723456--0 ()*+,-.-,/0123456--0 !". #!". $!". %!". &!". '!". Figure 8: Survey scores regarding deepen understanding $. group revealed significantly different mean marks (p<0.014) between these two assignments, with the second one (which used the proposed interface) giving a higher value (7.76±0.40) than the first one (6.98±0.45). The first assignment reveals a significant mean mark difference between the control and the experimental groups (p<0.012), which was not found for the second assignment (p>0.05). Thus, a group with worse initial academic results (the experimental one) achieved a similar academic performance as the other one (the control group) when using the proposed interface (figure 10). Note that the experimental group started with worse marks than the control group and achieved similar results to it after working with the proposed interface. In Test 1, both groups worked with standard UOC materials and LMS, while in Test 2, the experimental group worked with the proposed interface and the control group worked with the standard materials. &'. % $ ./0+1/2. %. 345)167)0+82. #. & '. ". #. (. !. ). ()*+,&. *. Figure 10. Academic performance comparison between two tests and two groups. +. $! !". #". $!". $#". %!". %#". &!". Figure 9: Survey scores regarding global satisfaction. The visual interface has guided often or always the students in their learning process when explicit relationship between the skills, resources and assessment criteria (p<0.05), (r=0.68). The visual interface has guided often or always the students in their learning process when access to educational resources through the interface was easy or very easy (p<0.05), (r=0.61). Although we can accept hypothesis 1 and we suggest that the interface has a positive impact on students' satisfaction it is necessary to conduct more research to prove it because we rely on descriptive data and a low number of responses. B. Academic performance Academic results were measured for the multimedia degree course to test H2. The use of the proposed interface took place during development of the second assignment of the course and only with the experimental group, allowing us to compare the results of this group with a control group. We made use of hypothesis testing Student's t-test for comparisons between groups, as the distribution of grades is normal, according to the Lilliefors test (p>0.05). The control group obtained similar mean marks (significance of p>0.05) in the first (7.75±0.37) and second (7.77±0.39) assignments. However, the experimental. 36. ()*+,-. The active role of students was used to test H3, measured by the amount of assignments submitted. The number of assignments completed and submitted in each of the two assignments was not significantly different between groups (two sample chi-squared tests are used, here since this kind of data is neither normally distributed nor has a continuous distribution). Nevertheless, it reveals different levels of participation (p<0.03) for non-compulsory activities: the experimental group submitted over four times the amount of optional activities submitted by the control group. The amount of submitted optional activities made by both groups before the use of the interface (the first part of the course) revealed no statistical differences (p>0.05) suggesting a higher level of engagement for students using the new visual interface (figure 11). Finally we present the correlation between performance and active role. We made use of the Kendall correlation test. Both groups show significant correlation. In the case of the control group, the correlation is significant (p<0'005), (r=0.22). In the case of the experimental group the correlation is very highly significant (p<0'0001), (r=0.48), i.e. there is stronger correlation between both values in the experimental group. With these results we can accept H2 and H3 and we suggest that the interface has a positive impact on students' performance and their active role.. http://www.i-jet.org.
(7) SPECIAL FOCUS PAPER EFFECTS OF APPLYING THE SITE MAP PRINCIPLE IN AN ONLINE LEARNING ENVIRONMENT IN HIGHER EDUCATION [4]. '! &!. [5]. %!. [6]. $! #!. [7]. "!. [8]. ! ()*+,)-. ./01,231*+4-. [9]. Figure 11. Participation level in Test 2 between two groups. VI.. CONCLUSIONS AND FUTURE WORK. In order to assess the effectiveness of the “site map principle” in an online learning environment in higher education, a visual interface was developed and tested in an experimental design. The proposed interface has revealed a significant effect on students who used it. The purpose of the site map is to prevent students from getting lost in the course website and to support their learning path [8]. First, the students claim that the visual interface gives a clear idea of the content and structure of the website, supports the itinerary of student learning, and the browsing experience of a visual environment is positive. Therefore, we can verify H1: The interface has a positive impact on students' satisfaction. Second, students who use the visual interface have improved both their academic performance and increase their activity. In addition, a correlation exists between the two: the more delivery of the optional activities, the higher the performance. Therefore we can say that the interface has a positive impact on students’ performance and on the active role of students (H2 and H3). To sum up, it can be suggested that the use of graphic representations and interactive visualizations in online learning environments has great potential for supporting learning activities. They act as a guide for the learning process and prevent students from getting lost in the course’s website [8]. Therefore, it provides a fuller and enhanced learning experience. Moreover it also fosters students’ active attitudes. Future lines of research are, first, to extend the interface to a full module and, second, to continue working with other multimedia principles. This interface design also opens great potential for including learning analytics to personalize and enhance the learning experience. REFERENCES [1]. [2] [3]. R.T. Sanchez and F. Garcia, “Visual Analytics to Support Elearning” in Advances in Learning processes. Publisher: InTech, 2010. Available from: http://www.intechopen.com/books/advances-in-learningprocesses/visual-analytics-to-support-e-learning M. Rosson, Advances in Learning processes. Publisher: InTech, 2010. S.H. Jin, “Visual design guidelines for improving learning from dynamic and interactive digital text”. Computers & Education, 2013, 63, pp. 248-258. http://dx.doi.org/10.1016/j.compedu.2012.12.010. iJET ‒ Volume 10, Issue 7: "ALICE 2014", 2015. [10]. [11] [12]. [13] [14] [15]. [16] [17] [18] [19] [20] [21] [22] [23] [24] [25] [26] [27] [28] [29] [30] [31] [32] [33] [34] [35]. [36]. E. Sung and R.E. Mayer, “Affective impact of navigational and signaling aids to e-learning”. Computers in human behavior, 2012, 28(2), pp. 473-483. http://dx.doi.org/10.1016/j.chb.2011.10.019 R. Mayer, The Cambridge Handbook of Multimedia Learning. New York: Cambridge University Press, 2014. R. Clark and R. E. Mayer, E-learning and the science of instruction (3rd ed). San Francisco: Pfeiffer, 2011. http://dx.doi.org/10.1002/9781118255971 G. Woodill, “The ideal learning management system for multimedia learning”, Knoodle white paper, 2011. A.M. Shapiro, “The site map principle in multimedia learning” in Cambridge Handbook of Multimedia Learning. Second Edicion. Cambridge: Cambridge University Press, 2005, pp 313-323. K.R. Butcher, “Learning with Diagrams: Effects on Inferences and the Integration of Information” in: Diagrammatic Representation and Inference. Heidelberg: Springer Berlin, 2004, pp. 337-340. http://dx.doi.org/10.1007/978-3-540-25931-2_33 K.R. Butcher, “Learning from text with diagrams: Promoting mental model development and inference generation”. Journal of Educational Psychology, 2006, 98(1), pp. 182-197. http://dx.doi.org/10.1037/0022-0663.98.1.182 C. Bonwell and J. Eison, Active Learning: Creating Excitement in the Classroom AEHE-ERIC Higher Education Report No. 1. Washington, D.C.: Jossey-Bass, 1991. R.C. Schank, T.R. Berman and K.A. Macpherson, “Learning by doing” in C. M. Reigeluth (Ed.), Instructional-design theories and models Vol. II. Mahwah, NJ: Lawrence Erlbaum Associates, Inc., 1999, pp 161–181. http://dx.doi.org/10.1017/cbo9780511527920.011 R. Mayer, “Should there be a three-strikes rule against pure discovery learning? The case for guided methods of instruction”. American Psychologist, 2044, 59(1), pp.14–19. C. Aldrich, Learning by doing. A comprehensive guide to simulations, computer games, and pedagogy in e-learning and other education experiences. San Francisco: Pfeiffer, 2005. R. Azevedo and M.J. Jacobson, “Advances in scaffolding learning with hypertext and hypermedia: a summary and critical analysis”. Education Tech Research, 2008, 56, pp. 93-100. http://dx.doi.org/10.1007/s11423-007-9064-3 A. M. Shapiro, “Hypermedia design as learner scaffolding”. Education Tech Research, 2008, 56, pp. 29-44. http://dx.doi.org/10.1007/s11423-007-9063-4 UOC. Available at: http://cv.uoc.edu/aulaca/estudiant.html#&panel1-1 FutureLearn. Available at: https://www.futurelearn.com/ edX. Available at: https://www.edx.org/ Blackboard. Available at: http://www.blackboard.com Moodle. Available at: https://moodle.org/?lang=es Sakai. Available at: http://www.sakaiproject.org/ Claroline. Available at: www.claroline.net/?lang=en Udacity. Available at: https://www.udacity.com Wemooc. Available at: http://www.wemooc.com/web/guest/home Udemy. Available at: https://www.udemy.com/ Coursera. Available at: https://www.coursera.org/ Collaborize Classroom. Available at: http://www.collaborizeclassroom.com/ Desire2Learn. Available at: http://www.desire2learn.com Exploros. Available at: http://www.exploros.com/wp/ Agilix. Available at: http://agilix.com/products/brainhoney/ Epsilen. Available at: http://corp.epsilen.com/ Follett. Available at: http://www.follettsoftware.com/schooladministration-software Canvas. Available at: http://www.instructure.com/ Pearson Learningstudio. Available at: http://www.pearsonlearningsolutions.com/pearson-learningstudio/ D.S. McNamara and A.M. Shapiro, “Strategies for helping learners creates coherence from text and hypertext”. Journal of Education Computing Research, 2005, 33(1), pp.1-29. http://dx.doi.org/10.2190/7N6R-PCJL-UMHK-RYPJ. 37.
(8) SPECIAL FOCUS PAPER EFFECTS OF APPLYING THE SITE MAP PRINCIPLE IN AN ONLINE LEARNING ENVIRONMENT IN HIGHER EDUCATION [37] R. Spence, Information Visualization. Pearson Education Higher Education Publishers, 2000. [38] E. Sung and R. E. Mayer, “Affective impact of navigational and signaling aids to e-learning”. Computers in human behavior, 2012, 28(2), pp.473-483. http://dx.doi.org/10.1016/j.chb.2011.10.019 [39] Netquest. Available at: http://sm.netquest.es [40] R. Likert, A technique for the measurement of attitudes. Archives of Psychology. New York: Columbia University Press, 1931.. AUTHORS L. Porta is lecturer at the School of Computing, Multimedia and Telecommunications Department at the Open University of Catalonia. Her research interest is ICT for teaching and e-learning, specifically the multimedia learning. (e-mail: [email protected]). R. Beneito-Montagut is senior lecturer at the School of Computing, Multimedia and Telecommunications at the Open University of Catalonia. Her research interests include mixed research methods in digital social sciences; digital social sciences. She is also interested in ICT for teaching and learning (e-mail: [email protected]). 38. J. Melenchón, holds a Ph.D in Information and Communication Technologies, a M.Sc in Multimedia Engineering and Computer Science and a B.Sc in Multimedia Engineering and Computer Science by Universitat Ramon Llull. He is a senior lecturer in Universitat Oberta de Catalunya, where he is the programme director of the M.Sc in Multimedia Applications. His research interests are multimedia technologies, including instructional design of signal processing content, computer vision algorithms, speech processing and user experience (e-mail: [email protected]). A. Marín-Amatller, is lecturer at the School of Computing, Multimedia and Telecommunications at the Open University of Catalonia. His research interests include the use of hypervideo as cognitive tool in e-learning environments and the application of transmedia storytelling in instructional design. (e-mail: [email protected]) This article is an extended and modified version of a paper presented at the International Workshop on Adaptive Learning via Interactive, Collaborative and Emotional approaches (ALICE 2014), held on September 10-12, 2014, Salerno, Italy. Submitted 08 April 2015. Published as resubmitted by the authors 05 May 2015.. http://www.i-jet.org.
(9)
Figure
+2
Documento similar
