New directions in European Regional Policy and their Implications for Spain
31
0
0
Texto completo
(2) 07b Salmon. 30/5/08. 148. 09:04. Página 148. Salmon, K.. tentan la Política de Cohesión y su distribución en España. En la sección cuatro la discusión gira en torno a la consideración de los conceptos de convergencia y de la naturaleza de regiones. Finalmente, las conclusiones sugieren que existen implicaciones significativas en los ámbitos administrativos, financieros y en el planeamiento estratégico del nuevo marco financiero y de la renovada Política de Cohesión: para el desarrollo económico en general y para el desarrollo regional en particular en los próximos años. Clasificación JEL: R10, R51, R58. Palabras clave: Política de Cohesión, convergencia, marco financiero europeo, regiones, España.. 1.. Introduction. A reorganised European Cohesion policy came into effect at the beginning of 2007 alongside a new European financial framework for the period 2007-2013. In addition, over the last few years, the Common Agriculture Policy (CAP) has undergone significant reform. The context of these policy shifts has been profound changes in the policy environment at the global, European, national and regional scales. These include: at the global scale the dramatic rise in the economic power of emerging economies, concern for civil security, the environment and energy supplies, pressures from labour migration along with the continuous march of technology; within the European Union (EU) the enlargement from 15 states at the beginning of 2004 to 27 states in 2007 and the on-going process of market integration; and in Spain a turn in the economic cycle and collapse of the unbalanced growth model centred on consumer demand and property investment, the further decentralisation of administrative power and reforms to the system of regional finance. This paper focuses on the new architecture of Cohesion Policy, some of the implications of this new architecture for Spain and two of the theoretical issues underlying cohesion policy. The discussion is divided into five sections. Following this introduction section two examines the structure of the new European Financial Framework, highlighting the impact this has on the balance of financial transfers between Europe and Spain. In section three the discussion moves on to an explanation of the new architecture of Cohesion Policy, pointing out the relationships with related agriculture and fisheries policies and ending with an assessment of the principal features of the new Cohesion policy architecture. Section four examines the financial resources behind the policy and their distribution in Spain. In section five the discussion shifts to a consideration of two key concepts at the heart of regional policy, convergence and the nature of regions. Finally the conclusion suggests some of the implications of the new financial framework and new Cohesion policy for Spain; for economic development in general and for regional development in particular over the coming years..
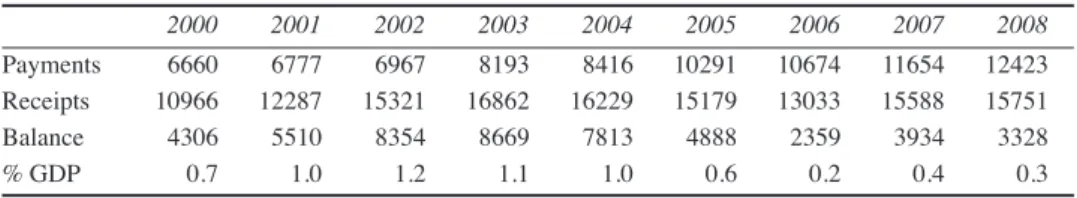
(3) 07b Salmon. 30/5/08. 09:04. Página 149. New directions in European Regional Policy and ther implications for Spain. 2.. 149. The EU Budget and the Financial Framework 2007-13. Spain has enjoyed substantial net inflows of financial resources from the European Union since its accession in 1986. These net payments peaked at the beginning of the century when total net transfers from the EU were worth some 1.2 per cent of Gross Domestic Product (GDP) (Table 1). Under the new EU financial framework 2007-13 Spain will no longer be a major net beneficiary of transfers from Europe. Increasing payments into the EU budget and declining receipts under cohesion funding point to net inflows falling away to close to zero by 2013. Already in 2008 the balance of transfers with Europe was estimated at only some 3330 million or less than 0.3 per cent of GDP and some 62 per cent less than in 2003 (MEH 2007a, 306). For Spain, the current funding period is one of transition from large net inflows to balance. In the next funding period Spain may well find itself a net contributor to the EU budget. In terms of inflows, Spain has been the leading beneficiary of the Structural Funds, the principal beneficiary of Cohesion Fund payments and the second largest recipient of funding under the CAP after France. The government put the total Structural and Cohesion Fund payments from 1986 to 2006 at €136000 million (at 2004 prices), equivalent to 0.7 per cent of GDP 1989 to 1993, 1.5 per cent 1994-99 and 1.3 per cent 2000-06 (MEH 2007b, 52). It estimates that this has added between 1.5 and 3.3 per cent to GDP over the period, between 1.1 and 2.4 per cent to employment and contributed to convergence with the EU (ibid.). The expenditure budget of the European Union is broken down into activity headings. For the period 2007-13 some 43 per cent is allocated to the heading ‘Sustainable Growth’, which is implemented primarily through the Cohesion policy. A further 45 per cent is allocated to the ‘Preservation and Management of Natural Resources’, which is implemented through the CAP, the Common Fishing Policy and the Rural Development Policy. Overall, the financial framework continues to allocate the largest proportion of funding to agricultural support, but sustainable growth is now almost as large. Within Cohesion policy more emphasis has been placed on sustainable development and competitiveness as a means of implementing the Lisbon and Goteborg strategies to create a competitive, knowledge based economy and ensure sustainable development. Critically, at the Berlin Summit in 2005, the budget of the EU was fixed at little more than one per cent of the Union’s GDP. Enlargement of the EU was to embrace twelve new member states, which were dominantly ones with low per capita incomes Table 1. Payments Receipts Balance % GDP. Balance of Transfers between the European Union and Spain. 2000. 2001. 2002. 2003. 2004. 2005. 2006. 2007. 2008. 6660 10966 4306 0.7. 6777 12287 5510 1.0. 6967 15321 8354 1.2. 8193 16862 8669 1.1. 8416 16229 7813 1.0. 10291 15179 4888 0.6. 10674 13033 2359 0.2. 11654 15588 3934 0.4. 12423 15751 3328 0.3. Figures in million euro at current prices. Source: 2000-05 MEH 2007c p.69 and 106, 2006-8 from MEH 2007a p.306 and author estimates..
(4) 07b Salmon. 30/5/08. 150. 09:04. Página 150. Salmon, K.. and large agricultural sectors. In this context, it was clear that Spain was approaching the end of its privileged position in terms of European funding.. 3.. Cohesion Policy 2007-13. In parallel with the introduction of the new financial framework, a redesigned Cohesion policy was launched1. The traditional purpose of the policy, to promote convergence between regions, is defined in the General Regulation governing the policy (Regulation 1083/2006, paragraph 1): “in order to strengthen its economic and social cohesion, the Community is to aim at reducing disparities between the levels of development of the various regions and the backwardness of the least favoured regions or islands, including rural areas.” But, the purpose of policy is now broadened in that: “Cohesion policy should contribute to increasing growth, competitiveness and employment by incorporating the Community’s priorities for sustainable development as defined at the Lisbon European Council of 23 and 24 March 2000 and at the Göteborg European Council of 15 and 16 June 2001.” (ibid., paragraph 2). Moreover, the ambition of the policy is underlined in the forward to the European Commission’s Guide to Cohesion policy where it states that: “the European Cohesion Policy will be the major instrument at Community level for the modernisation of the Union’s economy in the years to come.” (European Commission 2007a, p. 3). Thus, the focus of cohesion policy has been blurred to meet multiple objectives and multiple interests. To deliver Cohesion policy it was re-organised around three ‘priority objectives’: Convergence, Regional competitiveness and employment’, and European territorial cooperation (Figure 1). These objectives are supported by three funds: two Structural funds —the European Regional Development Fund (ERDF) and the European Social Fund (ESF)— plus the Cohesion Fund (CF). The European Agriculture Fund for Rural Development (EAFRD) and the European Fisheries Fund (EFF) are both outside Cohesion Policy but are to be coordinated with it. Equally, the European Neighbourhood and Partnership Instrument (ENPI) and the Instrument for Pre-Accession Assistance (IPA, for countries seeking accession to the EU), are not part of the Structural Funds. The Convergence objective is the priority of Cohesion policy, attracting 81.5 per cent of policy funding. It is targeted at the poorest member states and regions. All other regions not covered by the Convergence objective are allocated 16 per cent of cohesion funding to support innovation, sustainable development, better accessibility and training projects under the Competitiveness and employment objective. The remaining 2.5 per cent of funding is available for cross-border, trans-national and interregional cooperation under the European territorial cooperation objective. Certain spending targets have also been agreed on to pursue the aims of the ‘growth and jobs agenda’ (otherwise referred to as the Lisbon agenda): thus the Commission and the member states “shall ensure that 60 % of expenditure for the Convergence objective and 75 % of expenditure for the Regional competitiveness and employment objective for all the Member States of the European Union as constituted before 1 May 2004 is 1 For a discussion of the last twenty years of regional policy see Garrido Yserte, Mancha Navarro and Cuadrado Roura, 2007..
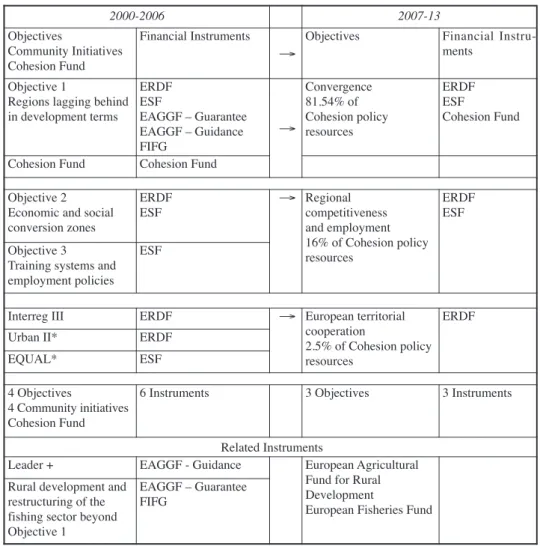
(5) 07b Salmon. 30/5/08. 09:04. Página 151. New directions in European Regional Policy and ther implications for Spain. 151. Figure 1. Cohesion Policy Architecture 2000-2006 Objectives Community Initiatives Cohesion Fund. 2007-13. Financial Instruments. Objectives →. Financial Instruments. Objective 1 ERDF Regions lagging behind ESF in development terms EAGGF – Guarantee EAGGF – Guidance FIFG Cohesion Fund Cohesion Fund. Convergence 81.54% of Cohesion policy → resources. ERDF ESF Cohesion Fund. Objective 2 Economic and social conversion zones. ERDF ESF. ERDF ESF. Objective 3 Training systems and employment policies. ESF. → Regional competitiveness and employment 16% of Cohesion policy resources. Interreg III. ERDF. Urban II*. ERDF. EQUAL*. ESF. 4 Objectives 6 Instruments 4 Community initiatives Cohesion Fund Leader + Rural development and restructuring of the fishing sector beyond Objective 1. ERDF → European territorial cooperation 2.5% of Cohesion policy resources 3 Objectives. 3 Instruments. Related Instruments EAGGF - Guidance European Agricultural Fund for Rural EAGGF – Guarantee Development FIFG European Fisheries Fund. • The three new objectives incorporate the missions of the previous Objectives 1, 2, and 3 as well as the previous Community initiatives: Interreg III, Equal and Urban II. Source: Adapted from European Commission 2007a, p. 10.. set for the above mentioned priorities [growth and jobs].” These targets are to apply as an average over the entire programming period (Regulation 1083/2006, Article 9, 3). The purpose of the Convergence objective is defined in Article 3 of the General Regulation (Regulation 1083/2006, Article 3, 2a) as: “aimed at speeding up the convergence of the least-developed Member States and regions by improving conditions for growth and employment through the increasing and improvement of the quality of investment in physical and human capital, the development of innovation and of the knowledge society, adaptability to economic and social changes, the protection and improvement of the environment, and administrative efficiency.”.
(6) 07b Salmon. 30/5/08. 152. 09:04. Página 152. Salmon, K.. To support the Convergence objective it is allocated a total of €282855 million (at 2006 prices) over the period 2007-13. For Spain, the indicative allocation is €26180 million or 74 per cent of its total Cohesion policy funding. The objective is funded through the Cohesion Fund, the European Regional Development Fund and the European Social Fund (Figure 1). Areas eligible for the Convergence objective combine the NUTS level 2 regions (all of the Spanish comunidades autónomas plus the ciudades autónomas of Ceuta and Melilla) eligible on a regional criteria basis (GDP less than 75 per cent of the EU-25 average measured in purchasing power parities for the three year period 2000-02 inclusive, and member states which are eligible for the Cohesion Fund on a national criteria basis (GNI less than 90% of the European average measured over the period 2001-03) (Regulation 1083/2006, Articles 3 to 5 and Article 8). The regions eligible in Spain are: Andalucía, Castilla-La Mancha, Extremadura and Galicia (Table 2). In addition, regions that would have qualified under the convergence criteria (with GNI per capita below 75%) but for the statistical impact of European Union enlargement are eligible for transitional support as ‘phasing-out’ regions. In Spain these are Asturias and Murcia, plus the city regions of Ceuta and Melilla (Table 2). Spain is also eligible for Cohesion Fund transitional support, based on the statistical effect of enlargement. In total, the European Commission estimate that 16.3 million people in Spain will be living in Convergence regions (37% of the total compared with 59% in Objective 1 regions 2000-06; European Commission 2008). A comparison with the eligibility arrangements for the period 200106 is shown in Figure 2. The Regional competitiveness and employment objective covers all the areas of the European Union not eligible for the Convergence objective or for the transitional support of the regional competitiveness and employment ‘phasing-in’ objective (re-. Table 2. Classification of Regions in Spain under the Cohesion Policy 2007-13 Cohesion Classification. Region. Convergence Regions. Andalucía, Castilla-La Mancha, Extremadura, Galicia. Phasing-out Regions. Asturias, Murcia, Ceuta, Melilla. Competitiveness& Employment Regions. Aragón, Baleares, Cantabria, Cataluña, Madrid, Navarra, País Vasco, La Rioja. Phasing-in Regions. Canarias, Castilla y León, Comunidad Valenciana. In the funding period 2000-06 Objective 1 regions were: Andalucía, Asturias, Canarias, Castilla y León, Castilla-La Mancha, Extremadura, Galicia, Murcia, Comunidad Valenciana, Ceuta and Melilla. Cantabria had transition status from Objective 1; in addition 120 comarcas in Aragón, Baleares, Cataluña, Madrid, Navarra, País Vasco and La Rioja were classified as Objective 2..
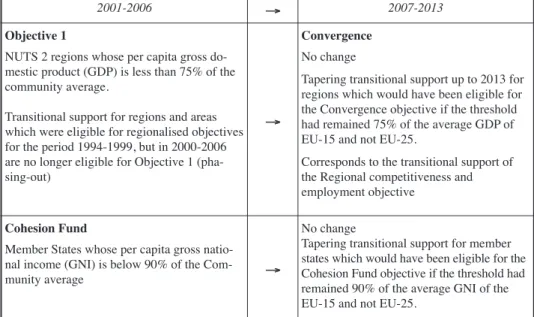
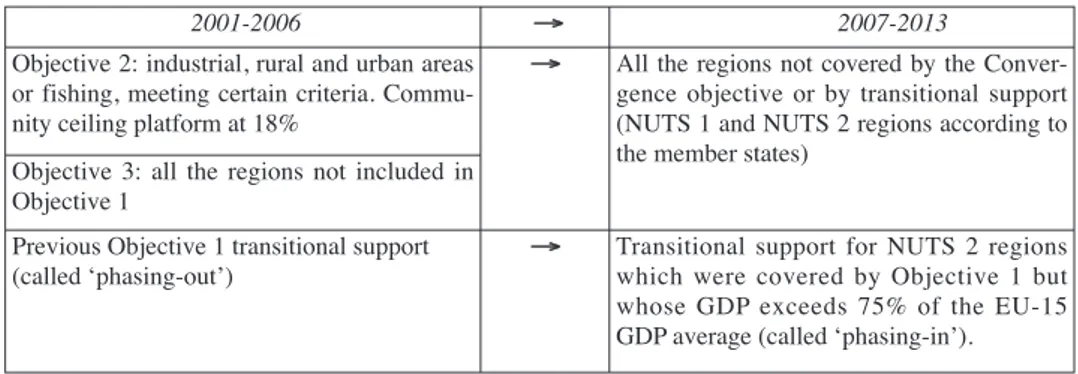
(7) 07b Salmon. 30/5/08. 09:04. Página 153. New directions in European Regional Policy and ther implications for Spain. 153. Figure 2. Eligibility for the Convergence Objective 2000-06 and 2007-13 2001-2006. →. 2007-2013. Objective 1. Convergence. NUTS 2 regions whose per capita gross domestic product (GDP) is less than 75% of the community average.. No change. Transitional support for regions and areas which were eligible for regionalised objectives for the period 1994-1999, but in 2000-2006 are no longer eligible for Objective 1 (phasing-out). →. Corresponds to the transitional support of the Regional competitiveness and employment objective. Cohesion Fund Member States whose per capita gross national income (GNI) is below 90% of the Community average. Tapering transitional support up to 2013 for regions which would have been eligible for the Convergence objective if the threshold had remained 75% of the average GDP of EU-15 and not EU-25.. →. No change Tapering transitional support for member states which would have been eligible for the Cohesion Fund objective if the threshold had remained 90% of the average GNI of the EU-15 and not EU-25.. Source: Adapted from European Commission 2007a, p.13.. gions that are phasing-in to the competitiveness and employment objective as their GNI per capita exceeded the 75% threshold for Convergence regions based on the average per capita income of the EU-15) (Table 2). A comparison with the eligibility arrangements for the period 2001-06 is shown in Figure 3. One important revision from the designation arrangements under Objective 2 in the previous funding period is that there is no longer any Community zoning for this objective. The European Commission (2007a p.18) states: “From now on the elaboration of a coherent strategy, applicable to the whole of a region is privileged, instead of micro-zoning at borough or village level, for example.” As the title of this objective suggests, its purpose is to promote competitiveness and employment. Article 3 of Council Regulation (EC) 1083/2006 states this more fully, in that it is: “aimed at strengthening regions’ competitiveness and attractiveness as well as employment by anticipating economic and social changes, including those linked to the opening of trade, through the increasing and improvement of the quality of investment in human capital, innovation and the promotion of the knowledge society, entrepreneurship, the protection and improvement of the environment, and the improvement of accessibility, adaptability of workers and businesses as well as the development of inclusive job markets;”. Finally, the European territorial cooperation objective aims to reinforce co-operation between local and regional authorities at cross-border, trans-national and interregional level in the domain of urban, rural and coastal development (integrated terri-.
(8) 07b Salmon. 30/5/08. 154. 09:04. Página 154. Salmon, K.. Figure 3. Eligibility for the Regional Competitiveness and Employment Objective 2001-2006. →. Objective 2: industrial, rural and urban areas or fishing, meeting certain criteria. Community ceiling platform at 18%. →. All the regions not covered by the Convergence objective or by transitional support (NUTS 1 and NUTS 2 regions according to the member states). →. Transitional support for NUTS 2 regions which were covered by Objective 1 but whose GDP exceeds 75% of the EU-15 GDP average (called ‘phasing-in’).. Objective 3: all the regions not included in Objective 1 Previous Objective 1 transitional support (called ‘phasing-out’). 2007-2013. Source: Adapted from European Commission 2007a, p.18.. torial planning), the development of economic relations and the setting up of small and medium-sized enterprises (SMEs). Cooperation is centred on research, development, the knowledge-based society, risk prevention and integrated water management (Regulation 1083/2006, Article 3). The objective is designed to act as a complement to the two other objectives, as the regions eligible for this are also eligible for the Convergence and Regional competitiveness and employment objectives. The European Commission argues that compared with the previous planning period (200006): “The status of territorial cooperation has changed and it is now raised to the level of an entirely separate objective, which gives it greater visibility and greater legal basis.” (European Commission 2007a, p.20). For cross-border co-operation: NUTS level 3 regions are eligible, along all the land-based internal borders and some external borders, and along maritime borders separated by a maximum distance of 150 km. For Spain, internal border areas are those lying along the French and Portuguese borders as well as the province of Cádiz – in relation to the external border with Morocco. In addition, the Commission has identified 13 cooperation zones; for Spain these are shown in Table 3. Finally, all the European regions are eligible for inter-regional co-operation and the setting up of networks and exchanges of experience (this is covered by three different programmes presented by the 27 member states: i) ‘Interact’ supports co-operation programme Table 3. Cooperation Zone. Cooperation Zones in which Spain Participates Regions Included. Atlantic. Asturias, Cantabria, Galicia, Navarra and País Vasco plus the NUTS 3 areas in Andalucía of Cádiz, Huelva and Sevilla. Azores-Canarias-Madeira South-West Europe Western Mediterranean. Canarias All of Spain except Canarias Andalucía, Aragón, Baleares, Cataluña, Murcia, Valencia, Ceuta and Melilla. Source: MEH 2007b, 150..
(9) 07b Salmon. 30/5/08. 09:04. Página 155. New directions in European Regional Policy and ther implications for Spain. 155. management organisations; ii) ‘Urbact’ is a thematic city network; and iii) ‘Epson’ is a zoning commission observatory). Co-operation with countries outside the European Union is no longer aided by the Structural Funds but by two new supports: the European Neighbourhood and Partnership Instrument (ENPI) and the Instrument for PreAccession Assistance (IPA). 3.1.. Cohesion Policy Funds. Cohesion policy is now funded through three funds, the two Structural Funds and the Cohesion Fund, in coordination with any additional funding through the European Investment Bank (EIB) and other existing funding instruments. The Structural Funds and the Cohesion Fund are now covered by the same general regulation (Regulation 1083/2006) in addition to their own specific regulations. The purpose of the ERDF is set out in Regulation EC 1080/2006 (Article 2): “the ERDF shall contribute to the financing of assistance which aims to reinforce economic and social cohesion by redressing the main regional imbalances through support for the development and structural adjustment of regional economies, including the conversion of declining industrial regions and regions lagging behind, and support for cross-border, transnational and interregional cooperation. In so doing, the ERDF shall give effect to the priorities of the Community, and in particular the need to strengthen competitiveness and innovation, create and safeguard sustainable jobs, and ensure sustainable development.” The ERDF contributes towards the financing of: i) productive investment which contributes to creating and safeguarding sustainable jobs, ii) investment in infrastructure, iii) the development of endogenous potential by measures which support regional and local development and iv) technical assistance (ibid., Article 3, 2). In contrast, the purpose of the European Social Fund is to strengthen economic and social cohesion “by improving employment and job opportunities, encouraging a high level of employment and more and better jobs. It shall do so by supporting Member States’ policies aiming to achieve full employment and quality and productivity at work, promote social inclusion, including the access of disadvantaged people to employment, and reduce national, regional and local employment disparities.” (Regulation 1081/2006, Article 2). The Cohesion Fund is restricted to those member states with per capita incomes (GNI) below 90 per cent of the European average, plus Spain which operates under transition arrangements. It no longer functions independently but participates in the Convergence objective. The Fund is subject to the same programming, management and control rules as the Structural Funds. However, unlike the Structural Funds eligibility to the Cohesion Fund still requires member states to meet certain macroeconomic conditions, notably a stability policy if they are members of the euro or to follow principles of sound economic management if they are not. The Fund continues to promote trans-European transport networks and the protection of the environment but its priorities have been widened to those: “which clearly present environmental benefits, namely energy efficiency and renewable energy and, in the transport sector outside the trans-European networks, rail, river and sea transport, inter-modal transport.
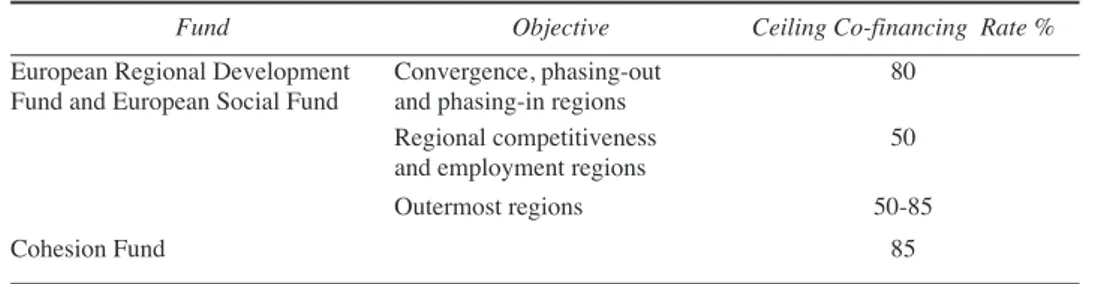
(10) 07b Salmon. 30/5/08. 156. 09:04. Página 156. Salmon, K.. systems and their interoperability, management of road, sea and air traffic, clean urban transport and public transport (Regulation 1084/2006, Article 2, 1). The level of co-financing available from the Cohesion policy funds depends on the nature and geographical location of the projects and the fund from which project finance is drawn. The maximum rates are shown in Table 4. A new rule relating to the complementarity of funds specifies that each operational programme must be funded from a single fund (Regulation 1083/2006, Article 34). Hence there are ERDF operational programmes and ESF operational programmes. However, the ERDF and the ESF can each finance in complementary and limited ways activities related to the scope of assistance of the other fund (within 10% of the credit facilities allocated by the Community to each operational programme’s key priorities). In addition: “in the Member States receiving support from the Cohesion Fund, the ERDF and the Cohesion Fund shall jointly provide assistance for operational programmes on transport infrastructure and the environment, including for major projects.” (ibid. Article 34, 3). Table 4. Fund European Regional Development Fund and European Social Fund. Co-financing Rates for Spain 2007-13 Objective Convergence, phasing-out and phasing-in regions Regional competitiveness and employment regions Outermost regions. Cohesion Fund. Ceiling Co-financing Rate % 80 50 50-85 85. For expenditure to be eligible it must be incurred between 1st January 2007 and 31st December 2015 Source: Regulation 1083/2006, Annex 3.. 3.2.. The Common Agricultural Policy and Rural Development. Before moving on to an assessment of Cohesion policy it is worth making a brief diversion to consider the related policy areas of agriculture, especially rural development, and fisheries. Recent reforms to the Common Agricultural Policy (CAP) have important implications not just for agriculture but also for Cohesion policy. CAP reforms have introduced fundamental changes to the regulatory regime for agriculture in the European Union. The principal measure has been to further shift aid from production subsidies to direct income support through the Single Farm Payment. As a package, the reforms represent one more step in a process that is gradually unwinding protectionism and redirecting aid from direct support for agriculture towards rural development, food quality and environmental measures (Greer, 2005; Rickard, 2004). The Common Agricultural Policy has two so-called ‘pillars’, market support (pillar one) and rural development (pillar two). Until October 2006 policy was funded through the European Agricultural Guidance and Guarantee Fund (EAGGF). The Guarantee section provided: i) market support —supporting farmers incomes and farm prices, and ii) rural development measures— supporting the economic and so-.
(11) 07b Salmon. 30/5/08. 09:04. Página 157. New directions in European Regional Policy and ther implications for Spain. 157. cial conversion of areas facing structural difficulties outside of Objective 1 regions (those with GDP per capita less than 75% of the EU average). The Guidance section (EAGGF-G) provided other rural development expenditure not financed by the Guarantee section. It was integrated with the Structural Funds in 2000 and all rural development under this heading was thenceforth funded through the co-financing of projects by the EU and the recipients of funding. As part of the Structural Funds, the level of co-financing depended on the region in which the project was located. From October 2006 the CAP is funded through: i) The European Agricultural Guarantee Fund (EAGF), which provides funding for direct payments to farmers, intervention, export refunds, information and promotion measures and administration; and ii) The European Agricultural Fund for Rural Development (EAFRD), which provides support for all rural development programmes based on the principal of cofinancing. Member states may transfer additional sums from within their ceiling on agricultural spending to rural development programmes up to a maximum of 20 per cent of the amounts allocated to them for market related expenditure and direct payments. Funding for agriculture is focused on a small number of sectors and thus on the regions where these sectors are concentrated. As a result, the impact of CAP reform will vary between regions. The largest slice (about one quarter) of EAGGF-Guarantee funding in Spain has gone on supporting arable crops (FEGA, 2006a), another thirty per cent on supporting the olive market and beef. Adding fruit and vegetables, the wine sector and ‘sheep and goats’ takes the proportion accounted for by these six sectors to over three-quarters of all funding. EAGGF-Guarantee payments are, therefore, unevenly distributed between regions, with the regions of the Meseta and Andalucía (the big cereal growing regions and centres of olive production) receiving close to three-quarters of the total (FEGA, 2006b). In contrast, the small farms of the north and north-west (in Asturias, Cantabria, Galicia and País Vasco) received less than six per cent. A number of observations can be made relating to the regional development impact of CAP reform. Firstly, aid is now tied more closely than ever to support for land owners rather than tenant farmers. Secondly, the CAP has become less about supporting agricultural production and more about rural development, the environment and food quality (Rickard, 2004). Thirdly, with a review of the CAP scheduled for 2008 regulatory risk and uncertainty remain, negating one of the objectives of the CAP, that of creating a secure and stable agricultural environment. Finally, CAP reform along with other business and environmental pressures will require farmers to continue to adapt their farm enterprises. Areas under tobacco and marginal areas under sugar beet have been among the first to respond with reductions in the area cultivated. Cotton is another sector likely to decline. In general, the economics of farming will be complicated by the multi-functionality of land resources (for food, recreation, fuel etc; see Barreiro and Gómez Limón, 2007, and García Alvarez-Coque, 2007) and greater exposure to competition from outside the EU. Beyond this, recent high agricultural commodity prices may have marked a shift to an era of permanently higher agricultural product prices translating into higher rural incomes for crop producers (but higher costs for livestock producers) and far.
(12) 07b Salmon. 30/5/08. 158. 09:04. Página 158. Salmon, K.. greater scope to shift agricultural funding towards other food, environment and rural development objectives. Rural development can be financed through Cohesion policy or through EAFRD (Regulation 1698/2005). Equally, there is funding for fisheries developments through the European Fisheries Fund. The EAFRD and EFF are defined as agricultural and fisheries funds managed by the CAP and fisheries policy and not as Structural Funds. The Agenda 2000 strategy reinforced rural development measures with overall EU funding 2000-06 of over €50000 million, €33000 million from the EAGGF-Guarantee section and €18000 million from the Guidance section. The new fund provides for additional funding through transfers (modulation) from direct aid to rural development. Total EU funding of around €77000 million at current prices, €11000 million per year, was agreed in September 2006 for the period 2007-13 (Regulation 1698, European Commission 2006). The largest slice of funding goes to Poland (17 per cent), followed by Germany and Italy with over 10 per cent each, then Spain, which is allocated nine per cent (€7200 million 2007-13 or 1000 million a year; European Commission 2006). Funding under the EAFRD is coordinated with Cohesion policy in that it will concentrate on the regions eligible under the Convergence objective (37 per cent of total funding). The rate of the EAFRD contribution to rural development depends on the type of programme being supported and the situation in the region. In addition, favourable treatment is given to the ‘outermost regions’ of the EU and the smaller Aegean islands (Regulation 1698/2005). To access the funds each member states has prepared a National Rural Development Plan (2007-13) as the framework for multi-annual rural development programmes. As with the other national planning documents, national strategies follow strategic guidelines set by the Commission, which the Commission argues: i) help to identify the areas where support creates most value-added, ii) make the link with the Lisbon and Goteborg strategies (for improving competitiveness and environmental sustainability respectively), and iii) ensure consistency with other EU policies, particularly agricultural market policy, cohesion policy, environmental policy and fisheries policy. EAFRD is targeted primarily at farmer beneficiaries, including aid for improving food quality, environmental protection and animal welfare. Measures are designed to focus on three thematic axes: Axis 1: Improving the competitiveness of farming and forestry through improving human ad physical capital, boosting jobs and growth in line with the Lisbon strategy. This axis includes training, support for young farmers, early retirement, the provision of advisory services, farm modernisation, improving agriculture related infrastructure, improving the quality of products and transitional measures for the new member states. Axis 2: Environment and the countryside. This includes measures targeting the sustainable use of agricultural land (in line with the Goteborg strategy) through: payments to farmers in areas with handicaps, including mountainous areas; payments towards the conservation of natural habitats under NATURA 2000; agri-environment and animal welfare payments; support for non-productive investment and measures targeting the sustainable use of forestry land..
(13) 07b Salmon. 30/5/08. 09:04. Página 159. New directions in European Regional Policy and ther implications for Spain. 159. Axis 3: Improving the quality of life in rural areas and diversification of the rural economy. This is likely to be achieved primarily through the LEADER approach (LEADER was a structural fund programme). Each rural development programme must have a LEADER element for the implementation of bottom-up local development by local action groups. This element is allocated a share of national programme funding (a minimum of 5% of the Community contribution or 2.5% for new member states; Regulation 1698/2005, and European Community 2006). 3.3.. Assessment of Cohesion Policy. The new architecture of Cohesion policy introduces a number of modifications to the previous policy in relation to: i) overall strategy, ii) policy management, iii) principles of intervention and iv) funding arrangements. At a strategic level there is firstly a new planning framework. The European Commission argues that the new architecture of policy places greater emphasis on a strategic vision in pursuit of a common set of Community priorities summed up in the growth and jobs agenda launched by the EU in 2005 (the re-launch of the Lisbon agenda). That strategic vision is set out in the Community Strategic Guidelines (CSG) and the National Reform Programmes (NRP), which transform Community priorities into national ones. These guidelines are then translated into the National Strategic Reference Frameworks (NSRF), which form the strategic bases for the implementation of operational programmes. Secondly, there has also been a strategic shift in policy. Funding priorities have been rebalanced towards supporting the Lisbon strategy, in particular as regards research, innovation and the information society (the total allocation for these has doubled compared with the 2000-06; National Strategic Reference Frameworks, 2008) and the development of human capital (see section 4). The third strand of strategy relates to the thematic and geographical concentration of funding. The Commission argues that under the new architecture financial aid is less dispersed (European Commission, 2007a). Thematically they argue that it is concentrated on the EU strategy geared towards growth and employment. However, this embraces a very broad range of spending categories (including technological development, innovation and the spirit of enterprise, a knowledge-based society, transport, energy, the protection of the environment as well as investment in human capital, employment market policy and improving worker and business adaptability —and continued strong support for infrastructure development especially in the convergence objective regions) making it difficult to view this as thematic concentration. In addition, geographically the whole of the EU is now eligible for Cohesion policy support (although funding is concentrated on the Convergence objective regions). In terms of management there has been a decentralisation of responsibilities away from the European Commission to the member states and regions, in what might be described as a partial re-nationalisation of policy. The European Commission now adopts more of an overall strategic guidance role, setting the broad strategy and prio-.
(14) 07b Salmon. 30/5/08. 160. 09:04. Página 160. Salmon, K.. rities for Cohesion policy through the CSG, approving the NRPs and NSRFs and then ensuring the implementation of this strategy over the programming period. It is principally the member states and regions that have the responsibility for key decisions in matters such as project selection and management. Thus lower tiers of decision making have more room for manoeuvre in implementing operational programmes. Expenditure eligibility rules are now national rather than Community based. But, according to the European Commission: “the big change concerns monitoring and control rules. If the State provides proof from the start that its control system is trustworthy, its obligations are lessened vis-à-vis the Commission, which leaves the matter up to an insurance declaration drawn up by a national control organisation.” (European Commission, 2007a, p. 9). By early 2008 ‘contracts of confidence’ had already been signed with Austria, Denmark and Portugal and it was likely that such arrangement would cover virtually all member states. The key principles on which Cohesion policy intervention is based are retained, but they are supplemented by some new ones. Thus, within the framework of the three objectives, the principles of additionality (the Structural Funds must not substitute a State’s spending on infrastructure), multi-annual programming, partnership, shared management, coherence and co-ordination continue to apply. Added to these are the principles of: proportionality (the degree of flexibility given to lower tiers of project management according to the size of the project), equality between men and women and non-discrimination, sustainable development, and using the funds to focus on the Lisbon strategy priorities (European Commission, 2007a, p. 29). In relation to funding: i) The number of financial instruments has been reduced from six to three; ii) The Cohesion Fund no longer functions independently but participates in the Convergence objective, the same programming and management rules applying to the three cohesion funds; iii) In principle each operational programme is supported by only one fund (Regulation 1083/2006 Article 34, 1). Nevertheless provision is made for a flexibility rule: as part of an operation, the ERDF or the ESF may finance, up to a 10 per cent limit (or 15% in the context of an integrated urban development; ibid Article 34, 2) and “In the Member States receiving support from the Cohesion Fund, the ERDF and the Cohesion Fund shall jointly provide assistance for operational programmes on transport infrastructure and the environment, including for major projects.” (ibid Article 34, 3); iv) Micro-zoning within regions has been abolished. In addition: i) the three new objectives incorporate the missions of the previous Objectives 1, 2 and 3 as well as the previous Community initiatives: Interreg III, Equal and Urban II; ii) Interreg III is integrated into the European territorial cooperation objective; iii) The Urban II and Equal programmes are integrated into the convergence and regional competitiveness and employment objectives; iv) The Leader + programme and European Agricultural Guidance and Guarantee Fund (EAGGF) are replaced by the European Agricultural Fund for Rural Development (EAFRD), the Financial Instrument for Fisheries Guidance (FIFG) becomes the European Fisheries Fund (EFF). The EAFRD and the EFF now have their own legal basis and are no longer involved in the Cohesion policy..
(15) 07b Salmon. 30/5/08. 09:04. Página 161. New directions in European Regional Policy and ther implications for Spain. 161. Finally, a greater degree of financial engineering is supported by the new regulations (Regulation 1083/2006). The managing authorities of the Structural Fund programmes can finance a wide range of public-private partnerships and ensure simpler and more flexible management of the funds earmarked for development. As part of an operational programme, the Structural Funds may finance expenditure in respect of an operation to support financial engineering instruments for enterprises, primarily SMEs, such as venture capital funds, guarantee funds and loan funds. To facilitate the implementation of these financial engineering instruments and to establish sound and efficient management of the Cohesion funds the Commission, in cooperation with the European Investment Bank (EIB) and the Council of Europe Development Bank (CEDB), launched three new initiatives: JASPERS will assist member states and regions in the preparation of major projects; JEREMIE will increase access to finance for the development of SMEs; and JESSICA will promote sustainable investment in urban areas. Overall, the European Commission argues that the changes in policy architecture add up to a simplification of the previous Cohesion policy in terms of regulation, administration and funding. They argue that it incorporates more streamlined legislation and simplified rules for the management of cohesion programmes. In administrative terms, a new ‘proportionality’ principle provides for less bureaucracy, national eligibility rules apply instead of Community rules, and member states and regions are asked for more transparency and communication. A more critical assessment would be that Cohesion policy is attempting to meet far too many purposes, spread over too large an area, within a relatively small budget.. 4.. Financial Resources. The European Commission makes ambitious claims for Cohesion policy. But policy measures are constrained by financial resources, even if these do not fully measure the impact of policy. Thus, it is important to identify the magnitude of these resources and their distribution within Spain. In addition, it should be borne in mind that the budget for the EU is due to be reviewed in 2008/9 with particular attention being paid to the two big areas of expenditure, the CAP and Cohesion policy, while eligibility of Member States for the Cohesion Fund is due to be reviewed in 2010 on the basis of Community GNI figures for the EU-25 (Regulation 1083/3006, Article 5, 3). To finance Cohesion policy the EU has allocated a budget of €347000 million for the period 2007-13 (in current 2006 prices), or some €50000 million a year. Although this is more than a third of the whole of the European budget, it is still less than 0.4% of EU GDP. This is a modest sum with which to transform, or even leverage a transformation in, the European economy. Spain is allocated €35217 million (at current 2006 prices) of the European Cohesion policy budget, some 10 per cent of the EU total and the second largest allocation after Poland. On an annual basis this amounts to around €5000 million a year or less.
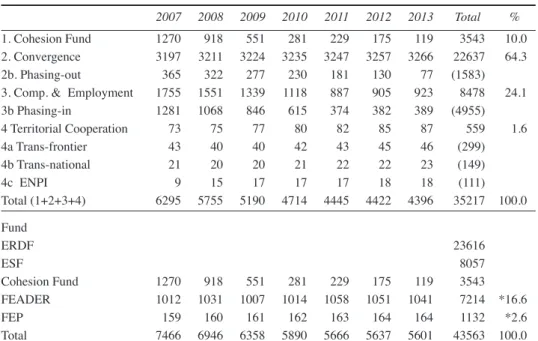
(16) 07b Salmon. 30/5/08. 162. 09:04. Página 162. Salmon, K.. than 0.5 per cent of Spain’s GDP. Of this total €26180 million (74%) is allocated under the Convergence objective, €8477 under the Competitiveness and employment objective and €559 million under the European territorial cooperation objective (Table 5). If the amounts allocated to the European Agricultural Fund for Rural Development (EAFRD) and the European Fisheries Fund (EFF) (of which Spain is allocated over a quarter of the European total for each), and the Technology Fund are added then the total amount over the period rises to €45563 million, an average of €6509 million a year or some 0.6 per cent of GDP. According to government figures the allocation of cohesion funding to Spain in the 2007-13 period is around 50 per cent less than in the previous funding period (2000 to 2006), around 43 per cent less through the Structural funds (although for 2007-13 this excludes rural development and fisheries funding) and 74 per cent less through the Cohesion Fund; MEH 2007b, 52). Crucially, the decline is expressed through a tapering reduction. Thus, cohesion funding is set to fall 30 per cent from €6295 million in 2007 to €4396 million in 2013 ((notably through reductions in payments under the Cohesion Fund and ERDF. Adding in other related payments shows a 25 per cent decline in funding from €7466 to €5601 million (Table 5). Despite this decline, the government has maintained ambitious infrastructure, environment and knowledge economy plans and targets. Within Spain, the pattern of cohesion spending has shifted significantly from the previous funding period. Only four regions now qualify for the highest priority objective, convergence (Table 6). These regions now receive the bulk of cohesion funding through to 2013 (Tables 6 and 7) and will receive similar amounts in nominal terms to the previous funding period. Sharp declines will affect the transition regions: the phasing-out regions of Asturias, Murcia, Ceuta and Melilla, and the phasing-in regions of Canarias (despite additional funding under its outermost region classification), Castilla y León and Comunidad Valenciana, all of which have had their designation changed from Objective 1 (the highest priority for funding in the previous financing period). Cantabria also experiences an abrupt shift, having been re-designated from transitional funding under Objective 1 to a Competitiveness and employment region. Phasing-out and phasing-in regions are subject to transitional funding regimes that involve declining funding through to 2013. For phasing-out regions funding falls through to 2013 in a linear progression from 80 per cent in 2007 of the funding received in 2006 (resulting in an average reduction of 67% over the period 2007-13). For phasing-in regions their funding falls in a linear progression from 75 per cent of the funding received in 2006 through to 15 per cent of their 2006 funding in the last three years (SGAEF, 2006, p.7 ). Thus in the phasing-out region of Asturias under its ERDF and ESF operational programmes funding falls from €118 million in 2007 to €20 million in 2013 (17% of the 2007 level). Similarly, in the phasing-in region of Comunidad Valenciana funding falls from €438.3 million in 2007 to €90.2 million in 2011 (21% of the 2007 level) (Table 6). However, not all regions lose. Those regions now designated under the Competitiveness and employment objective all gain eligibility to relatively small amounts of funding (Table 6)..
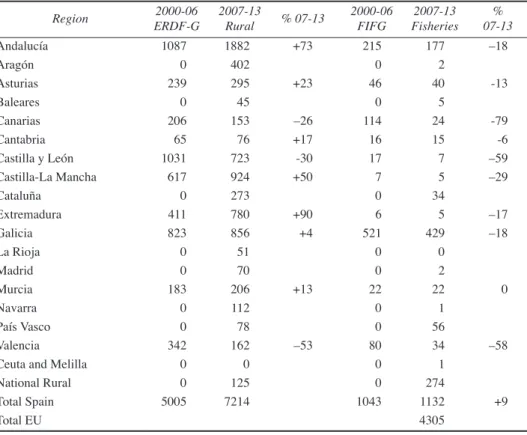
(17) 07b Salmon. 30/5/08. 09:04. Página 163. New directions in European Regional Policy and ther implications for Spain. Table 5.. 163. Cohesion Funding Allocation for Spain by Objective and Fund 2007-13. 1. Cohesion Fund 2. Convergence 2b. Phasing-out 3. Comp. & Employment 3b Phasing-in 4 Territorial Cooperation 4a Trans-frontier 4b Trans-national 4c ENPI Total (1+2+3+4) Fund ERDF ESF Cohesion Fund FEADER FEP Total. 2007. 2008. 2009. 2010. 2011. 2012. 2013. Total. %. 1270 3197 365 1755 1281 73 43 21 9 6295. 918 3211 322 1551 1068 75 40 20 15 5755. 551 3224 277 1339 846 77 40 20 17 5190. 281 3235 230 1118 615 80 42 21 17 4714. 229 3247 181 887 374 82 43 22 17 4445. 175 3257 130 905 382 85 45 22 18 4422. 119 3266 77 923 389 87 46 23 18 4396. 3543 22637 (1583) 8478 (4955) 559 (299) (149) (111) 35217. 10.0 64.3. 100.0. 119 1041 164 5601. 23616 8057 3543 7214 1132 43563. *16.6 *2.6 100.0. 1270 1012 159 7466. 918 1031 160 6946. 551 1007 161 6358. 281 1014 162 5890. 229 1058 163 5666. 175 1051 164 5637. 24.1 1.6. Figures in million euro. The Technology Fund amounts to €2200 million to total funding 2007-13. Funding is drawn from the ERDF to enhance research, development and innovation. Seventy per cent of the Fund will be allocated for the regions eligible under the Convergence objective, 5.5% for phasing-out regions, 10% for Regional competitiveness and employment objective regions and 15% for phasing-in regions. Trans-frontier cooperation: Funding allocation: Spain and Portugal 69%, Spain and France 31% Trans-national cooperation: Funding allocation: SW Europe 36%, Azores-Canarias-Madeira 30%, Mediterranean 20%, Atlantic 13%. European Neighbourhood and Partnership Instrument, ENPI: Funding allocation: Andalucía-Northern Morocco 70%, Mediterranean Basin 15%, Canarias-Southern Morocco 14% * Per cent of the overall total Source: MEH 2007b, p. 8 and 163-8 and European Commission 2007a, p. 10. Funding for rural development (under the EFRD) and for fisheries (under the EFF) has also been redistributed (Table 7). For rural development all regions receive additional direct funding compared with the period 2000-06, with the exception of the three phasing-in regions of Canarias, Castilla y León and Valencia. There are above the national average increases in the regions designated under the Convergence objective, with the exception of Galicia, as well as new funding in the regions designated under the Competitiveness and employment objective. Under the Fisheries fund, Spain is allocated a small increase in funding on the previous financing period (26% of all EU funding), with the bulk of direct funding concentrated on Galicia. But all regions see their direct funding cut with the exception of the regions designated under the Competitiveness and employment objective, which benefit from new funding..
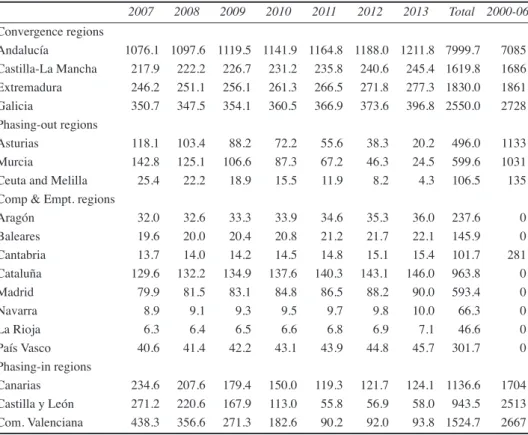
(18) 07b Salmon. 30/5/08. 164. 09:04. Página 164. Salmon, K.. Table 6.. Funding Allocation for ERDF and ESF Operation Programmes 2007-13 2007. 2008. 2009. 2010. 2011. 2012. 2013. Total 2000-06. Convergence regions Andalucía 1076.1 1097.6 1119.5 1141.9 1164.8 1188.0 1211.8 7999.7 Castilla-La Mancha 217.9 222.2 226.7 231.2 235.8 240.6 245.4 1619.8 Extremadura 246.2 251.1 256.1 261.3 266.5 271.8 277.3 1830.0 Galicia 350.7 347.5 354.1 360.5 366.9 373.6 396.8 2550.0 Phasing-out regions Asturias 118.1 103.4 88.2 72.2 55.6 38.3 20.2 496.0 Murcia 142.8 125.1 106.6 87.3 67.2 46.3 24.5 599.6 Ceuta and Melilla 25.4 22.2 18.9 15.5 11.9 8.2 4.3 106.5 Comp & Empt. regions Aragón 32.0 32.6 33.3 33.9 34.6 35.3 36.0 237.6 Baleares 19.6 20.0 20.4 20.8 21.2 21.7 22.1 145.9 Cantabria 13.7 14.0 14.2 14.5 14.8 15.1 15.4 101.7 Cataluña 129.6 132.2 134.9 137.6 140.3 143.1 146.0 963.8 Madrid 79.9 81.5 83.1 84.8 86.5 88.2 90.0 593.4 Navarra 8.9 9.1 9.3 9.5 9.7 9.8 10.0 66.3 La Rioja 6.3 6.4 6.5 6.6 6.8 6.9 7.1 46.6 País Vasco 40.6 41.4 42.2 43.1 43.9 44.8 45.7 301.7 Phasing-in regions Canarias 234.6 207.6 179.4 150.0 119.3 121.7 124.1 1136.6 Castilla y León 271.2 220.6 167.9 113.0 55.8 56.9 58.0 943.5 Com. Valenciana 438.3 356.6 271.3 182.6 90.2 92.0 93.8 1524.7. 7085 1686 1861 2728 1133 1031 135 0 0 281 0 0 0 0 0 1704 2513 2667. Figures for Canarias include funding under the Outermost Region programme. Figures for Ceuta and Melilla include additional Cohesion funding support for them. Figures in million euro. Source: MEH 2007b, 164-7 and MEH 2007c, p. 91.. As a result of the reclassification of regions therefore, there are substantial variations in the contribution of European transfers to regional budgets under the Cohesion policy and related funding, from close to eight per cent of the budget in Extremadura and nearly six per cent in Andalucía to around half a per cent in the Competitiveness and employment regions such as Cataluña. The government has said that it will try to alleviate the impact of the loss of funding on regions, especially those losing Objective 1 status. They may be able to compensate through the Inter-territorial Compensation Fund (ICF). In the run-up to the 2008 elections the government suggested that no region would lose more than one-third of the funding they previously received (regions that have changed status), and for the second group (those on the point of losing Objective1 status) not more than half. In any event, the funding changes will demand either a shift in regional development strategies, a shift in models of project funding, or both..
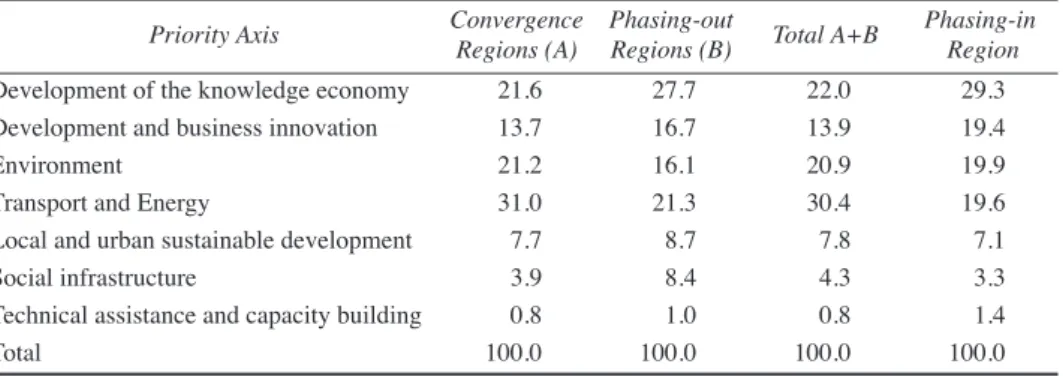
(19) 07b Salmon. 30/5/08. 09:04. Página 165. New directions in European Regional Policy and ther implications for Spain. Table 7.. 165. Distribution of Rural Development and Fisheries Funding by Region. Region Andalucía Aragón Asturias Baleares Canarias Cantabria Castilla y León Castilla-La Mancha Cataluña Extremadura Galicia La Rioja Madrid Murcia Navarra País Vasco Valencia Ceuta and Melilla National Rural Total Spain Total EU. 2000-06 ERDF-G. 2007-13 Rural. 1087 0 239 0 206 65 1031 617 0 411 823 0 0 183 0 0 342 0 0 5005. 1882 402 295 45 153 76 723 924 273 780 856 51 70 206 112 78 162 0 125 7214. % 07-13 +73 +23 –26 +17 -30 +50 +90 +4. +13. –53. 2000-06 FIFG. 2007-13 Fisheries. % 07-13. 215 0 46 0 114 16 17 7 0 6 521 0 0 22 0 0 80 0 0 1043. 177 2 40 5 24 15 7 5 34 5 429 0 2 22 1 56 34 1 274 1132 4305. –18 -13 -79 -6 –59 –29 –17 –18. 0. –58. +9. Figures at current 2006 prices. AGE: Administración General del Estado. Source: MEH 2007b, p. 205 and 209/10 and MEH 2007c, p. 91.. Thematically resources are shifted towards supporting the Lisbon Agenda. Thus, of the €35217 million of Cohesion policy funding 2007-13, €8000 million is allocated to research, development and innovation (European Commission 2008). In addition, more than €8000 million has been allocated for the development of human capital (ibid). In full Convergence regions “Lisbon-related expenditure has increased from about 53% to almost 70%... [and] in full Competitiveness and Employment regions ... this percentage has exceeded 80%.” (ibid, 2008). Under the ERDF €17389 million is allocated to the Convergence objective, €5668 million to the Competitiveness and employment objective, and 559 million to the European territorial cooperation objective, a total of €23616 million or some three-quarters of the Structural Funds and 67 per cent of all cohesion funding in Spain (ibid 2008). The indicative distribution of this funding by priority axis is shown in Tables 8 and 9. In regions outside of the Competitiveness and employment objective, funding for the knowledge economy is second only to the development of transport and energy, while inside this objective it is the dominant focus of support. Compared.
(20) 07b Salmon. 30/5/08. 166. 09:04. Página 166. Salmon, K.. Table 8.. Indicative Distribution of ERDF Funding in Spain by ERDF Priority Axis, 2007-13. Priority Axis Development of the knowledge economy Development and business innovation Environment Transport and Energy Local and urban sustainable development Social infrastructure Technical assistance and capacity building Total. Convergence Regions (A). Phasing-out Regions (B). Total A+B. Phasing-in Region. 21.6 13.7 21.2 31.0 7.7 3.9 0.8 100.0. 27.7 16.7 16.1 21.3 8.7 8.4 1.0 100.0. 22.0 13.9 20.9 30.4 7.8 4.3 0.8 100.0. 29.3 19.4 19.9 19.6 7.1 3.3 1.4 100.0. Source: MEH 2007b, p. 169.. Table 9.. Indicative Distribution of ERDF Funding in Competitiveness Regions by ERDF Priority Axis, 2007-13 Priority Axis. Knowledge economy, innovation, business development Environment and risk prevention Accessibility to service networks Local and urban sustainable development Technical assistance and capacity building Total. Competitiveness 67.9 5.0 12.1 13.5 1.4 100.0. Source: MEH 2007b, p. 169.. with the previous funding period, the amount dedicated to the knowledge economy rises from 9.3% to 25.7% of total spending under the Structural funds. The European Social Fund accounts for the other quarter of the Structural Funds, amounting to some €8057 million. The priorities for this fund are fostering employment, equality and inclusion (€4450 million, 55.2% of funding), and the creation of entrepreneurship, adaptability (€2181 million, 27.1% of funding; MEH 2007b, 170). Under the Cohesion Fund 45 per cent of the €3543 million is allocated to European transport networks, 53 per cent to environment and sustainable development and two per cent to technical assistance (ibid, p. 171). The National Strategic Reference Framework (NSRF) sets out the overall vision and goals of Cohesion policy. These are to make Spain a more attractive place to invest and work in; to improve knowledge and innovation to strengthen growth; and to create more and better jobs (European Commission 2008). By 2014 the NSRF envisages smaller economic disparities between regions, a public sector with modern policies [suggesting current policies are not modern!], a competitive and innovative business sector, and a well educated population open to the knowledge economy without differences between men and women (MEH 2007b, 69)..
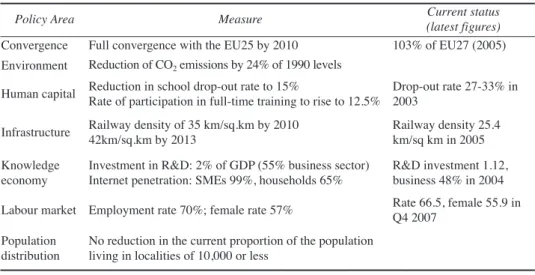
(21) 07b Salmon. 30/5/08. 09:04. Página 167. New directions in European Regional Policy and ther implications for Spain. 167. To measure progress towards these goals a number of specific targets have been set in the National Reform Programme and in the NSRF. The key targets are shown in Table 10. In many areas for which targets have been set, Spain is still lagging behind (see MEH 2007b). Low productivity has frequently been cited as one of the principal weaknesses of the economy and this in turn has been attributed partly to low levels of investment in research and development as well as to the relatively low employment rate. Thus, Eurostat (2007) lists Spain as having an R&D intensity (R&D expenditure as a proportion of GDP) of only 1.12 in 2005, compared with an EU-15 rate of 1.91, the US 2.68 (in 2004), Japan 3.18 (in 2004), and China 1.34. Equally, R&D financed by the business sector has also been very low. In 2004 it was only 48 per cent compared with an EU-15 average of 55 per cent, 64 per cent in the US and 75 per cent in Japan. On innovation, Parvan (2007) groups Spain into a cluster of trailing countries on the European Innovation Scoreboard 2006. This is underlined by patent statistics. In terms of patent applications per million inhabitants to the European Patents Office in 2004, the figure for Spain was only 28.6 per against an EU-27 average of 112 (Felix 2008). Perhaps what is noticeable are the areas in which there do not appear to be clear targets, for example in water use and in relation the more sensitive elements of the labour market, such as the proportion of the workforce on fixed-term contracts. But overall, what these figures suggest is the need for a different type of development model to that followed in previous years.. Table 10. Policy Area. Cohesion Policy Targets by 2014 Measure. Current status (latest figures) 103% of EU27 (2005). Convergence. Full convergence with the EU25 by 2010. Environment. Reduction of CO2 emissions by 24% of 1990 levels. Human capital. Reduction in school drop-out rate to 15% Drop-out rate 27-33% in Rate of participation in full-time training to rise to 12.5% 2003. Infrastructure. Railway density of 35 km/sq.km by 2010 42km/sq.km by 2013. Railway density 25.4 km/sq km in 2005. Knowledge economy. Investment in R&D: 2% of GDP (55% business sector) Internet penetration: SMEs 99%, households 65%. R&D investment 1.12, business 48% in 2004. Labour market Employment rate 70%; female rate 57% Population distribution. Rate 66.5, female 55.9 in Q4 2007. No reduction in the current proportion of the population living in localities of 10,000 or less. Source: MEH 2007b, pp.69-70 Employment rate: Ratio of those aged 16-64 in employment to the total population aged 16-64; current rates from INE 2008, EPA Q4 2007. Current railway density and school drop-out rate (children not completing secondary education) from MEH 2007b, 111 and 138. Current convergence figure is GDP per capita in purchasing power standards from Eurostat 2008..
(22) 07b Salmon. 30/5/08. 09:04. Página 168. 168. Salmon, K.. 5.. Regional Convergence and Regions. Reducing economic disparities between regions is at the heart of Cohesion policy. It is the principle mechanism for implementing Article 158 of the Treaty establishing the European Community, which states that: “in order to strengthen its economic and social cohesion, the Community is to aim at reducing disparities between the levels of development of the various regions and the backwardness of the least favoured regions or islands, including rural areas.” (Regulation 1083/2006, preamble 1). Measuring these disparities has thus been an important metric in both directing policy and measuring its success. In Spain, there is little doubt that Cohesion funding has contributed to strong growth and to real economic convergence with the EU both at the state and the regional level (Sosvilla Rivero, 2007; MEH, 2007b), but there has been less success in reducing inter-regional disparities (Villaverde Castro, 2007a), a characteristic noted across other states in the EU (European Commission, 2007b; Giannetti, 2002). This persistence of inter-regional disparities along with continued polarisation on the state capital and a more widespread tendency towards polarisation on regional and provincial cities and other intra-regional imbalances, suggests that spatial economic disparities are systemic to the capitalist system (Harvey, 1982, Hudson, 2007). At the state level growth in Spain has enabled it to catch-up with its neighbours, a process now occurring among the new member states. Growth averaged over one percentage point more than that for the EU-15 from 1994 to 2007, taking Gross Domestic Product (GDP) at purchasing power standards from 78.6 per cent of the EU15 average to over 90 per cent of the EU-15 average and 105 per cent of the EU-27 average (Table 11). The convergence experienced by Spain reflects a Europe-wide pattern in which “Disparities in income and employment across the European Union have narrowed over the past decade and, most especially, since the mid-1990s.” (European Commission, 2004, p. 2; see also Beugelsdijk and Eijffinger 2005). According to the European Commission (2007b) convergence was particularly apparent in the new member states. However, convergence is not a continuous process. In Spain, historical evidence dating back to 1960 describes a path of convergence interrupted by reversals, notably in the early 1980s and early 1990s. Data from the European Commission and Eurostat (Table 11) indicates that the gap between the Spanish economy and the rest of the EU narrowed to 81 per cent in 1975, then widened to only 72 per cent in 1985. Strong growth in Spain during the late 1980s narrowed the gap again to around 77 per cent in the early 1990s. After this, convergence slipped back briefly before recovering to 79 per cent in 1994 and thence on to its present level. Equally, the European Commission (2007b, x) notes that: “growth in Portugal has been below the EU average since 1999.” Convergence appears to have been pro-cyclical, a feature of periods of Europeanwide growth or arguably of periods of more intense integration (Alberola, 1998), while disparities have opened up during periods of stagnation (Armstrong, 1995; Rodríguez-Pose, 1999). The economic cycle has been more pronounced in Spain than.
(23) 07b Salmon. 30/5/08. 09:04. Página 169. New directions in European Regional Policy and ther implications for Spain. 169. Table 11. GDP per capita in Spain in Relation to the EU-15 Average of 100 Spain. 1960. 1975. 1985. 1990. 1994. 1995. 2000. 2001. 2003. 2006. 59.6. 81.1. 71.8. 77.8. 78.6. 79. 83.4. 84.3. 87.2. 94. GDP in purchasing power standards Source: European Commission; sequence 1994 onwards from Eurostat 2004; 2006 from OECD database.. for the EU as a whole, with higher than average levels of growth and deeper troughs. At the turn of the century this pattern appeared to have either changed or been delayed with a period of sustained growth stretching from the mid-1990s to 2008. Part of the explanation for this exceptional performance may be attributed to cohesion funding. This helped underpin public investment, which in turn added to economic growth during upswings in the economic cycle and maintained the momentum of public investment, and of domestic demand, when European growth slowed. Within Spain the evolution of disparities between regions is more difficult to read, although the long-term picture appears to have been one of relatively few changes in the ranking of regions (Table 12). During the Francoist period a number of authors have concluded that Spain was dominated by inter-regional convergence (Alcaide Inchausti et al., 1990; Cuadrado Roura, 1988). “Regions in the southern and western Spanish peripheries were catching-up with the more developed regions of north-eastern Spain and Madrid” (Rodríguez-Pose, 2000, p. 89). Equally, there appears to be agreement that convergence came to a stop in the late 1970s and early 1980s (Alcaide Inchausti, 1988 and 2003; Cuadrado Roura et al., 1999; Villaverde Castro, 1999). From the early 1980s to the mid-1990s Rodríguez-Pose (2000, p. 92) suggests that there was a slowdown in convergence across Spanish regions. More recently (from 1995-2007), despite the fact that Spain has been in receipt of large Cohesion policy payments, and despite some of the poorer regions growing above the Spanish average (INE, 2004), there has not been a marked degree of convergence or a re-ranking of the poorer regions (Villaverde Castro, 2007a). The concentration of European resources on the poorer regions appears to be insufficient to overcome the structural factors shaping national development. Convergence is a core policy objective of Cohesion policy, but there are some conceptual issues associated with its measurement embracing both the indicators used and the regional units being measured. Most commonly convergence is measured through the index of Gross National Income (GNI) per capita. This measure is sensitive to spatial variations in population growth rates. Thus part of the explanation for the patterns of convergence in the 1960s and 1970s was probably attributable to large out-migration flows from the poorer regions and large inflows into Barcelona and Madrid, and to the cessation of these flows in the mid-1970s (Alcaide Inchausti, 1988). Similarly, variations in population growth rates between regions have been significant since the turn of the century, associated with the regional destinations of over four million immigrants to Spain (Alcaide Inchausti, 2007). Table 12 illustrates the pattern of population change from 1986 to 2007. There are substantial variations around the national growth rate of 17 per cent, from a 51 per cent increase in Baleares.
(24) 07b Salmon. 30/5/08. 170. 09:04. Página 170. Salmon, K.. to minus three per cent in Asturias. Generally significant increases above the national average have occurred in regions around the Mediterranean coast and in Madrid. In contrast the interior and north Atlantic coastal regions have experienced little growth or absolute losses. Apart from the absolute change in population, what is important is the age and skill composition of that population growth or decline. A variety of other indicators can also be used to measure convergence, including various measures of income, infrastructure, production and unemployment. Each indicator has its own merits and limitations. For example, while the intensity of production is best measured by GDP/GNI per capita, affluence and poverty are better measured by disposable household income per capita (income after taxes). In poorer regions the differences between disposable per capita incomes and gross per capita income is positive, while in richer regions the results are negative.” (Moreno, 2002, p. 401). Direct taxes and public sector transfers clearly contribute to the reduction of this form of regional income inequality (see Ayala, 1994). An alternative metric for convergence has been presented by Marchante and Ortega (2006). Using quality of life indicators (human development) indices across NUTS level 2 regions in Spain they concluded that whereas per capita regional accounts disparities have remained constant, convergence was achieved in five quality of life indicators (infant survival rate, adult literacy rate, mean schooling years and the long term rate of unemployment) and two alternative economic measures (total personal income less current grants and gross personal disposable income. Clearly, national income aggregates only measure one dimension of development. Apart from the units of measurement and the separation of causal factors from effect, a fundamental conceptual problem with the discussion of regional convergence centres on the definition of the region. At the simplest level this is a problem of scale. Although the European Commission designates regions for the Convergence and the Competitiveness and employment objectives at the NUTS level 2 scale, in practice these regions are extremely variable in economic, geographic and population size. In Spain, apart from the city regions of Ceuta and Melilla, they vary in size from the region of La Rioja with an area of only 5,000 square kilometres, less than one per cent of national GDP and a population of some 310,000, to Andalucía with an area of over 87,000 square kilometres, some 14 per cent of national GDP and a population of over eight million. They do not represent a set of separate economies. Intra-regional variations in economic disparities are considerably greater than inter-regional ones. Indeed, the greatest contrasts are illustrated at the intra-urban scale. The finer the spatial grid of regions, the greater is the variation in economic disparities. In other words, patterns of economic disparities are extremely complex when viewed at anything other than the low resolution of states. Long-term decline in primary activities has left many interior rural areas with a weak economic base and few amenities. Manufacturing industrial areas have also been in selective decline or experienced significant restructuring since the 1970s (for example, in Asturias, around Cádiz, in Barcelona and in País Vasco). In contrast, areas that have been able to take advantage of growth in service industry have grown. Two axes of growth have been apparent, the Ebro Valley (to Pamplona and Vitoria) and the Mediterranean coast. In.
(25) 07b Salmon. 30/5/08. 09:04. Página 171. New directions in European Regional Policy and ther implications for Spain. Table 12.. 171. GGP per capita, Population Change and Unemployment in Spanish Regions. Region Madrid País Vasco Navarra Cataluña Baleares La Rioja Aragón Spain Cantabria Castilla y León Com. Valenciana Canarias Ceuta and Melilla Asturias Murcia Galicia Castilla-La Mancha Andalucía Extremadura EU-27. GDP per capita 1985 132 114 110 124 147 110 111 100 98 90 105 92 83 96 84 80 77 71 66. GDP per capita 2005 27220 26592 26271 24814 23119 22362 22262 20933 20500 19707 19273 19040 18782 18329 17823 17110 16636 16343 14163 22400. 130 127 126 119 110 107 106 100 98 94 92 91 90 88 85 82 79 78 68. GDP per capita pps Unemployment Rate Pop. EU27 = 100 Q4 2007 Change 2005 2006 1986-2007 % Spain 100 133.9 136 26.8 6.4 74 130.8 136 0.2 5.7 67 129.2 132 17.3 4.3 50 122.1 124 20.4 6.6 77 113.7 115 51.1 9.0 105 110.0 111 18.7 5.6 65 109.5 112 9.4 5.1 59 103.0 105 17.3 8.6 100 100.9 104 9.5 4.6 54 97.0 100 –2.2 7.0 81 94.8 96 30.6 9.0 105 93.7 95 37.8 11.0 128 92.4 96 23.4 18.3 213 90.2 94 –3.4 8.1 94 87.7 89 38.2 8.3 96 84.2 88 -2.6 7.5 87 81.8 83 17.9 7.9 92 80.4 82 18.4 14.0 163 69.7 71 0.2 14.6 170 100.0 100. pps: purchasing power standards. Source: 1985 data based on gross production per capita, Banco de Bilbao 1988 and Eurostat (2008) GDP per capita for 2006 at pps figures from INE 2007a. Population change based on INE ‘de derecho’ figures for 1986 and INE 2007b.. addition, there has been a long-term polarisation of growth on the region of Madrid, and on regional and provincial capital cities and some towns with specific geographic or economic advantages. The administrative regions of Spain (the comunidades autónomas) conceal these patterns of contrasting growth. For example, in Andalucia, GDP in nominal terms grew by 40 per cent 1995 to 2001, but growth varied from 54 and 49 per cent in the two coastal provinces of Almería and Málaga respectively, to only 32 per cent in the landlocked province of Jaén (INE 2003). Even within the province of Málaga there is an enormous contrast between the urban sprawl that clings to the coast and the interior. There are not so much lagging or leading (NUTS 2) regions, but a mosaic of localities each facing their own specific challenges, possessing their own potentials, and linked into their own specific economic networks with other localities, regions and states. Finally, the gradual process of convergence between regions overlies evidence of continued polarisation, especially on Madrid. The region housing the national capital has increased its contribution to national GDP from less than 12 per cent in.
Figure
+7
Documento similar