ORIGINAL PAPER
The role of developmental stage in frost tolerance of
Pinus pinea
L.
seedlings and saplings
Marta Pardos&José Climent&Helena Almeida&
Rafael Calama
Received: 9 September 2013 / Accepted: 13 January 2014
#INRA and Springer-Verlag France 2014
Abstract
&ContextAlthough drought is generally considered the main environmental constraint in Mediterranean environments, the ability to acclimate to and tolerate frost in early developmental stages can be a determinant for seedling survival of many Mediterranean tree species like stone pine (Pinus pineaL.).
&Aims The aim of this study was to assess the impact of the developmental stage of naturally regenerated stone pine indi-viduals on tolerance to low temperature (LT) from summer to late autumn and in spring, at a highly continental site in central Spain. Specifically, we tested to what extent the differences in tolerance are related to shoot heteroblasty.
&Methods We assessed LT tolerance of needles from individ-uals at three age classes (class C1: seedlings, class C2: 4- to 8-year-old saplings and class C3: >9-8-year-old saplings) over nine dates from summer to spring.
&ResultsLT tolerance displayed severe seasonal trends and differed between age classes. It usually increased with sapling age. Such differences were tightly related to heteroblasty of the shoots. Our results point to a higher LT tolerance
associated with larger leaf dry mass per unit area (LMA) values. No impact of late frosts on shoot growth rates was detected during this study.
& Conclusions Developmental changes during early plant growth seem to play a role in frost tolerance of stone pine seedlings, a finding which furthers our understanding of re-generation dynamics in this species in areas with continental influence.
Keywords Mediterranean stone pine . Low-temperature acclimation . Electrolyte leakage . Phase change . Late spring frosts
1 Introduction
The timing of growth, cessation, dormancy, cold acclimation, subsequent deacclimation and depth of cold hardiness are critical components of survival for plants in temperate cli-mates (e.g. Kalcsits et al.2009). The alterations induced by low temperatures comprise changes in the concentrations of a wide range of metabolites (sugars, protective proteins), mod-ification of cell membranes, changes in hormone levels and alterations in gene expression (Costa e Silva et al. 2009). Despite the fact that low-temperature (LT) tolerance in coni-fers (also referred to as cold or frost tolerance or hardiness or frost sensitivity) has been investigated for over a century in temperate (e.g. Bigras et al.2001) and boreal (e.g. Strimbeck et al.2008) species, relatively little is known about the mech-anisms associated with LT tolerance in natural regeneration of Mediterranean continental pine species (e.g. Sakai 1983; Climent et al.2009).
Although drought is widely considered the main environ-mental constraint in Mediterranean ecosystems, LT tolerance plays a decisive role in inland and mountain areas where frosts can be equally or more limiting than drought (Puértolas et al.
Handling Editor:Gilbert Aussenac
Contribution of the co-authorsThe first and last authors developed the idea of the study, set up the experimental design and conducted the experimental part of the study. Both authors have been jointly working in the ecology of stone pine natural regeneration since long. The first author wrote the main body of the text. The last author did the statistical analysis and modelling. The second and third authors contributed to improve the text with their own experience in freezing injury. The second author also contributed with his knowledge in ontogeny differentiation and heteroblasty of pines that help greatly to discuss our results. M. Pardos (*)
:
J. Climent:
R. CalamaDepartment of Sylviculture and Forest System Management, CIFOR-INIA, crtra Coruña Km 7.5, 28040 Madrid, Spain e-mail: pardos@inia.es
H. Almeida
2005; Thomas and Sporns 2009). Drought and frost, for instance, lead to similar physiological responses in conifers, which are aimed at preventing cellular dehydration (Costa e Silva et al.2009). Spring LT tolerance is an adaptive trait of considerable importance in Mediterranean ecosystems. Injury by spring frost events can occur prior to bud burst, as tissues deacclimate in the spring, or after bud burst, as a damage to newly flushed shoots (e.g. Larcher2005). Even at the same phase of bud break, spring LT tolerance can differ depending on the hardening conditions during the previous autumn (Hannertz1994). Thus, hardening conditions in autumn may influence seedling susceptibility to frost during dehardening and shoot elongation (Sogaard et al.2009).
The effects of global warming can be complex and coun-terintuitive in mountain or inland Mediterranean ecosystems. More frequent drought events may make up for diminished acclimation due to warming (Kreyling et al.2013). The rise in mean autumn and winter temperatures, the changes in the timing of the onset of subfreezing temperatures or in the frequency and duration of midwinter thaws and the unpredict-ability of spring frost events could lead to inadequate re-sponses in some species (Palacio et al.2005). In spite of the rise in temperatures during autumn and winter, plants may be more prone to freezing injury due to wide temperature fluctu-ations (Kalcsits et al.2009). Thus, the lack of plant synchrony with the environment could be a primary cause of temperature stress injury, and only proper timing of hardening in autumn and dehardening in spring will minimize frost damage (Ensminger et al.2009).
Given that the first years are critical for the establishment of pine natural regeneration, differential responses to extreme temperatures in early developmental stages are likely to be subjected to strong directional selection within the species’ ecological niche (Climent et al.2009). Furthermore, the dif-ferent susceptibility to frosts of tree seedlings is frequently related to differences in the developmental features of juvenile and adult plants (Darrow et al.2001; Winn1999; Gusta et al. 2009). Heteroblasty is defined as a rather sudden and substan-tial change in the form of plant structures during ontogeny, as opposed to the more gradual or subtle ontogenetic changes occurring in all species (Zotz et al.2011). In the case of pines particularly, the change from juvenile shoot with solely pri-mary needles to an adult shoot with secondary needles bun-dled in fascicles implies marked physiological differences (Zotz et al.2011). In pines, the primary needles are generally more sensitive to frost damage than the secondary needles (Climent et al.2009). At least part of these ontogenetic dif-ferences in LT tolerance between juvenile and adult foliage may be due to the generally higher sclerophylly of adult leaves in many species. Since leaf dry mass per unit area (LMA) is often used to quantify leaf structure (i.e. thicker or denser leaves mean higher LMA), differences in leaf mass per area are a simple proxy of variable leaf sclerophylly in plants (Han
et al. 2008). As lignified or suberized tissues present in sclerophyllous leaves offer physical barriers to the propaga-tion of ice within leaf tissues (Larcher2005), a high leaf mass per area can partly explain higher LT tolerance within a given species.
In addition to changes in ontogenetic development, LT tolerance in Mediterranean woody plants and particularly acclimation processes are closely linked to the seasonal de-velopmental phases, i.e. phenology (e.g. Palacio et al.2005), although the interplay between phenology and ontogenetic heteroblasty in young plants remains largely unexplored (Jones1999). Plants need to finish their growth before starting cold acclimation. However, many Mediterranean species show sequential phenological patterns (Castro-Díez and Montserrat-Martí 1998) and physiological activity (Pardos et al.2010) throughout most of the year.
The Mediterranean stone pine or umbrella pine (Pinus pinea) is one of the most characteristic trees of the Mediterranean flora. Although this species is well adapted to the coastal thermo-Mediterranean areas where frost damage is not a relevant issue, it also thrives naturally in sandy conti-nental areas of central Spain, where yearly and daily thermal oscillations are huge and night frosts are frequent for several months of the year. Like other temperate pines, adult stone pine shoots have a cyclic, preformed growth pattern (Lanner 1976) occurring mainly in spring, from April to late June– early July. By contrast, young seedlings show neo-formed growth with exclusively primary needles for several years, and shoot growth merely stops in autumn with a typical brush-like apex, instead of a true winter bud (Mutke et al.2012). The growth rate is slow in early spring and reaches a maximum close to the end of the elongation period. The combination of unusually warm early springs which advance shoot phenology by several weeks and the occurrence of only one night frost in May can damage the soft tissues of some shoots (Mutke et al. 2003, Mutke et al.2005). True winter buds may not be present until 4 to 8 years of age depending on environmental condi-tions. This ontogenetic delay linked to shoot heteroblasty is shared by other Mediterranean pine species, like Pinus halepensisandPinus canariensis(Climent et al.2011; Klaus 1989).
the present study, we address the question of whether the developmental changes during early plant stages hold the key to a clearer understanding of stone pine regeneration dynamics associated with frost acclimation.
Our main objective was to determine the influence of the developmental status of stone pine seedlings in LT tolerance from summer through late autumn and in spring. Most studies have concentrated on cold hardiness in the fall, just before elongation stops, and in the spring just after elongation re-sumes. These are the periods when frost damage poses the greatest risk to temperate conifers (Bower and Aitken2006). Specifically, we ask whether the differences in LT tolerance between age classes are related to differences in shoot heteroblasty. We use LMA as an indicator of the ontogenetic differences in LT tolerance between juvenile and adult foliage, although other potential drivers (e.g. carbohydrates) that could be influential were not included in the analysis.
2 Materials and methods
2.1 Study site, sampling and sample preparation
This study site was located in central Spain (41° 28′N, 4° 43′ W), at an altitude of 710 m in a natural even-aged (100– 120 years old)P. pineastand. Soils are deep sandy deposits typical of the flat sedimentary area of the Duero river basin. The climate is moderately dry and continental, with an average annual rainfall of 450 mm, large day-night temperature oscil-lation, monthly mean temperatures ranging from 4.0 °C in January to 21.7 °C in July and absolute temperatures ranging from 45 to−12 °C. Air temperature was monitored at 10-min intervals with an automatic HOBO data logger (Pro v2, ONSET, MA, USA) installed in a gap at the centre of the site. Plants from three age-height classes [C1: seedlings <20 cm high, 2-year-old seedlings; C2: seedlings between 21 and 50 cm high, 4- to 8-year-old seedlings; C3: saplings between 51 and 200 cm high, more than 9 years old] were chosen for the study. The type of leaves on the seedlings differed accord-ing to the plant class due to the notable heteroblastic change that takes place between juvenile and adult vegetative phases in this species. Class C1 were 2-year-old seedlings comprising a juvenile shoot with solely primary needles, class C2 were seedlings in a transitional vegetative state (seedlings bore some secondary needles but retained abundant primary needles) and class C3 were seedlings that had an adult shoot with only secondary needles bundled in fascicles.
On nine dates between June 2009 and May 2010, LT tolerance in P. pinea recruitment was assessed. Primary needles were sampled for plants in classes C1 and C2, and secondary needles were sampled for plants in class C3. Samples were collected at 4-week intervals from June to mid-December 2009 (the acclimation period being from
September to early December) and from March to May 2010. Samples were collected in the field from six plants per class, one sample for each temperature and each plant tested. From June to mid-December 2009, the samples consisted of current-year lateral branch tips; from March to May 2010, overwintered needles were used. In the case of 2-year-old seedlings, samples consisted of the main shoot. Samples were of sufficient size to provide the needles required for the freezing tests. The samples were rinsed with water, blotted with paper towels, stored in plastic bags and transported in an insulated box to the laboratory where they were immediately prepared for freezing.
On each measuring date, six to eight samples of ten needles per class were used to determine needle mass area (LMA), calculated as needle dry mass per needle area (grams per square centimetre). Projected needle area was determined by scanning and posterior application of Winfolia2002a software (Regent Instruments Inc. Switzerland), while dry mass was obtained after oven-drying the needles at 70 °C for 24 h. For each measuring date, differences in LMA between classes were analyzed using ANOVA.
2.2 Artificial freezing test
shaking the test tubes for 15 min at 20 °C. Samples were oven-heated at 90 °C for 2 h to heat-kill the needles, allowed to cool overnight (lowered to 20 °C), and the final conductivity measured, after shaking again. In each measurement series, the conductivity was also measured in six test tubes with demineralized water only, as a blank. Relative electrolyte leakage (REL), the ratio of initial to final conductivity, corrected for the baseline conductivity of solution blanks, was used as an index of injury. Non-linear curves defining REL response to decreasing temperatures (T) were indepen-dently fitted to the electrolyte data of each individual from each age class. The non-linear relationship was defined by a modification of the classical logistic model, selected from among those showing an asymptotic pattern (Ratkowsky 1990, p. 128):
RELT ¼
RELmax
1þeðb−cTÞ ð1Þ
where RELmax was assumed to have a constant asymptotic value given by the maximum level of cold injury observed for the samples over the whole experiment, which was close to 0.85, andbandcare parameters to be estimated via non-linear least squares estimation. The use of a fixed value of RELmax as a proxy for the maximum relative conductivity attained after slow freezing has been previously proposed (Climent et al.2009) to avoid fitting inconsistencies derived from using minimum freez-ing temperatures that do not cause maximum lethal injuries. After fitting this non-linear model following least squares tech-niques, parametersbandcare estimated for each plant. Thus, we are able to determine the expected behaviour of the curve for non-tested temperatures. Given the properties of the logistic function, LT50=b/cis the inflection point, which coincides with the temperature at which REL equals RELmax/2 and thus repre-sents the temperature at which 50 % cell mortality occurs (Strimbeck and Schaberg2009; Strimbeck et al.2008). Previous studies comparing REL with visible injury symptoms indicate that REL<0.5 RELmaxare associated with reversible chlorosis,
while REL>0.5 RELmaxindicates cell death followed by necro-sis (Strimbeck et al.2007). Thus, relative LT tolerance was based on the mean value of RELmaxobtained from the curve fit for each age class and plant, using a threshold value of 0.5 RELmax to classify each age class as LT sensitive or insensitive. Together with LT50, we also analyzed the individual responses in terms of REL(T=−12 °C), defined as the relative electrolyte leakage mea-sured at the absolute minimum temperature observed under field conditions at the study site (−12 °C). This value can be consid-ered a proxy of LT tolerance to the most adverse winter condi-tions, under a natural environment.
Differences between age classes in LT50and REL(T=−12 °C) were analyzed over the study period by means of a repeated measurements general linear mixed model, considering age class, data and date × age class as fixed effects and a within-subject random plant effect. If overall significant differences in the analyzed parameters were observed, single-date ANOVAs were carried out to define the temporal pattern of variability in age class response.
The non-linear relationship between LT tolerance parame-ters LT50and REL(T=−12 °C)and needle mass area (LMA), as a proxy to needle sclerophylly, was evaluated by fitting general log-linear models, testing also the heterogeneity of intercepts and slopes between age classes. All the statistical analyses were carried out using the STAT module of SAS® package.
2.3 Shoot growth
During 2009 (from February to December) and 2010 (from February to October), elongation of the main shoot was mon-itored every month in a bigger sample (45 to 60 plants per class). During the elongation phase, the current length of the shoot was expressed by the relative growth with regard to final elongation, minus the length recorded the previous winter. Relative shoot growth was then related to the sum of degree days (dd) (a rectangular daily approximation to the double integral of the temperature curve above a threshold in a time
Table 1 Target freezing temperatures tested in each sampling date. Tested temperatures were the same for each age class within each sampling date Year Month Temperatures tested
−3 −4 −5 −6 −7 −8 −9 −10 −11 −12 −15 −16 −19 −20 −24 −25 −30
2009 June x x x x
July x x x x
September x x x x
October x x x x
November x x x x x
December x x x x x x
2010 March x x x x x x
April x x x x x x
interval (see Mutke et al. (2003) for details) using a double exponential, which considers the left skewness in both time and thermal time scales for the growth pattern:
G X
d0 d
hu !
¼1−e−e −
X hu−b
c ð2Þ
whereGis the accumulative form of shoot growth,Σhu is the daily approximation to thermal integral from starting dated0 to dated,bis the moment of maximum growth andcis the slope parameter. For stone pine stands in inland Spain, the conventional starting dated0for thermal integral computing in phenology studies is February 1. Class differences in shoot growth curve shape were evaluated by testing the homogene-ity of parametersbandc. To do this, parametersbandcin Eq.2were expanded including dummy class variables. Addi-tionally, shoot growth data for a given plant can be considered
a longitudinal series of repeated time observations, so random plot parameters were also included in the model, affecting
Table 2 Results of the general linear mixed model for repeated measured analysis for LT50and REL(T=−12 °C)
Effect LT50 REL(T=−12 °C)
Pvalue F Pvalue F
Fixed Time <0.0001 1,351.30 <0.0001 632.96 Plant class <0.0001 90.17 <0.0001 84.96 Time × plant class <0.0001 14.63 <0.0001 15.98
Pvalue z Pvalue z
Random Plant 0.1733 0.94 0.2585 0.65 Pairwise comparisons Pvalue Pvalue
C3-C1 <0.0001 <0.0001 C3-C2 <0.0001 <0.0001
C1-C2 0.0023 <0.0001
0.1 0.5 0.9
-30 -10
()
C1
C2
C3
REL
(T
:-12ºC)
0.3 0.7
0
LT50 (ºC)
0 10 20
-5 5 15 25 35
Temperature (ºC)
Precipitation (mm)
June 11 July 16 Sept 19 Oct 15 Nov 17 Dec 15 March 3 Ap 16 May 13
RELmax/2
a
b
Fig. 1 aRelative conductivity at−12 °C (REL(T=−12 °C)) and inflection point of the temperature response curve (LT50, degree Celsius) in needles from three plant classes ofP. pinea, between June 2009 and May 2010.b
parameters b and c. The final expression for shoot growth curve is given by
G X
d0 d
hu !
¼1−e−e −
X
hu−ðbþb2D2þb3D3þuÞ
cþc2D2þc3D3þv
ð3Þ
whereD2andD3are dummy variables, whose value equals 1 if the observation comes from classes C2 and C3, respectively, and 0 in the rest of cases, anduandvand are random plant parameters, distributed following a normal bivariate with mean zero and estimable variance-covariance matrix. Under this formulation, the shoot growth curve is given by estimated parametersb+b2andc+c2(class C2),b+b3andc+c3(class C3) andb and c(class C4). Data of each individual shoot growth were used to fit the shoot growth curve (Eq.3) using the NLMIXED procedure in SAS®. Modelling efficiency of the shoot growth curve EF was computed for each age class as 1−SSE/CSS, where SSE is the error sum of squares and CSS is the corrected total sum of squares for the dependent variable.
3 Results
3.1 Climatic conditions in the study site
Following the trends of the previous 20 years, 2009 and 2010 had standard temperature conditions (Fig.1). Daily thermal oscillation was 16–20 °C in the summer and 6–8 °C in late autumn–early winter (December 2009 and January 2010). Winter minimum temperatures fell to−11 °C. Five nights of frost were recorded in mid-October (Fig.1). Daytime temper-atures remained above freezing, with three nights of frost in late November. Maximum mean temperatures were positive all winter, although between December and March, night frosts were recorded on 15 days per month. During April (7 days) and May (4 days), sporadic night frosts of a few degrees below zero were recorded.
3.2 Low-temperature acclimation and relative conductivity: temperature response curves
The general linear mixed model for repeated measured anal-ysis showed significant differences between sampling dates and plant classes in LT50and REL(T=−12 °C)(Table2). This means that the response of the samples to the controlled freezing test was largely dependent on the sampling date and on the plant class. Significant differences were identified between all three classes in both LT50 and REL(T=−12 °C) (Table2). Overall, tolerance to freezing significantly increased
(i.e. lower LT50) from class C1 (2-year-old seedlings, LSmeans=−14.192 °C), class C2 (LSmeans=−14.857 °C) to class C3 (saplings, LSmeans=−16.550 °C). Accordingly, the index of freeze injury at−12 °C (REL(T=−12 °C)) significantly decreased with plant age (LSmeans_C1=0.4846, LSmeans_C2= 0.4106, LSmeans_C3=0.3087). The differences between plant classes for LT50 and REL(T=−12 °C)in each sampling date are shown in Fig.2.
LT50values over the studied period ranged from−7.4 to −27.9 °C. Values for LT50 were between−7.5 and −9.8 °C until September. More rapid hardening occurred in mid-November following a cold period with several night frosts in mid-October. From mid-autumn, injury at the minimum test temperature affected all age classes, LT50decreasing to be-tween−18 and−20 °C by mid-November. LT50values were lowest at the end of winter (−25 °C to−27.8 °C), resulting from a previous 20-day cold period with minimum tempera-tures below zero. LT50 approached their summer values by late May. By April 16, all classes had lost hardiness, concur-rent with high mean temperatures (11.4 °C) and a decrease in the tolerance to freezing (Fig.1). REL(T=−12 °C)values con-firmed that between late October and late April, plants were acclimated to temperatures as low as −12 °C, which is the absolute minimum temperature observed under field condi-tions at the study site (Fig.1). Saplings (class C3) acclimated earlier in the autumn and deacclimated later in spring than seedlings.
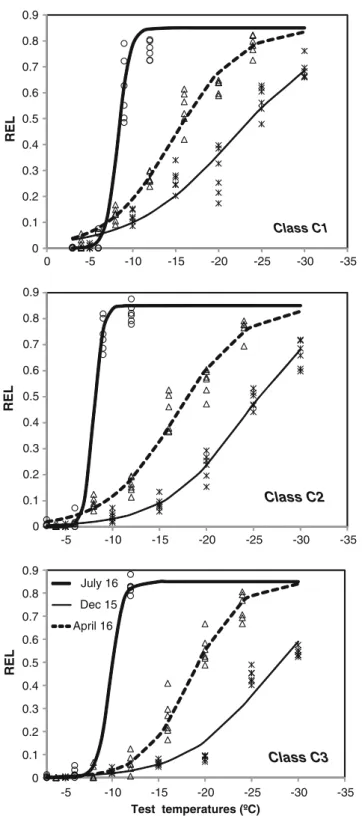
Patterns of acclimation corresponded to those of a tem-perate species, revealing different styles of acclimation between classes (Fig.3). Acclimation resulted in a shift in LT50 to a lower temperature until the end of the winter, while LT50 increased in early spring. The shift in LT50 to lower temperatures was more marked in saplings than in seedlings.
3.3 LMA and relationship with LT tolerance parameters
During the measuring period (June 2009 to May 2010), LMA showed a similar seasonal fluctuation for all classes, i.e. lower values in summer and higher values in winter (Fig. 4). As expected, secondary needles of P. pineasaplings (class C3) showed significantly higher LMA than primary needles of seedlings (classes C1 and C2) over the course of the year, except during the summer months.
3.4 Shoot growth phenology
Shoot growth during 2009 and 2010, expressed in thermal time, exhibited a slow rate during early spring and a maximum close to the end of the elongation period (Fig.6). In compar-ison to 2010, shoot growth in the spring of 2009 was 15 days ahead. Plants displayed different shoot growth curves accord-ing to the class. The non-linear mixed model revealed signif-icant differences between seedlings in class C1 and class C3 for parameters b (P<0.0001) andc (P=0.0425), while no significant differences were shown between plants in classes C2 and C3. Classes C1 and C2 significantly differed in pa-rameterb(P<0.0001) but not in parameterc. Growth (see all parameters in Table4) was always advanced in the youngest
seedlings (class C1) and delayed in saplings (class C3). The moment of maximum growth (parameter b) was recorded between 1,395 degree days in class C1 seedlings (June 12, 2009 and June 22, 2010) and 1,606 degree days in class C3 saplings (June 21, 2009 and July 1, 2010). By the last night frost in 2010 (May 16), only the youngest seedlings had resumed growth.
4 Discussion
In this study we provide experimental evidence of the differ-ences, linked to early developmental changes, in frost toler-ance between age classes of Mediterranean P. pineanatural -30
-25 -20 -15 -10 -5 0
June 11July 16Sept 19 Oct 15 Nov 17 Dec 15March 3 Apr 16 May 13
LT50
Sampling date C1
C2
C3
a a
b a a
a aa
b a
b
c
b b a
b a
c b
a
c b
c a
b c a
0.0 0.1 0.2 0.3 0.4 0.5 0.6 0.7 0.8 0.9 1.0
June 11July 16 Sept 19 Oct 15 Nov 17 Dec 15March 3 Apr 16 May 13
REL
(T=-12ºC)
Sampling date C1
C2
C3
b
c a
b c a
a
b a b
c a a
b a
a
b a
a a a
b b a b
a a
a
b
Fig. 2 Comparison ofaLT50andbREL(T=−12 °C)between the three
regeneration growing under highly continental conditions. Without exploring the different physiological capacities of LT acclimation (i.e. carbohydrates, antifreeze proteins, mem-brane characteristics) and considering the limitations of the
post-freezing electrolyte leakage method to achieve 100 % injury in pine needles (due to the high level of sclerophylly of the needles) as well as the difficulty involved in such trait sampling under natural conditions due to the different life spans of natural regeneration, our experiment confirmed that plant age class had an influence on LT tolerance, with saplings being the most tolerant to frosts. Furthermore, the differences encountered among classes were highly related to shoot onto-genetic heteroblasty, whereas the late frosts recorded during the studied period did not have a clear influence on shoot growth rate.
We have discussed LT tolerance through changes in LT50and REL(T=−12 °C). LT50is defined as the 50 % injury point, for an observed maximum level of cold injury of 0.85. REL(T=−12 °C)is the relative electrolyte leakage measured at the absolute mini-mum temperature observed under field conditions at the study site (−12 °C). This value can be considered a proxy of LT
0 0.1 0.2 0.3 0.4 0.5 0.6 0.7 0.8 0.9
-35 -30 -25 -20 -15 -10 -5 0
Class C1
0.9
0 0.1 0.2 0.3 0.4 0.5 0.6 0.7 0.8
-35 -30 -25 -20 -15 -10 -5
Class C2
0 0.1 0.2 0.3 0.4 0.5 0.6 0.7 0.8 0.9
-35 -30 -25 -20 -15 -10 -5
Test temperatures (ºC)
Class C3
July 16 Dec 15 April 16
REL
REL
REL
Fig. 3 Temperature vs relative electrolyte leakage (REL) before acclima-tion (July 2009), after acclimaacclima-tion (December 2009) and during deacclimation (April 2010), for the threeP. pineaplant classes. Non-linear curves are fitted to the data from six plants for each plant class on each date. Data for each plant class and date is also shown
0.000 0.005 0.010 0.015 0.020 0.025
LMA
Month
class C1 class C2 class C3
(ns) (ns)
(ns)
(***) (*)
(*) (ns) (***) (***)
Fig. 4 Comparison of needle mass per area (LMA, grams per square centimetre) between age classes (n= 6–8 samples per age class, ***P<0.001, **P<0.01, *P<0.05,nsnon-significant)
Table 3 Level of significance and test of homogeneity of slopes for log-linear models to predict LT tolerance parameters (LT50and REL(T=−12 °C)), using LMA as explanatory covariate and plant class as factor. SignificantPvalues are shown in italics
LT50 REL(T=−12 °C)
Source Pvalue F Pvalue F
LMA <0.0001 66.59 <0.0001 37.29
Plant class 0.8057 0.22 0.5984 0.53 LMA × plant class 0.5460 0.62 0.5650 0.59
Test for homogeneity of slopes Pvalue Pvalue
C1-C2 0.6292 0.7759
C2-C3 0.5032 0.4279
tolerance to the most adverse winter conditions in a natural environment.
4.1 Seasonal patterns of LT tolerance and LT acclimation of seedlings and saplings
In the three plant classes, LT50responded similarly to temper-ature, remaining stable or increasing slightly during periods of mild weather and decreasing during hardening (Fig.1). The decrease in LT50 between September 19 and October 15 marked the beginning of the acclimation process for all plant classes. However, saplings (class C3) acclimated more rapidly than seedlings (classes C1 and C2), becoming tolerant to temperatures of at least−12 °C by October. Numerous studies have shown that acclimation is not immediate, as frost
hardiness does not respond immediately to short-term changes in the environment but rather according to a time constant. Thus, it is more related to day length (shorter days) than to climate (e.g. Bigras et al.2001). According to previous studies involving conifers (Lindgren and Nilsson 1992; Repo et al. 2000; Strimbeck et al. 2008), acclimation is related to the latitude and usual date of occurrence of the first freezing temperatures in the regions of origin.
REL(T=−12 °C) remained high during summer until September 19, indicating 100 % cell mortality of needles after slow freezing, prior to acclimation. By October 15, sampled needles of seedlings from classes C1 and C2 were mortally injured when submitted to a temperature of −12 °C, while saplings (class C3) exhibited acclimation to that temperature. All seedlings were acclimated to a temperature of −12 °C between October 15 and April 16, while saplings still showed LT tolerance to−12 °C by May 3. LT50decreased to a range between−18 and−20 °C in mid-November and to−24 and −27 °C in early March, with the saplings (class C3) again showing a higher LT tolerance. The decrease in LT50 in November for all classes (Fig.1) occurred after the first frosts of the year in late October. It seems that night frosts increase LT tolerance in stone pine, as postulated for other temperate species (Silim and Lavender1994; Strimbeck and Schaberg 2009). By late winter, frost hardiness was lost, resulting in decreasing LT tolerance (Thomas and Sporns2009).
Deacclimation in the three stone pine classes had already begun by April, although below zero night temperatures were still recorded on 7 days at the beginning of April and on 4 days until mid-May. The negative effect of late spring frosts on stone pine can change every year, depending on the moment at which shoot growth resumes. It seems that LT hardening and the timing of growth onset are synchronized with seasonal changes in temperature through an array of combinations of environmental factors (Sogaard et al. 2009). As stone pine shoot growth is temperature dependent, the growth function expressed over thermal time (sum of degree days) can be fitted for the weather conditions in each year (Fig.6) (Mutke et al. 2003). According to this function, stone pine shoot growth resumed at different moments in each of the two studied years and was dependent on the age class, arriving earlier in the youngest seedlings. Since shoot elongation is based on the expansion of preformed structures, the date when the maxi-mum growth is reached will be dependent on thermal time; thus, shoot phenology can be several weeks ahead (10 days difference between 2009 and 2010). Such advances in shoot phenology could be very negative if sporadic night frosts in May–June (when shoots are actively growing) occur, this being a common occurrence in stone pine stands in central Spain (Mutke et al. 2012). Interestingly, in our study, late frosts did not have a clear influence on shoot growth rate and did not produce any visible damage to shoots. This can be explained by the fact that in spring 2010, the last night frost
LMA (g.cm-2) -30
0.0 0.2 0.4 0.6 0.8 1.0 1.2
0 0.005 0.01 0.015 0.02
C1
C2
C3 -25
-20
-15
-10
-5
0
0 0.005 0.01 0.015 0.02
LMA (g.cm-2) C1
C2
C3
b
REL
(T:-12ºC)
a
LT
50
Fig. 5 Relationship between needle mass per area (LMA, grams per square centimetre).aInflection point of the temperature response curve (LT50, degree Celsius).bRelative conductivity at−12 °C (REL(T=−12 °C)) in needles from the three plant classes sampled between June 2009 and May 2010. Eachpointrepresents the mean for each measuring date and age class. Eachlinerepresents the antilogarithmic transformation of the fitted log-linear model log(y)=a+b·LMA for each age class. See Table3
occurred when plants were not still actively growing (plants from class C1 had reached only 10 % of total shoot growth, and plants from classes C2 and C3 had just resumed growth).
4.2 Differences between classes: ecological implications
Previous studies have discussed seasonal variations in leaf traits (e.g. Ma et al.2011). Leaf traits are driven by internal constraints of leaf and whole plant (Westoby et al.2002), and they respond to climatic fluctuations much more slowly. Leaf mass per unit area (LMA) was higher in saplings (which bear mature needles) than in seedlings (with mostly juvenile needles). This is consistent with results for other species and probably reflects continuous accumulation and lignification of cell wall materials during needle aging (Han et al.2008).
Our results showed that saplings were significantly more tolerant to freezing injury than young seedlings, which sup-ports previous findings (e.g. Kreyling et al.2013) and is in consonance with a well-established ontogenetic trend in trees (Bannister and Neuner2001). The differences in LT tolerance between classes were closely linked to the observed differ-ences in foliage type (primary vs secondary needles), which in
turn related significantly to differences in their leaf mass per area (Table3, Figs.4and5). In a previous greenhouse exper-iment with 18-month-old stone pine seedlings, primary and secondary needles collected from the same individuals were reported to behave similarly in LT50 (Climent et al. 2009). This similarity in frost tolerance is probably found in the transitional developmental state, that is, when seedlings bear both primary and secondary needles, but not when comparing secondary needles of saplings with primary needles of youn-ger seedlings. It is worthy of note that secondary needles showed a higher resistance to water loss than primary needles, even at the transitional stage (Pardos et al.2009). Thus, our results support the postulation that in the case of stone pine, delayed heteroblastic change may have been favoured by natural selection to enable the construction of drought-resistance foliage (Climent et al. 2011) which is also cold resistant (positive relationship between LT50 and LMA and between REL(T=−12 °C)and LMA).
Late spring frosts during the studied period did not have a clear influence on shoot growth rate. However, the predicted increase in mean temperature for the Iberian Peninsula could lead to significant phenological changes (Mutke et al.2003), 0%
20% 40% 60% 80% 100%
Class C1
Class C2
Class C3
0 340 1170 2630 3920 0 280 960 2420 3680 [dd]
[date]
Fig 6 Predicted relative shoot growth in degree-day scale [dd] and the corresponding date in 2009 and 2010, for seedlings of the three age classes.Circles
represent days when the freeze test was done
Table 4 Average growth parameters in the monitored shoots of 45–60
plants per age class, during 2009 and 2010.bmoment of maximal growth rate;cslope parameter;T0.1,T0.5,T0.9sum of degree days (dd) with 10, 50
and 90 % of total growth, respectively. Dates whenT0.1,T0.5andT0.9were achieved are shown separately for 2009 and 2010
Parameters of the curve Sum of degree days (dd) 2009 2010
b c T0.1 T0.5 T0.9 Date_T0.1 Date_T0.5 Date_T0.9 Date_T0.1 Date_T0.5 Date_T0.9
such that advanced phenology in stone pine may increase the risk of late-frost injury to growing tissues. Thus, although global warming is unlikely to cause the disappearance of sporadic late spring frost events, the advanced onset of growth associated with this warmer world could result in more frost damage due to the lack of acclimation and plant synchrony with the environment. The correlations between the shoot ontogenic changes occurring during the early stages and the effects of phenological shifts in Mediterranean stone pine driven by warmer winters should be investigated in a longer-term experiment to further our understanding of LT acclima-tion and adaptaacclima-tion in this species under future climate change scenarios. Another important issue for further investigation is the adaptive advantage associated with delayed heteroblasty in stone pine.
Acknowledgement We are grateful to the Forest Services of the Junta de Castilla y León (in particular to Ayuntamiento de Portillo) for permis-sion to conduct the field experiment. Thanks to R. Chambel and to the colleagues and technicians who helped us in the lab.
Funding This research was supported by INIA projects RTA2007-00044 and AT2010-007, national project AGL2010-15521 and regional project S2009-AMB1668.
References
Bannister P, Neuner G (2001) Frost resistance and the distribution of conifers. In: Bigras FJ, Colombo SJ (eds) Conifer cold hardiness. Kluwer, Dordrecht, pp 3–21
Bigras FJ, Ryyppö A, Lindström A, Stattin E (2001) Cold acclimation and deacclimation of shoots and roots of conifer seedlings. In: Bigras FJ, Colombo SJ (eds) Conifer cold hardiness. Kluwer, Dordrecht, pp 57–88
Bower AD, Aitken SN (2006) Geographic and seasonal variation in cold hardiness of whitebark pine. Can J For Res 36:1842–1850 Burr KE, Tinus RW, Wallner SJ, King RM (1990) Comparison of three
cold hardiness tests for conifer seedlings. Tree Physiol 6:351–369 Calama R, Mutke S, Gordo JM, Montero G (2008) An empirical
ecolog-ical-type model for predicting stone pine (Pinus pinea L.) cone production in the Northern Plateau (Spain). For Ecol Manag 255 (3/4):660–673
Calama R, Mutke S, Tomé JA, Gordo FJ, Montero G, Tomé M (2011) Modelling spatial and temporal variability in a zero-inflated vari-able: the case of stone pine (Pinus pinea L.) cone production. Ecol Model 222:606–618
Castro-Díez P, Montserrat-Martí G (1998) Phenological patterns of fifteen Mediterranean phanaerophytes fromQuercus ilexcommunities of NE-Spain. Pl Ecol 139:103–112
Climent J, Costa e Silva F, Chambel MR, Pardos M, Almeida MH (2009) Freezing injury in primary and secondary needles of Mediterranean pine species of contrasting ecological niches. Ann For Sci 66:407 Climent J, San-Martín R, Chambel MR, Mutke S (2011) Ontogenetic
differentiation between Mediterranean and Eurasian pines (sect.
Pinus) at the seedling stage. Trees 25:175–186
Costa e Silva F, Shvaleva A, Broetto F, Ortuño MF, Rodrigues ML, Almeida MH, Chaves MM, Pereira JS (2009) Acclimation to short-term low temperatures in twoEucalyptus globulusclones with contrasting drought resistance. Tree Physiol 29:77–86
Darrow HE, Bannister P, Burritt DJ, Jameson PE (2001) The frost resistance of juvenile and adult forms of some heteroblastic New Zealand plants. N Z J Bot 39:355–363
Ensminger I, Hüner NPA, Busch F (2009) Conifer cold hardiness, climate change and the likely effects of warmer temperatures on photosyn-thesis. In: L.V. Gusta, M.E. Wisniewski & K.K. Tanino (eds). Plant cold hardiness. From the laboratory to the field . CAB International, pp. 249–261
Gusta LV, Wisniewski ME, Trischuk RG (2009) Patterns of freezing in plants: the influence of species, environment and experimental procedures. In: L.V. Gusta, M.E. Wisniewski & K.K. Tanino (eds). Plant cold hardiness. From the laboratory to the field. CAB International, pp. 214–225
Han Q, Kawasaki T, Nakano T, Chiba Y (2008) Leaf-age effects on seasonal variability in photosynthetic parameters and its relation-ships with leaf mass per area and leaf nitrogen concentration within aPinus densifloracrown. Tree Physiol 28:551–558
Hannertz M (1994) Damages to Norway spruce (Picea abiesL.) seed-lings caused by a late spring frost. Skogfprst Rep. no. 5
Jones CS (1999) An essay on juvenility, phase change, and heteroblasty in seed plants. Int J Pl Sci, 160(6), S105–S111. Retrieved from <Go to ISI>://000084853500008
Kalcsits L, Silim S, Tanino K (2009) The influence of temperature on dormancy induction and plant survival in woody plants. In: L.V. Gusta, M.E. Wisniewski & K.K. Tanino (eds). Plant cold hardiness. From the laboratory to the field. CAB International, pp 108–118 Klaus W (1989) Mediterranean pines and their history. Pl Syst Evol 162:
133–163
Kreyling J, Wiesenberg GLB, Thiel D et al (2013) Cold hardiness of Pinus nigra Arnold as influenced by geographic origin, warming, and extreme summer drought. Environ Exp Bot 78: 99–108
Lanner RM (1976) Patterns of shoot development in Pinusand their relationship to growth potential. In: Cannell MGR, Last FT (eds) Tree physiology and yield improvement. Academic, London, pp 223–243
Larcher W (2005) Climatic constraints drive the evolution of low temperature resistance in woody plants. J Agric Meteorol 61: 189–202
Lindgren K, Nilsson JE (1992) Cold acclimation ofPinus sylvestrisand
Pinus contortaprovenances as measured by freezing tolerance of detached needles. Scand J For Res 7:309–315
Ma S, Baldocchi DD, Mambelli S, Dawson TE (2011) Are tem-poral variations of leaf traits responsible for seasonal and inter-annual variability in ecosystem CO2 exchange? Funct Ecol 25:258–270
Manso R, Pardos M, Keyes C, Calama R (2012) Modelling the spatio-temporal pattern of primary dispersal in stone pine (Pinus pinea L.) stands in the Northern Plateau (Spain). Ecol Model 226:11–21 Manso R, Fortin M, Calama R, Pardos M (2013) Modelling seed
germi-nation in forest tree species through survival analysis. The Pinus pinea L. case study. For Ecol Manag 289:515–524
Manso R, Pukkala R, Pardos M, Miina J, Calama R (2014) A multi-stage stochastic regeneration model for Pinus pinea L in the Northern Plateau (Spain), Can J For Res. doi: 10.1139/cjfr-2013-0179
Mutke S, Gordo J, Climent J, Gil L (2003) Shoot growth and phenology modelling of grafted Stone pine (Pinus pineaL.) in Inner Spain. Ann For Sci 60:527–537
Mutke S, Gordo J, Gil L (2005) Variability of Mediterranean stone pine cone production: yield loss as a response to climate change. Agric For Meteor 132:263–272
Palacio S, Milla R, Montserrat G (2005) A phenological hypothesis on the thermophilous distribution ofPistacia lentiscusL. Flora 200: 527–534
Pardos M, Calama R, Climent J (2009) Difference in cuticular transpiration and sclerophylly in juvenile and adult pine needles relates to the species-specific rates of development. Trees 23:501–508
Pardos M, Puértolas J, Madrigal G, Garriga E, de Blas S, Calama R (2010) Seasonal changes in the physiological activity of regenera-tion under a natural light gradient in aPinus pinearegular stand. For Syst 19:367–380
Puértolas J, Gil L, Pardos JA (2005) Effects of nitrogen fertilization and temperature on frost hardiness of Aleppo pine (Pinus halepensisMill.) seedlings assessed by chlorophyll fluorescence. Forestry 78:501–511 Ratkowsky DA (1990) Handbook of nonlinear regression models. Marcel
Dekker, New York, 241 pp
Repo T, Zhang G, Ryyppö A, Rikala R, Vuorinen M (2000) The relation between growth cessation and frost hardening in Scots pine of different origins. Trees 14:456–464
Sakai A (1983) Comparative study on freezing resistance of conifers with special reference to cold adaptation and its evolutive aspects. Can J Bot 61:2323–2332
Silim SN, Lavender DP (1994) Seasonal patterns and environmental regulation of frost hardiness in shoots of seedlings ofThuja plicata,
Chamaecyparis nootkatensisandPicea glauca. Can J For Bot 72: 309–316
Sogaard G, Granhus A, Johnsen O (2009) Effect of frost nights and day and night temperature during dormancy induction on frost hardi-ness, tolerance to cold storage and bud burst in seedlings of Norway spruce. Trees 23:1295–1307
Strimbeck GR, Schaberg PG (2009) Going to extremes: low-temperature tolerance and acclimation in temperate and bore-al conifers. In: Gusta L., Wisniewski M and Tanino K (eds.) Plant cold hardiness: from the laboratory to the field. CAB International, pp 227–239
Strimbeck GR, Kjellsen TD, Schaberg PG, Murakami PF (2007) Cold in the common garden: comparative low-temperature tolerance of boreal and temperate conifer foliage. Trees 21:557–567
Strimbeck GR, Kjellsen TD, Schaberg PG, Murakami PF (2008) Dynamics of low-temperature acclimation in temperate and boreal conifer foliage in a mild winter climate. Tree Physiol 28:1365–1374
Thomas F, Sporns K (2009) Frost sensitivity of Fagus sylvatica
and co-occurring deciduous tree species at exposed sites. Flora 204:74–81
Westoby M, Falster DS, Moles AT, Vesk PA, Wright IJ (2002) Plant ecological strategies: some leading dimensions of variation between species. Ann Rev Ecol Syst 33:125–159
Winn AA (1999) The functional significance and fitness consequences of heterophylly. Int J Plant Sci 160:S113–S121