Rev Inves Clin. 2017;69:319-328 ORIGINAL ARTICLE
Distinguish ing Intracerebral Hemorrhage
from Acute Cerebral Infarction through
Metabolomics
Xuxin Zhang
1*, Yanzhao Li
1, Yan Liang
1, Pitong Sun
1, Xue Wu
2,3, Jinhui Song
1, Xiaoyu Sun
2,3,
Mo Hong
2,3, Peng Gao
2,4,5and Dongfeng Deng
1*
1Department of Neurosurgery, Affiliated Zhongshan Hospital of Dalian University, Dalian, Liaoning; 2Key Laborotary of
Liaoning Tumor Clinical Metabolomics (KLLTCM), the First Affiliated Hospital of Liaoning Medical University, JinZhou, Liaoning; 3RSKT Biopharma Inc., Jinzhou 121000, Liaoning; 4Department of SICU, Affiliated Zhongshan Hospital of Dalian
University, Dalian, Liaoning; 5Department of Biotechnology, Dalian Institute of Chemical Physics, Chinese Academy
of Sciences, Dalian, Liaoning; 6Department of Translational Medicine Center, Clinical Laboratory, Dalian Sixth People’s
Hospital, Dalian, Liaoning, China
ABSTRACT
Background: Acute cerebral infarction (ACI) and intracerebral hemorrhage (ICH) are potentially lethal cerebrovascular diseases that seriously impact public health. ACI and ICH share several common clinical manifestations but have totally divergent therapeutic strategies. A poor diagnosis can affect stroke treatment. Objective: To screen for biomarkers to differentiate ICH from ACI, we enrolled 129 ACI and 128 ICH patients and 65 healthy individuals as controls. Methods: Patients with stroke were diagnosed by computed tomography/magnetic resonance imaging, and their blood samples were obtained by fingertip puncture within 2-12 h after stroke initiation. We compared changes in metabolites between ACI and ICH using dried blood spot-based direct infusion mass spectrometry technology for differentiating ICH from ACI. Results: Through multivariate statistical approaches, 11 biomarkers including 3-hydroxylbutyrylcarnitine, glutarylcarnitine (C5DC), myristoylcarnitine, 3-hydroxypalmitoylcarnitine, tyrosine/citrulline (Cit), valine/phenylalanine, C5DC/3-hydroxyisovalerylcarnitine, C5DC/palmitoylcarnitine, hydroxystearoylcarnitine, ratio of sum of C0, C2, C3, C16, and C18:1 to Cit, and propionylcarnitine/methionine were screened. An artificial neural network model was constructed based on these parameters. A training set was evaluated by cross-validation method. The accuracy of this model was checked by an external test set showing a sensitivity of 0.8400 (95% confidence interval [CI], 0.7394-0.9406) and specificity of 0.7692 (95% CI, 0.6536-0.8848). Conclusion: This study confirmed that metabolomic analysis is a promising tool for rapid and timely stroke differentiation and prediction based on differential metabolites.
Key words: Acute cerebral infarction. Artificial neural network. Intracerebral hemorrhage. Mass spectrometry. Metabolomics.
Corresponding author:
*Xuxin Zhang
Department of Neurosurgery
Affiliated Zhongshan Hospital of Dalian University Dalian, Liaoning, China
E-mail: 13842623672@163.com *Dongfeng Deng
Department of Neurosurgery
Affiliated Zhongshan Hospital of Dalian University Dalian, Liaoning, China
E-mail: dongfengdeng12@163.com
INTRODUCTION
Stroke is a cerebrovascular disease that has become the major leading cause of death in adults world-wide1,2. While stroke morbidity decreased in developed
countries due to interventions during the hyperacute stage of stroke, disease morbidity has continued to increase in developing nations3. Stroke has become a
heavy burden for the patient’s family.
Basically, stroke can be categorized into ischemic and hemorrhagic stroke. Acute cerebral infarction (ACI) is an ischemic stroke with a high incidence, mortal-ity, and recurrence rate4 and constitutes about 70%
of all types of stroke5. Hemorrhagic stroke is
repre-sented by intracerebral hemorrhage (ICH), which is an exceptionally devastating form of stroke that always induces severe disability and mortality6. In nearly all
cases of both subtypes of stroke, there is a sudden onset without a specific aura, and the two diseases share several common clinical manifestations, such as hemiplegia, aphasia, and other neurological deficits, whereas their therapies are totally divergent. Even the treatment itself can transform ischemic stroke into hemorrhagic stroke7,8. Hence, it is crucial to distinguish
ICH from ACI due to substantial differences in patho-genesis, treatment, and prognosis. Diagnosis of the two-stroke subtypes is not straightforward and is still limited. Although image-based strategies including computed tomography (CT) and magnetic resonance imaging (MRI) can be used to diagnose stroke, and achieve a relatively accurate diagnosis, they are costly, time-consuming and -dependent, complicated, not universally available and are restricted for the diag-nosis of certain subtypes of stroke. Thus, extensive research has been focused on the study of blood bio-markers for the diagnosis and prognosis of stroke9,10.
Many small-molecule metabolites are changed by spe-cific physiological or pathological status. The newly emerging metabolomic technologies can quantita-tively describe the low molecular weight metabolites, examine the changed metabolite pattern s from a whole set of metabolites in a specific system (body fluids or tissue) for the early diagnosis and detection of many diseases11, and provide new insights into the
regulation of metabolic homeostasis in healthy and ill individuals. Metabolomic technologies have been widely used in biomarker discovery, disease stratifica-tion, and drug toxicity evaluation. Mass spectrometry
(MS) and nuclear magnetic resonance (NMR) spectros-copy are the prevailing analytical techniques applied in metabolomics and have been used in stroke research. NMR-based metabolic profiles of plasma and urine have been investigated in stroke patients showing increased levels of lactate, pyruvate, glycolate, and formate, and decreased levels of glutamine and methanol in plasma; in addition, decreased levels of citrate, hippurate, and gly-cine were found in the urine of these stroke patients10.
Chromatography-MS, as one of the prevailing metabo-lomics detecting technologies, has been applied in the diagnosis of cerebral infarction, and a series of endog-enous metabolites in one-carbon cycle, such as folic acid, cysteine, S-adenosyl homocysteine, and oxidized glutathione, have been identified as potential biomark-ers of cerebral infarction12. The metabolomic
exper-iments using MS platforms have become an integral part of clinical and systems biology research. To satisfy the requirement of rapid stroke diagnosis in the clinical setting, direct infusion MS technology was used in this study. The dried blood spot (DBS ) sample technique has been applied in various fields, such as targeted blood metabolite analysis and newborn screening13,14. The
profilings of amino acid and carnitine/acylcarnitine in DBS samples have been devoted to disease research15.
In this study, the DBS-based metabolomic study was performed by direct infusion MS analysis in samples of stroke patients and healthy individuals, aimed at rapidly differentiating ICH from ACI. Samples were tested for the different metabolites in ACI and ICH patients com-pared with healthy individuals based on the differential profiling of amino acid and carnitine/acylcarnitine.
MATERIALS AND METHODS
Subjects and samples
patients and healthy individuals were 58.14 (28-76), 58.04 (33-75), and 55.68 (39-82) years, respectively. There were no age (p= 0.06, Kruskal–Wallis rank sum test) or gender (p = 0.89, Fisher’s exact test) differences between the three groups. This study was conducted following the guidelines of the Ethics Committee of the Affiliated Zhongshan Hospital of Dalian University, and all the participants or their proxies signed informed consent forms. DBS samples were obtained by fingertip puncture within 2-12 h after stroke initiation; in healthy individuals, DBS samples were taken on enrollment. Eighty percent of the metabolomic data for ACI and ICH patients was randomly selected as a training set to establish a diagnosis model. There were 103 cases with ACI in the training set. The ICH in the training set was composed of 80% basal ganglia hemorrhage (61 patients), thalamic hemorrhage (25 patients), and cerebral lobar hemorrhage (17 patients) samples. The remaining 20% of samples from ACI and ICH were used to verify the applicability of the established model.
Laboratory procedures
Chemicals
High-performance liquid chromatography grade ace-tonitrile and high-purity water were acquired from Thermo Fisher ( Waltham, MA). 1-Butanol and ace-tyl chloride were purchased from Sigma-Aldrich (St. Louis, MO). The isotope-labeled internal standards for 12 amino acids (catalog number: NSK-A) and 8 acyl-carnitines (catalog number: NSK-B) for the purpose of absolute quantification were acquired from Cambridge Isotope Laboratories (Tewksbury, MA). These isotope standards were mixed into 2 mL pure methanol and stored at 4°C. Metabolite extraction was performed through 100-fold dilution to obtain a working solution. Amino acid and carnitine quality control (QC) stan-dards were obtained from Chromsystems (Grafelfing, Germany). The QC samples were inserted into the real samples to ensure analysis stability.
Sample preparation
A 3-mm diameter disc was punched from DBS paper. Discs were placed into Millipore MultiScreen HV 96-well plates (Millipore, Billerica, MA, USA) to extract metabolites. The detailed sample preparation
processes including QC and real sample preparations were referred to in a previous report16.
Metabolomic analysis
Direct-injection MS analysis was performed using the AB SCIEX 4000 QTrap system (Framingham, MA) with electrospray ionization source. Analytes were scanned under positive mode, and scan parameters were set as previously reported16. The injected sample was 20 μL.
Eighty percent acetonitrile aqueous solution was used as the mobile phase. The initial flow rate was set to 0.2 mL/ min and then reduced to 0.01 mL/min within 0.08 min. This flow rate was kept stable during 1.5 min, subse-quently increased to 0.2 mL/min within 0.01 min, and remained constant for 0.5 min. The voltage for ion spray was 4.5 kV. The curtain gas pressure was 20 psi. The pressure for ion source gas 1 and gas 2 was set to 35 psi. The temperature of the auxiliary gas was set to 350°C.
Statistical analysis
The system’s control and data collection were performed using Analyst v1.6.0 software (AB Sciex). Data prepro-cessing was executed with ChemoView 2.0.2 (AB Sciex). Significant analysis of microarrays (SAM) was employed for screening differential metabolites. Shapiro–Wilk test was used to check the normality of variables for stroke patients and healthy individuals. ANOVA test was per-formed to evaluate the differentiation across various ICH types. The differences between stroke (ACI and ICH) and healthy groups and between ACI and ICH were assessed by t-test. For the non-parametric variables, Mann–Whitney test and Kruskal–Wallis rank sum test were used for the difference evaluation. False discovery rate (FDR) was used for adjusting p values for multiple hypothesis testing based on Benjamini–Hochberg cor-rection method17. The step-wise regression analysis was
used for further screening of parameters.
Artificial
neural network (ANN) system
algorithm was executed to build a model based on a train-ing set data, and the model was evaluated by a leave-one-out cross-validation (LOO-CV) method18. Four indices
were utilized to evaluate the prediction model, including sensitivity, specificity, and accuracy. The accuracy of ANN classifier was further validated via the testing set. Statistical analysis was performed with R v3.3.1 software.
RESULTS
Metabolomic differences between the
stroke groups and healthy individuals
ACI and ICH were in separate compared to the healthy group to detect differentially changed metabolites
between ACI and the healthy group, and ICH and the healthy group, through the SAM method; SAM results are shown in figures S1 and S2, respectively. We per-formed further screening of these significantly changed metabolites through further calculations and correction of the p values between stroke (ACI and ICH groups) and healthy individuals. We found that 44 parameters showed different levels between ACI and the healthy group (Table S1), where 13 metabolites had increased levels in the ACI group compared to the control group. With respect to ICH compared to the healthy group, we found different levels in 45 parameters (Table S2), with levels of 13 metabolites increased in the ICH group com-pared to the control group. These metabolites screened out by FDR were used as inputs to the forward-back-ward step-wise regression analysis for further feature
selection through R package MASS to differentiate ACI and ICH from the healthy group. Ultimately, 11 param-eters were significantly different between ACI and the healthy group, including behenic carnitine (C22); isovalerylcarnitine (C5); C3DC, butyrylcarnitine; glu-tarylcarnitine (C5DC)/3-hydroxyisovalerylcarnitine (C5-OH); C3DC/decanoylcarnitine (C10); C14:2; C10:2; ratio of sum of C0, C2, C3, C16, and C18:1 to citrulline [(0+2+3+16+18:1)/Cit]; arginine (Arg); and proline (Pro), where the levels of C5, C3DC/C10, and Arg were increased in ACI patients compared to the healthy group (Fig. 1). Furthermore, when comparing the ICH group to the control group, 12 parameters were significantly different, including 3-hydroxypal-mitoylcarnitine (C16-OH)/pal3-hydroxypal-mitoylcarnitine (C16), 3-hydroxypalmitoleylcarnitine (C16:1-OH), C10, C5/propionylcarnitine (C3), lauroylcarnitine (C12),
octadecanoylcarnitine (C18), oleylcarnitine (C18:1), succinyl-/methylmalonylcarnitine, valine (Val)/phenyl-alanine (Phe), C16, Arg, and threonine (Thr); among them, the levels of 3 parameters (C16-OH/C16, C5/ C3, and Arg) were increased in the ICH group com-pared to the healthy group (Fig. 2). These results show that the affected metabolites were almost different in ACI and ICH, especially for the carnitine-related metab-olites, which suggest that the pathological progression of ACI and ICH may be different.
Metabolomic analysis for ACI and ICH
groups
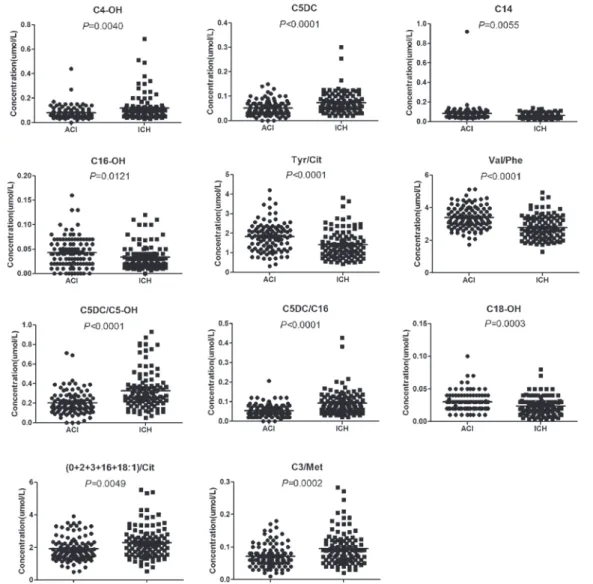
To further explore the discrepancy between ACI and ICH, we also performed a metabolomic analysis for the
two groups, finding that this method could distinguish ICH from the ACI group. First, SAM screening (Fig. 3) was integrated with the p value calculation and FDR correction to differentiate ICH from ACI. Ultimately, 37 significantly differentiated metabolites were screened out (Table 1), where 15 of these metabolites were increased in the ICH group compared to the ACI group. Second, these selected metabolites were subjected to step-wise regression for further screening of differenti-ated metabolites. Finally, 11 significantly differentidifferenti-ated metabolites were selected to build a prediction model, including 3-hydroxylbutyrylcarnitine (C4-OH), C5DC, myristoylcarnitine (C14), C16-OH, tyrosine (Tyr)/Cit, Val/Phe, C5DC/C5-OH, C5DC/C16, hydroxystearoyl-carnitine (C18-OH), (0+2+3+16+18:1)/Cit, and C3/ methionine (Met) (Fig. 4). The levels of C4-OH, C5DC, C5DC/C5-OH, C5DC/C16, (0+2+3+16+18:1)/Cit, and C3/Met were elevated in the ICH group com-pared to the ACI group. By contrast, the levels of C14, C16-OH, Tyr/Cit, Val/Phe, and C18-OH were decreased in the ICH group.
Sample classification using ANN algorithm
The 11 significantly differentiated metabolites were selected as predictors through step-wise regression for differentiating ACI from ICH. Subsequently, the ANN model was built based on these differentiated metab-olites, and the accuracy of this model was checked. For the training, LOO-CV of training, and testing sets, 26 (13 ACI and 13 ICH), 44 (21 ACI and 23 ICH), and 12 (8 ACI and 4 ICH) cases, respectively, were incor-rectly classified by the ANN algorithm. The accuracy of this classifier was higher than 0.7 (Table 2), and for dis-tinguishing ICH from ACI, the accuracies were 0.8738, 0.7864, and 0.7647 in the training, LOO-CV of training, and testing sets, respectively. In addition, the accura-cies of differentiating ICH with different sites of bleed-ing from ACI were all higher than 0.8594 in the train-ing set, indicattrain-ing the acceptability of the ANN model. The training set was further tested by the LOO-CV method, with an accuracy of higher than 0.7734, and the external validation for the testing set was shown with an accuracy of higher than 0.7073. For the train-ing, LOO-CV of traintrain-ing, and testing sets, the receiver operating characteristic (ROC) curve analysis was also performed to examine the diagnosis ability of the ANN model (Fig. 5a-c). In additional, the differentiation of basal ganglia hemorrhage, thalamic hemorrhage, and
cerebral lobar hemorrhage with ACI was also examined by ROC curve analysis (Fig. 5a-c). The results of the sensitivity and specificity in the training set were higher than 0.8 for distinguishing ICH, basal ganglia hemor-rhage, thalamic hemorhemor-rhage, and cerebral lobar hem-orrhage from ACI (Table 2), which implied the accept-ability of the ANN model for clinical application. The training set was further tested by the LOO-CV method, and the sensitivity and specificity values were all higher than 0.7600. The external validation was implemented for the testing set, and the sensitivity and specificity values were all higher than 0.7333.
DISCUSSION
Stroke is a major public health problem with a poor prognosis. The changes in metabolite levels in biofluids are regarded to be in accord with the metabolic alter-ations in the brain19. Using DBS-based metabolomic
assay coupled with multivariate statistics analysis, we found that several metabolites including amino acids, acylcarnitines, or their ratios were altered among ACI, ICH, and healthy individuals. These changed metab-olites not only reflected the systemic deregulation during the course of ACI or ICH but also represented the metabolic status in the brain20,21. In addition, these
changed metabolites could also be used in the predic-tion, diagnosis, or prognosis of stroke.
Amino acids as the substrates of protein synthesis are essential to human function. Metabolomic inves-tigations have shown abnormalities of amino acid metabolism in stroke development10,22. The supervised
method we describe here was performed to study the differences in changed metabolites between ACI and ICH patients and healthy individuals. The results revealed that the level of Arg was elevated in both ACI and ICH patients. The level of this amino acid has been found increased in acute ischemic stroke patients and showed a positive correlation with the risk factors for acute ischemic stroke23. Arginase and nitric oxide
synthase (NOS ) competed for the common substrate
Arg. The significant effects of arginase on circula-tion implied the potential role of this enzyme to reg-ulate vascular function24. It is worth noting that the
increased arginase leads to arginase/NOS imbalance and reduces NO production, thus generating endothe-lial dysfunction, and may also influence the utilization of the substrate Arg25,26. In addition, we found that
prometabolism was abnormal in ACI patients, which was consistent with the previous reports demon-strating that Pro was markedly reduced in acute isch-emic stroke patients27,28, and showed a connection to
blood stasis in coronary heart disease29. Phenylalanine
hydroxylase (PAH) could catalyze the hydroxylation
Table 1. Differential parameters between ACI and ICH groups after SAM screening and FDR correction.
No. Parameters ACI (mean ± SD) ICH (mean ± SD) Status p value FDR
1 C5DC/C16 0.0542 ± 0.0317 0.0931 ± 0.0619 ↑ 0.0000 0.0000
2 Phe/Tyr 0.7554 ± 0.4044 1.0604 ± 0.3639 ↑ 0.0000 0.0000
3 C5DC/C5-OH 0.2018 ± 0.1196 0.3282 ± 0.1937 ↑ 0.0000 0.0000
4 C5DC/C8 0.8563 ± 0.4976 1.4292 ± 1.0531 ↑ 0.0000 0.0000
5 C3/C16 1.3953 ± 0.6330 1.9119 ± 0.9395 ↑ 0.0000 0.0001
6 C5DC 0.0509 ± 0.0297 0.0732 ± 0.0425 ↑ 0.0000 0.0001
7 C2/C0 0.3181 ± 0.1285 0.4247 ± 0.2214 ↑ 0.0001 0.0004
8 C3DC 0.0831 ± 0.0561 0.1135 ± 0.1100 ↑ 0.0001 0.0006
9 C3/Met 0.0714 ± 0.0348 0.0956 ± 0.0507 ↑ 0.0002 0.0012
10 C26/C20 0.7480 ± 0.2994 1.0323 ± 0.6491 ↑ 0.0012 0.0061
11 C2 10.0578 ± 4.0909 12.5465 ± 5.7029 ↑ 0.0013 0.0065
12 C3/C0 0.0413 ± 0.0187 0.0529 ± 0.0326 ↑ 0.0037 0.0145
13 C4-OH 0.0810 ± 0.0524 0.1174 ± 0.1046 ↑ 0.0040 0.0148
14 (0+2 + 3+16+18:1)/Cit 1.9198 ± 0.7236 2.2929 ± 0.9723 ↑ 0.0049 0.0166
15 Arg/Orn 0.4853 ± 0.4348 0.6374 ± 0.4459 ↑ 0.0051 0.0166
16 Val/Phe 3.3963 ± 0.6886 2.7791 ± 0.7313 ↓ 0.0000 0.0000
17 C18:1-OH 0.0365 ± 0.0170 0.0268 ± 0.1516 ↓ 0.0000 0.0000
18 Tyr/Cit 1.8249 ± 0.7262 1.4139 ± 0.7044 ↓ 0.0000 0.0001
19 Met/Phe 0.4410 ± 0.1078 0.3738 ± 0.1169 ↓ 0.0000 0.0004
20 C5/C2 0.0204 ± 0.0130 0.0148 ± 0.0086 ↓ 0.0001 0.0006
21 C18-OH 0.0301 ± 0.0145 0.0238 ± 0.0140 ↓ 0.0003 0.0021
22 Val 153.4299 ± 41.6956 133.8167 ± 42.1753 ↓ 0.0010 0.0055
23 Thr 30.4741 ± 11.7428 25.2498 ± 10.2961 ↓ 0.0010 0.0055
24 Orn 68.2662 ± 55.7599 48.6449 ± 53.4322 ↓ 0.0015 0.0071
25 Lys 168.7855 ± 80.0643 136.9643 ± 87.2784 ↓ 0.0018 0.0078
26 Leu 138.2196 ± 43.4851 120.8855 ± 52.8319 ↓ 0.0018 0.0078
27 C5/C3 0.1527 ± 0.0918 0.1147 ± 0.0521 ↓ 0.0024 0.0098
28 C16 0.9833 ± 0.3325 0.8594 ± 0.3088 ↓ 0.0048 0.0166
29 C20 0.0503 ± 0.0187 0.0433 ± 0.0225 ↓ 0.0052 0.0166
30 C14 0.0832 ± 0.0879 0.0642 ± 0.0242 ↓ 0.0055 0.0166
31 Cit/Arg 2.4253±1.7677 1.9476 ± 1.7663 ↓ 0.0059 0.0172
32 C10:1 0.13912 ± 0.1149 0.1019 ± 0.0657 ↓ 0.0064 0.0181
33 C8/C2 0.0081 ± 0.0065 0.0059 ± 0.0053 ↓ 0.0054 0.0166
34 C18:2 1.9413 ± 0.6619 1.7459 ± 0.7187 ↓ 0.0111 0.0303
35 C16-OH 0.0431 ± 0.0310 0.0336 ± 0.0251 ↓ 0.0121 0.0313
36 Cit 25.9877 ± 10.407 23.4265 ± 12.0841 ↓ 0.0125 0.0313
37 Met 20.3045 ± 6.5841 18.0685 ± 7.0254 ↓ 0.0125 0.0313
ACI: acute cerebral infarction; ICH: intracerebral hemorrhage; SAM: significant analysis of microarrays; FDR: false discovery rate; SD: standard deviation; Tyr: tyrosine; Cit: citrulline; Val: valine; Phe: phenylalanine; Met: methionine; Arg: arginine; Thr: threonine; C0: free carnitine; C2: acetylcarnitine; C3: propionylcarnitine; C4-OH: 3-hydroxylbutyrylcarnitine; C5: cisovalerylcarnitine; C5DC: glutarylcarnitine; C5-OH: 3-hydroxyisovalerylcarnitine; C14: myristoylcarnitine; C16: palmitoylcarnitine;
of aromatic side-chain of Phe and produce Tyr. The stroke-associated oxidative stress may decrease PAH after stroke occurred, which could induce the accu-mulation of Phe, leading to the decrease of the ratio Val/Phe in ICH patients. Val, as one of the branched-chain amino acids (BCAA), can influence brain func-tion through energy producfunc-tion and neurotransmitter synthesis30. Furthermore, BCAAs were found to be
decreased in several diseases, such as sepsis, brain injury, and heart diseases22,31. The decreased value of
Val/Phe radio was probably not only influenced by the changed level of Phe, but also by the decreased level of Val in ICH patients. Thr was significantly decreased in ICH patients, and this result was consistent with a previous report28. Thr can be converted to pyruvate
by glycolysis for energy supply. The reduction of Thr
levels may impact its utilization and further affect brain function28.
We found that metabolites such as carnitine and some acetylcarnitine (C2) were markedly altered in stroke patients. During lipid catabolism, carnitine transports fatty acids into the mitochondria for converting fat into energy. C2 is synthesized by transferring an acetyl group to carnitine, and this reaction facilitates its cross-ing of the blood–brain barrier. The levels of two long-chain acylcarnitines (C14:2 and C22) were decreased in ACI patients, while the levels of more long-chain acylcarnitines declined in ICH patients, including C12, C16, C18, C18:1, and C16:1-OH. It has been found that the decreased carnitine-palmitoyltransferase1 (CPT1) is accompanied by the decrease of acylcarnitines,
especially for the long-chain acylcarnitines, in the heart of cyclophilin D−/− mice32. CPT1 is located on the outer
mitochondrial membrane and is responsible for the transference of the acyl group from cytosolic acyl-CoA to carnitine to generate acylcarnitine. In addition, carni-tine-palmitoyltransferase2 (CPT2), on the inner mito-chondrial membrane, is used to transfer the acyl group to free CoA to obtain free carnitine. Through these processes, acyl-CoA is transferred into the mitochon-dria to conduct β-oxidation32. Therefore, the decreased
level or activity of CPT1 can reduce β-oxidation and the levels of long-chain acylcarnitines. In this study, for ICH patients, the decreased levels of long-chain acylcarni-tines may be owing to the decreased level or activity of CPT1 enzyme, and the decreased CPT1 could further reduce the oxidation of fatty acids.
It is not surprising that combinational metabolites were needed in this study to differentiate stroke types due to the complexity of the neurobiological mechanisms of stroke. Through multiple screening processes, C4-OH, C5DC, C14, C16-OH, Tyr/Cit, Val/Phe, C5DC/C5-OH, C5DC/C16, C18-OH, (0+2+3+16+18:1)/Cit, and C3/ Met were selected to be potential biomarkers to build the ANN model for distinguishing ICH from ACI. This model could not only precisely predict the diagnosis in 87.38% of 206 patients in the training set, but also distinguish ICH patients with different sites of bleeding from ACI patients. Compared to the traditional imaging tools and biochem-ical analyses, these potential biomarkers selected from metabolomic detection and analysis are faster to obtain and less invasive, have higher sensitivity and specificity, and show potential to expand their application.
Table 2. Sensitivity, specificity, and accuracy values for distinguishing ICH, and ICH with different sites of bleeding from ACI from the training set, LOO-CV of training set, and testing set.
Model Sensitivity (95%CI) Specificity (95%CI) Accuracy
Training
ICHa 0.8738 (0.8285-0.9191) 0.8738 (0.8285-0.9191) 0.8738
Basal ganglia hemorrhage 0.9016 (0.8560-0.9472) 0.8738 (0.8230-0.9246) 0.8841
Thalamic hemorrhage 0.8000 (0.7307-0.8693) 0.8738 (0.8163-0.9313) 0.8594
Cerebral lobar hemorrhage 0.8824 (0.8248-0.9400) 0.8738 (0.8144-0.9332) 0.8750
Training (LOO)
ICHa 0.8252 (0.7733-0.8771) 0.7864 (0.7304-0.8424) 0.7864
Basal ganglia hemorrhage 0.8525 (0.7982-0.9068) 0.7864 (0.7237-0.8491) 0.7988
Thalamic hemorrhage 0.7600 (0.6860-0.8340) 0.7864 (0.7154-0.8574) 0.7734
Cerebral lobar hemorrhage 0.8235 (0.7553-0.8917) 0.8447 (0.7799-0.9095) 0.8000
Testing
ICHa 0.8400 (0.7394-0.9406) 0.7692 (0.6536-0.8848) 0.7647
Basal ganglia hemorrhage 0.7333 (0.5979-0.8687) 0.7692 (0.6402-0.8982) 0.7073
Thalamic hemorrhage 1.0000 (0.5168-1.0000) 0.7692 (0.6232-0.9152) 0.7500
Cerebral lobar hemorrhage 1.0000 (0.3958-1.0000) 0.7692 (0.6184-0.9200) 0.7333
ACI: acute cerebral infarction; ICH: intracerebral hemorrhage; LOO-CV: leave-one-out cross-validation; CI: confidence interval
aICH group was composed of the patients with basal ganglia hemorrhage, thalamic hemorrhage, and cerebral lobar hemorrhage
Figure 5. Receiver operating characteristic (ROC) curve based on artificial neural network model of training set (a), Leave-one-out cross-validation of training set (b), and testing set (c). The cases of intracerebral hemorrhage used for building ROC curve included basal ganglia hemorrhage, thalamic hemorrhage, and cerebral lobar hemorrhage patients.
C B
In this study, we discovered novel effective biomarkers by DBS-based MS metabolomic analysis to differenti-ate ICH from ACI, and these biomarkers could even dis-tinguish ICH with different sites of bleeding from ACI through probing changed metabolites. The LOO-CV method was used to verify the training set, and opti-mization of potential biomarkers was validated by a test set. The ANN prognosis model built by selecting 11 biomarkers provided a new rapid and sensitive strat-egy for differentiating ICH from ACI. Nevertheless, the limited sample size of this study affects the prediction accuracy. In the following study, we will recruit more participants to increase the current sample, verify the findings of this study, and confirm the value of these 11 metabolites as clinical biomarkers.
ACKNOWLEDGMENTS
This study was supported by the National Natural Science Foundation of China (81672498).
Supplementary data
Supplementary data are available at Revista de Investigació n Clí nica online (www.clinicalandtransla-tionalinvestigation.com). These data are provided by the corresponding author and published online for the benefit of the reader. The contents of supplementary data are the sole responsibility of the authors.
REFERENCES
1. Towfighi A, Saver JL. Stroke declines from third to fourth leading cause of death in the United States: Historical perspective and challenges ahead. Stroke. 2011;42:2351-5.
2. O’Donnell MJ, Xavier D, Liu L, et al. Risk factors for ischaemic and intracerebral haemorrhagic stroke in 22 countries (the INTERSTROKE study): A case-control study. Lancet. 2010; 376:112-23.
3. Hu SL, Feng H, Xi GH. Hyperbaric oxygen therapy and precon-ditioning for ischemic and hemorrhagic stroke. Med Gas Res. 2016;6:232-6.
4. van der Worp HB, van Gijn J. Clinical practice. Acute ischemic stroke. N Engl J Med. 2007;357:572-9.
5. Luo J. New progress on treating acute cerebral infarction. Pract J Cardiac Cereb Pneumal Vasc Dis. 2010;18:825-9.
6. Keep RF, Hua Y, Xi G. Intracerebral haemorrhage: Mechanisms of injury and therapeutic targets. Lancet Neurol. 2012;11:720-31. 7. Zhang J, Yang Y, Sun H, Xing Y. Hemorrhagic transformation
after cerebral infarction: Current concepts and challenges. Ann Transl Med. 2014;2:81.
8. Martinez B, Peplow PV. Blood microRNAs as potential diagnostic markers for hemorrhagic stroke. Neural Regen Res. 2017; 12:13-18.
9. Graham GD, Blamire AM, Howseman AM, et al. Proton magnetic resonance spectroscopy of cerebral lactate and other metabo-lites in stroke patients. Stroke. 1992;23:333-40.
10. Jung JY, Lee HS, Kang DG, et al. 1H-NMR-based metabolomics study of cerebral infarction. Stroke. 2011;42:1282-8.
11. Gowda GA, Zhang S, Gu H, et al. Metabolomics-based methods for early disease diagnostics. Expert Rev Mol Diagn. 2008;8:617-33. 12. Jiang Z, Sun J, Liang Q, et al. A metabonomic approach applied
to predict patients with cerebral infarction. Talanta. 2011; 84:298-304.
13. Shah NM, Hawwa AF, Millership JS, Collier PS, McElnay JC. A sim-ple bioanalytical method for the quantification of antiepileptic drugs in dried blood spots. J Chromatogr B Analyt Technol Biomed Life Sci. 2013;923:65-73.
14. Therrell BL, Adams J. Newborn screening in North America. J Inherit Metab Dis. 2007;30:447-65.
15. Zhao D, Han L, He Z, Zhang J, Zhang Y. Identification of the plasma metabolomics as early diagnostic markers between bil-iary atresia and neonatal hepatitis syndrome. PLoS One. 2014;9:e85694.
16. Wang Q, Sun T, Cao Y, et al. A dried blood spot mass spectrom-etry metabolomic approach for rapid breast cancer detection. Onco Targets Ther. 2016;9:1389-98.
17. Benjamini Y, Hochberg Y. Controlling the false discovery rate: A practical and powerful approach to multiple testing. J Roy Stat Soc B. 1995;57:289-300.
18. Cawley GC, Talbot NL. Efficient leave-one-out cross-validation of kernel fisher discriminant classifiers. Pattern Recognit. 2003;36:2585-92.
19. Ivanisevic J, Siuzdak G. The role of metabolomics in brain metab-olism research. J Neuroimmune Pharmacol. 2015;10:391-5. 20. Sun H, Zhang A, Yan G, et al. Metabolomic analysis of key
reg-ulatory metabolites in hepatitis C virus-infected tree shrews. Mol Cell Proteomics. 2013;12:710-9.
21. Iadecola C, Anrather J. Stroke research at a crossroad: Asking the brain for directions. Nat Neurosci. 2011;14:1363-8. 22. Kimberly WT, Wang Y, Pham L, Furie KL, Gerszten RE. Metabolite
profiling identifies a branched chain amino acid signature in acute cardioembolic stroke. Stroke. 2013;44:1389-95. 23. Hosinian M, Qujeq D, Ahmadi Ahangar A. The relation between
GABA and L-Arginine levels with some stroke risk factors in acute ischemic stroke patients. Int J Mol Cell Med. 2016; 5:100-5.
24. Nishimura H, Rosenblum WI, Nelson GH, Boynton S. Agents that modify EDRF formation alter antiplatelet properties of brain arteriolar endothelium in vivo. Am J Physiol. 1991;261: H15-21.
25. Lim HK, Lim HK, Ryoo S, et al. Mitochondrial arginase II con-strains endothelial NOS-3 activity. Am J Physiol Heart Circ Physiol. 2007;293:H3317-24.
26. Steppan J, Nyhan D, Berkowitz DE. Development of novel argi-nase inhibitors for therapy of endothelial dysfunction. Front Immunol. 2013;4:278.
27. Wang D, Kong J, Wu J, Wang X, Lai M. GC-MS-based metabo-lomics identifies an amino acid signature of acute ischemic stroke. Neurosci Lett. 2017;642:7-13.
28. Liu P, Li R, Antonov AA, Wang L, Li W. Discovery of metabolite biomarkers for acute ischemic stroke progression. J Proteome Res. 2017;16:773-9.
29. Jian WX, Yuan ZK, Huang XP. Detection and analysis on plasma metabolomics in patient with coronary heart disease of Xin-blood stasis syndrome pattern. Zhongguo Zhong Xi Yi Jie He Za Zhi. 2010;30:579-84.
30. Fernstrom JD. Branched-chain amino acids and brain function. J Nutr. 2005;135:1539S-46.
31. Huang Y, Zhou M, Sun H, Wang Y. Branched-chain amino acid metabolism in heart disease: An epiphenomenon or a real cul-prit? Cardiovasc Res. 2011;90:220-3.