INIA - CIFOR
INSTITUTO UNIVERSITARIO DE GESTIÓN FORESTAL SOSTENIBLE
_______________________________________________________________
Máster en Investigación en Ingeniería para la Conservación y
Uso Sostenible de los Sistemas Forestales
EFFECTS OF THE FIRST THINNING ON THE
GROWTH AND CONE PRODUCTION OF STONE
PINE (
PINUS PINEA
L.) STANDS IN THE
NORTHERN PLATEAU (SPAIN)
Por DANIEL MORENO FERNÁNDEZ
Tutoras:
Mariola Sánchez-González
Isabel Cañellas Rey de Viñas
Vº Bº
Que es mi barco mi tesoro,
que es mi dios la libertad,
mi ley, la fuerza y el viento,
mi única patria, la mar.
Mariola, por haberme ayudado con la estadística del trabajo, por haberse leído el
trabajo tantas veces, por sus consejos y, sobretodo, por su paciencia. A Isabel por
haber coordinado y dirigido todo esto, por las revisiones que hizo del manuscrito y
porque sin ella yo no podría haber estado donde estuve. ¡Muchísimas gracias a las
dos! También me gustaría dar las gracias a Rafael Calama por todo lo que aportó en la
parte de la producción de piña y sobre el conocimiento de la especie y a Javier Gordo
por todos sus comentarios sobre la gestión de la masa en Valladolid y por sus
sugerencias. Además, tengo que dar las gracias a todas las personas que se han
encargado del trabajo de campo, en especial a Ángel Bachiller, y a los agentes
forestales de la Comarca de Viana de Cega. Quiero dar las gracias también a mi tío, el
Dr. Nicholas Devaney por revisar el inglés.
Gracias a gente del CIFOR-INIA con la que he compartido buenos ratos,
gracias por hacer que mi estancia allí fuera tan agradable y enriquecedora. Seguro
que nos vemos pronto. A mis compañeros del máster les deseo lo mejor y mucha
suerte, han sido dos años muy buenos y bonitos en Palencia.
Tengo que dar las infinitas gracias a mis padres, gracias por apoyarme en todo
y animarme a seguir formándome, y gracias por haberme enseñado a no conformarme
con lo mínimo.
Este Trabajo Fin de Máster ha sido aceptado en la revista Annals of Forest Science:
Moreno-Fernández D, Cañellas I, Calama R, Gordo J, Sánchez-González M (Accepted) Effects of the first thinning on the growth and cone production of
stone pine (Pinus pinea L.) stands in the Northern Plateau (Spain). Annals of
i
Índice
Abstract ... 1
Resumen ... 1
Introduction ... 2
Objectives ... 4
Materials and methods ... 4
Experimental design ... 4
Dependent variables... 6
Statistical analysis ... 6
Thinnings effects on growth ... 7
Thinnings effects on cone production ... 8
Results... 10
Thinnings effects on growth ... 10
Thinnings effects on cone production ... 12
Discussion... 15
Thinnings effects on growth ... 15
Thinnings effects on cone production ... 16
Conclusions ... 18
ii
Índice de tablas
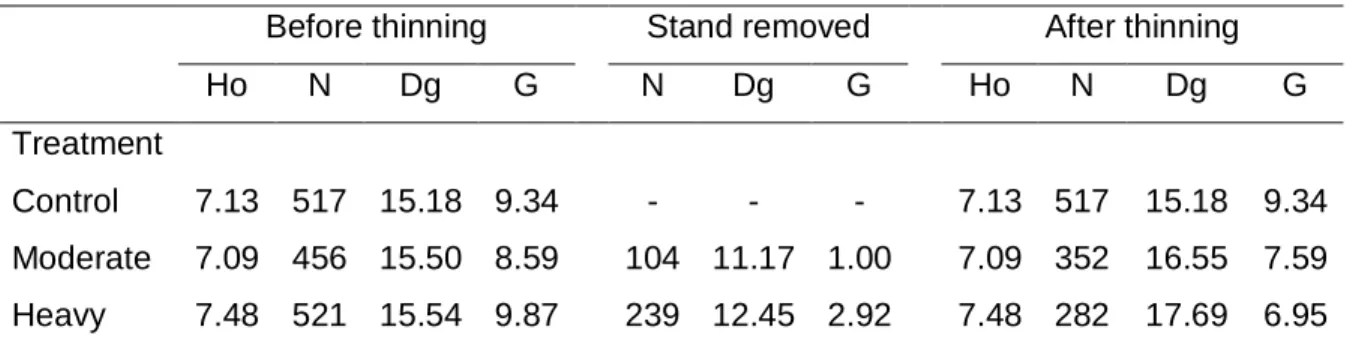
Table 1. Average attributes of the stand treatment before and after thinning treatment at the installation year and quantification of the thinning developed ... 5
Table 2. Estimates of the fixed effects parameters and covariance components for
cone production variables ... 14
Table 3. Probability mean and its confidence limits and least squares mean estimate on
logit scale and its 95% confidence limits. ... 14
Índice de figuras
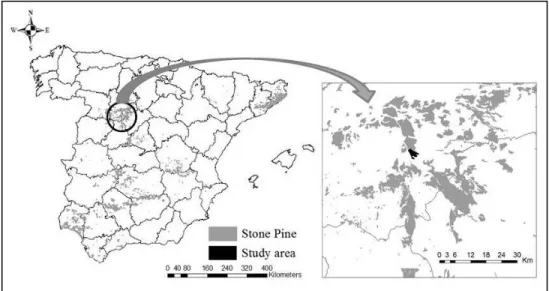
Figure 1. Distribution of Pinus pinea stands in Spain and location of the study area ... 4
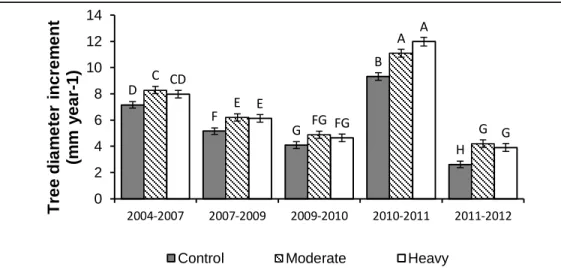
Figure 2. Average and standard error of tree diameter increment ... 11
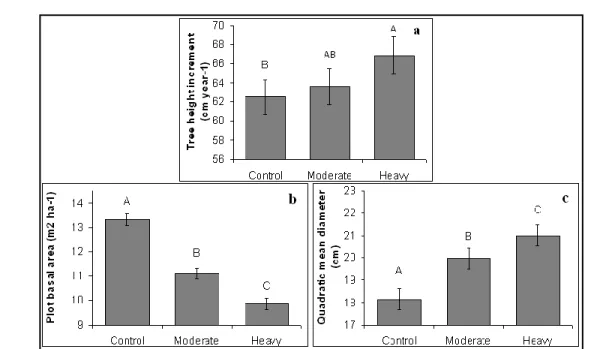
Figure 3. Average and standard error of tree and stand attributes significantly and time
constant affected by thinning ... 12
1
Abstract
Edible stone pine (Pinus pinea L.) nut is the forest product which provides the
highest incomes to the owners of stone pine forests. In spite of this, there is a lack of
knowledge concerning forest management alternatives when the main stand objective is
edible nut. The objective of this work is to evaluate the effect of first thinning on growth and
cone production in an artificially regenerated stand located in the Northern Plateau (Spain)
in order to determine optimum intensity. A thinning trial was installed in 2004 to compare
two thinning regimes (heavy and moderate) and a control treatment. From 2004 to 2012
an inventory of forest attributes was carried out 6 times and the cone crop was harvested
annually. In order to evaluate the effect of thinnings on growth we used repeated
measures analysis of variance using a mixed model approach. With regards to cone
production we first estimated the probability of finding cones in a tree by applying a
generalized mixed model and then estimate cone production using a mixed model,
including climatic variables in both models. We found that thinning has a positive influence
on tree diameter and height increment, quadratic mean diameter and cone production. We
recommend early silvicultural treatments in stone pine stands to favor the development of
trees and larger edible pine nut production.
Key words: mixed models, logistic regression, non-wood products, edible nut,
Mediterranean area, early treatments
Resumen
El piñón del pino piñonero (Pinus pinea L.) es el producto que más beneficios
reporta a los propietarios de estas masas forestales. Sin embargo, aún quedan muchas
preguntas acerca de la selvicultura a seguir para masas cuya función preferente es la
producción de piñón. En este trabajo se estudia el efecto de la primera clara sobre el
crecimiento y la producción de piña en una masa repoblada en la provincia de Valladolid
(España) para tratar de determinar cuándo se deben comenzar las claras y con qué
intensidad. Con dicho objetivo, en 2004 se instaló un dispositivo permanente en el que se
comparan tres tratamientos distintos, dos regímenes de claras (fuerte y moderada) y un
2
anualmente. Para evaluar el efecto de las claras en el crecimiento tanto a nivel de masa
como de árbol individual se realizó un análisis de la varianza de medidas repetidas
aplicando modelos mixtos. En el caso de la producción de piña, en primer lugar se estimó
la probabilidad de que un árbol produzca piñas aplicando un modelo mixto generalizado, y
a continuación se estimó la producción de piña mediante un modelo mixto, incluyendo en
ambos casos variables climáticas. Encontramos influencia positiva de las claras en el
crecimiento en diámetro y en altura a nivel de árbol individual, en el diámetro cuadrático
medio, en el peso de la cosecha de piñas y en la posibilidad de encontrar piñas en un
árbol. Se recomienda aplicar tratamientos selvícolas tempranos para fomentar el
desarrollo de los pies así como la producción de piña.
Palabras clave: modelos mixtos, regresión logística, productos no maderables, piñón
comestible, área mediterránea, claras tempranas.
Introduction
Stone pine (Pinus pinea L.) is a species native to the Mediterranean area. Natural
or afforested stone pine stands occupy more than 400,000 ha in Spain (Montero et al.,
2008). Traditionally, the management of stone pine stands has tried to combine multiple
objectives: edible pine nut production, timber, firewood, recreational use, landscaping and
protection against wind erosion on sandy soils. However, pine cones provide high incomes
to the forest owners, often than that associated with timber or firewood, due to the fact that
pine nuts are currently highly prized (average price of 2,100 € t-1) in international markets
(Mutke et al., 2005). Edible nuts have become the most important forest product in many
rural areas. Sustainable development of the stone pine forest and the surrounding rural
areas requires more intensive management of forest resources in order to achieve
maximum value per tree.
For these reasons, when nut production is the main goal the target of stone pine
management, thinnings must aim low densities to encourage crown development and to
avoid overlaps and regression of the crowns. Also, thinnings must promote tree cone
production even if this means a reduction in productions per unit area in order to reach
greater yield in harvest operations. If there is a delay in thinning treatments or they are too
3
al., 2008). The first thinning must be carried out achieving low densities since the
beginning of fructification (15-25 years old) (Montero et al., 2008).
There are some scientific works which report that fellings favor seed production in
pine species, such as Pinus sylvestris L. (Karlsson, 2000), Pinus ponderosa Dougl. Ex
P.&C. (Krannitz and Duralia, 2004) or Pinus resinosa (Sol. Ex Aiton) (Cooley, 1970). The
effects of density on cone production in managed stands have been studied in Pinus pinea
L stands (e.g. Calama et al., 2008). However, there are not any studies which have
analyzed thinning schedules and the goal densities for each site index and age in the case
where the edible pine nut is the main stand aim.
However, large crops fluctuate significantly over the years. The fluctuation is
attributed to meteorological conditions (Calama et al., 2011; Mutke et al., 2005) and is
associated with the secondary effect of exhaustion of resources caused by large crops
(Mutke et al., 2005). Climate conditions affect the physiological cone development, and
therefore cone production, in the course of its long reproductive cycle, which takes 3
years. Hot points of cone development are bud formation and flower survival; all of them
are closely related to rainfall (Mutke et al., 2005). In addition, both cone and seed
production for a given year, are also conditioned by the vigor and health of the tree, its
size, the loss of seed through pests or predation, soil attributes, mainly water soil retention,
and the attributes of the stand, especially, the stand density (Calama et al., 2008; Calama
et al., 2011).
Diameter is positively correlated with crown size (Ciancio et al., 1986) and cone
production (Krannitz and Duralia, 2004; Calama et al., 2008; Calama et al., 2011). Since
trees of larger diameter produce the most of the cones, increased cone production may be
a longer-term benefit of thinning (Krannitz and Duralia, 2004). Therefore, large diameters
will be required to maximize cone and edible nut productions per tree. Tree growth is
regulated by thinning which controls of stand density (Mäkinen and Isomäki, 2004b). There
are many studies about the thinning intensity and growth response, mainly in Northern
conifers (e.g. Mäkinen and Isomäki, 2004a and 2004b; Slodicak et al., 2005). In the
Mediterranean basin, several thinning experiments have been carried out on other pines
(e.g. Montero et al., 2001; Del Río et al., 2008). However, there is less information about
4
Objectives
The main objective of this study is to analyze the effect of the first thinning on
growth at single tree and stand levels, and on cone production, while taking climatic
variables into account, for stone pine stands established through artificial regeneration in
the Northern Plateau, which is one of the most important areas for the species in Spain.
Considering our data series, the results of this work might be useful in order to determinate
the optimum goal density after first thinning. We hypothesize that diameter growth and
cone production will be higher in thinned stands than in control stands. Also, we expect to
find a positive correlation between cone production and precipitation.
Materials and methods
Experimental design
A thinning trial with permanent plots was installed in the Pinar y Dehesa de Abajo
forest (Valladolid province, Northern Plateau, Spain) (Figure 1) in 2004. The trial is located
in a pure P. pinea stand established 20 years ago through artificial regeneration. Annual
precipitation in the area is 408 mm and average annual temperature is 11 ºC. The stand is
on sandy flat soil at an altitude of around 743 meters above sea level. This area is in the
climatic limit of the species because of the shortage of precipitation and the extremely high
summer temperatures.
5
The thinning trial was carried out using a randomized complete block design, with
three blocks and three treatments per block. The plots, nine 2500 m2 adjacent squares (50
m x 50m), were thinned from below immediately after trial establishment eliminating small
trees, trees with badly shaped crowns, twisted stems, less vigorous and dominated trees
providing remaing trees enough growing space and water and nutrients which are scarce
in these sandy soils. Selection of future or elite trees was rejected because the stand was
too young at the installation moment. Three treatments were tested: heavy thinning (goal
density: 275 trees ha-1), moderate thinning (goal density: 350 trees ha-1) and control (517
trees ha-1). Due to the differences in dominant height three blocks were established. The
dominant heights of the blocks I, II and III were 6.68 m, 7.20 m and 7.82 m respectively.
The block effect is due to the difference of sand stored in the soil which is related to the
water retention in the soil. The average attributes of the stand treatments are shown in
Table 1.
Table 1. Average attributes of the stand treatment before and after thinning treatment at
the installation year and quantification of the thinning developed.
Before thinning Stand removed After thinning
Ho N Dg G N Dg G Ho N Dg G
Treatment
Control 7.13 517 15.18 9.34 - - - 7.13 517 15.18 9.34
Moderate 7.09 456 15.50 8.59 104 11.17 1.00 7.09 352 16.55 7.59
Heavy 7.48 521 15.54 9.87 239 12.45 2.92 7.48 282 17.69 6.95
Ho=dominant height (m), N=density (trees ha-1), Dg=quadratic mean diameter (cm) and G=basal
area (m2 ha-1).
All trees in the nine plots are identified in order to facilitate data gathering. Six
inventories (2004, 2007, 2009, 2010, 2011 and 2012) were carried out and the following
data was collected: diameter at breast height (dbh) of all trees, the height of 30 trees
proportionally situated throughout the diametric distribution, and the height of the 10
thickest trees per plot in order to estimate the dominant height (Ho).
In addition, cones from the trees used to calculate the average height were
collected (30 trees per plot proportionally situated throughout the diametric distribution),
6
were classified into healthy and unhealthy cones. Unhealthy cones were attacked by
Dioryctria mendacella Stgr. (Lepidoptera) and Pissodes validirostris Gyll. (Coleoptera).
Dependent variables
The effect of different thinning intensities on growth was evaluated by analyzing
both stand and average tree attributes as dependent variables. The variables analyzed
were: di, tree diameter increment (mm year-1) (diameter increment of each single tree); hi,
height increment (cm year-1) (height increment of each single tree); Ho, dominant height
(m); HoI, dominant height increment (cm year-1); Dg, quadratic mean diameter (cm); DgI,
quadratic mean diameter increment (cm year-1); G, basal area (m2 ha-1) and GI, basal area
increment (m2 ha-1 year-1).
In order to evaluate the effect of the three treatments on the cone production, the
following variables were analyzed: n_healthy (number of healthy cones per tree);
w_healthy (weight of healthy cones per tree).
Statistical analysis
The available data consisted of repeated observations of a variable taken from the
same tree, block and plot during different years. Measurements taken on the same tree
are more highly correlated than measurements taken on different trees, and
measurements taken closer in time on the same tree are more highly correlated than
measurements taken further apart in time. This pattern of correlation between
observations implies that assumptions about error variance being independent and
homogenous are no longer valid (Wolfinger, 1996; Littell et al., 2000). The analysis of
repeated measurements requires that correlations between the observations made on the
same subject be taken into account as well as possible heterogeneous variances among
observations on the same tree over time. In this study this is achieve using a mixed linear
7 Thinning effects on growth
The hypotheses of no differences among thinning treatments averaged over the six
inventories, and whether their effects change over time or not was tested using the
following analysis of variance (ANOVA) mixed model:
ijkl i j ij l lk lj ijkl
y
w h wh b s bh
(1)
where yijkl indicates the value of the response variable taken in the sampling unit (tree or
plot) k with treatment i, located in a block l; μ represents the intercept of the model or
overall mean; wi is the fixed effect treatment i; hj is the fixed time effect (periods between
inventories for increments and inventories for growth); whij is the fixed interaction effect
corresponding to treatment i and time j; bl is the random effect of block l; slk is the random
sampling unit effect k in block l and bhlj is the random interaction corresponding to blocks
and time j. bl ,slk, and bhlj are random effects following a normal distribution with mean zero
and variance σb2, σs2 and σbh2 respectively. Finally, εijkl is a random error term defining
within-subject pattern of variability. In the case of tree diameter increment (di) the diameter
at the beginning of the period (dkj), i.e., previous diameter inventory was taken as
covariate.
Model (1) represents the complete model. The simplest structure, including only the
fixed part of the model and without random effects was compared with more complicated
models with random structures. Contrasts were performed by applying restricted
log-likelihood test after restricted maximum log-likelihood (REML) estimation. Variance-covariance
structures for within-subject observations were then evaluated on the basis of the
log-likelihood ratio test and Akaike´s Information Criterion (AIC): variance components (VC),
compound symmetry (CS), autoregressive order 1 (AR-(1)), Huyhn-Feldt (H-F) and
unstructured (UN). In order to explore the data in more detail, significant ANOVA-effects
were further investigated usinge Tukey’s post-hoc test. All analyses were carried out using
8 Thinning effects on cone production
As stated above, cone crops fluctuate over the years and fluctuation can be mainly
attributed to meteorological conditions of the three years reproductive cycle. Stone pine
bud formation takes place 3 years before cone maturation (Mutke et al., 2005), and
therefore thinning effects (more resources availability) do not appear until 3 years after
thinning treatment i.e., cones harvested in 2005 and 2006 came from female flowers
sprouted in 2003 and 2004 and buds were formed the previous year during 2002 and 2003
respectively, before thinning treatment. To take these two issues into account, we evaluate
the influence of thinning treatment on cone production by a linear mixed model including in
the modeling data number and the weight of healthy cones per tree and year from 2007 to
2012 and rainfall variables related to key points of cone formation and development. The
number and weight of healthy cones do not follow a normal distribution because of the
dramatic number of zeros, 81.41 % from 2007 to 2012. First, a logistic regression was
used to estimate the probability of finding a cone in a tree according to thinning intensity,
and then, the influence of treatment on crop was evaluated only for the non-zero events.
We used logistic regression to model the probability that a tree i produces at least
one cone in a single year j. The dependent variable n_healthy (number of healthy cones
per tree) was transformed into a binary variable logged bin where value “1” implies
n_healthy > 0 and “0” implies n_healthy=0. We used a Generalized Linear Mixed Model
with a logit link function, random effects and repeated measures to test the effects of
explanatory variables on the binary cone production data. Let πk be the probability of
n_healthy > 0 and 1- πk as the probability that a tree produces no cone. Odds is defined as
π/(1-π).
log
log1 i ijkl l lk ijkl
it
w
x b s
(2)
All the model parameters have been defined previously; except x which represents
vectors of covariates (corresponding to different levels depending on the covariate), α
which represents vectors of the unknown but estimable parameters. We included as
covariates the stand age and some rainfall variables (data series from the nearest weather
station of the State Meteorological Agency (AEMET, 2012)): i) sum of May and June, and
October and November precipitation 3 years before maturation (Pmj and Pon
respectively). Pmj is related to formation of buds and Pon to the differentiation of buds into
9
of flowers (Ps). iii) the sum of winter-spring months precipitation before maturation (Pws),
which influences on cone weight. In addition, we incorporated diameter at breast height
dbh as covariate since diameter is positively correlated with cone production (Krannitz and
Duralia, 2004; Calama et al., 2008, Calama et al., 2011).
Moreover, the model can also be interpreted as the log of odds back to the
probability such that:
1
i ijkl l lk ijkl
i ijkl l lk ijkl
w x b s
ijlk w x b s
e
e
(3)For any given value of μ + wi + αxijkl + bl + slk + εijkl, πijkl values (probability of finding
a cone in a tree k with treatment i, in the block l and the year j) are always between 0 and
1. Therefore, we only get sensible realizations (Zuur et al., 2009).
Analysis was conducted using SAS 9.2 Proc GLIMMIX (SAS, 2009). In order to
avoid over-parameterization an iterative sequential procedure was proposed to define the
appropriate model for each response variable. Firstly, the simplest structure with only the
treatment as fixed effect and without random effects was compared with more complicated
models with random structures. Inclusion of random effects and selection of covariance
matrix followed the same procedures described for growth models. Once the preliminary
random structure was selected and the within-subject covariance matrix was chosen the
inclusion of covariates was evaluated in terms of the log-likelihood ratio test, applied after
pseudo maximum likelihood estimation. When the structure had been defined, the model
was fitted following residual likelihood. The disadventage of pseudo-likelihood is the
absence of a true log likelihood, which complicates model comparsisons and model
selection based on information criteria (Schabenbeger, 2007). The GLIMMIX Procedure
implements two integral approximation techniques to marginal likelihood: Laplace´s
method and quadrature approximation which do not allow R-side random effects (SAS,
2009) and, therefore, they do not tolerate repeated measures.
Once the probability that a tree produces no cone was modelled, the effect of
thinning treatments on cone production was evaluated using non-zero weight cone values.
Weight values, even when not considering zero events, do not follow a normal distribution,
10
log Cijkl wixijkl bl slkijkl
(4)
where Cijkl is the weight of cone production for a tree k with treatment i, in the block l and
the year j. All the parameters have been defined above. The methodology for model
building was the same as used for the probability logistic model but using true likelihood.
Analysis was carried out using Proc MIXED (SAS, 2009).
Results
Thinning effects on growth
In the case of tree diameter increment, treatment, time and the interaction
treatment x time were statistically significant (p-value<0.0001 for all of them), indicating
that trees with different thinning treatments had different diameter growth rates over time.
Further analysis indicated that tree diameter growth was greater in thinned plots than in
control plots in the second, fourth and fifth growth intervals but we did not find significant
differences between moderate and heavy thinning (Figure 2). The tree diameter
increments were decreasing since thinning development (2004) to the last inventory
(2012) except in the fourth period (2010-2011) when the highest increments were found.
Moreover, the diameter at the beginning of each period was also significant
(p-value=0.0045). It had a weak negative influence (estimation coefficient=-0.00331) on tree
diameter growth, ie. increments were larger when tree diameters were thin. The values of
tree diameter increment were higher in released stands than those trees located in
unthinned stands. Concerning the random effect, the block, was significant in terms of the
log-likelihood ratio test. The best structure for within-subject covariance was the
unstructured (UN) matrix indicating the existence of a common pattern associated with the
tree effect, but no clear trends of correlation among tree observations (Littell et al., 1996).
In the case of tree height increment, treatment and time were also found to be
statistically significant (p-value=0.0260 and p-value<0.0001 respectively). However,
interaction treatment x year was not significant (p-value = 0.1505), indicating that effect of
thinning is constant in time. Significant differences only appeared between heavy thinning
log-11
likelihood ratio test. The Huyhn-Feldt structure for the variance-covariance matrix (HF)
reached the lowest AIC value.
Figure 2. Average and standard error of tree diameter increment according to Type III test
for fixed effects. Treatments marked with same letter are not significantly different
(p-value >0.05).
As regards plot variables, thinning treatment and time had significant effects on
basal area and quadratic mean diameter (p-value>0.0001 for both effects) but the
interaction treatment x year did not (p-value=0.8286 and p-value=0.2514, respectively).
The effect of thinning in both variables is inverse, thinning significantly decreased the
basal area while increasing the quadratic mean diameter (Figure 3). In both variables the
block random effect was included and the unstructured (UN) matrix was selected as the
best covariance structure.
D F G B H C E FG A G CD E FG A G 0 2 4 6 8 10 12 14
2004-2007 2007-2009 2009-2010 2010-2011 2011-2012
T re e di a m e te r inc re m e nt (m m y e a r-1)
12
Figure 3. Average and standard error of tree and stand attributes significantly and time
constant affected by thinning according to Type III test for fixed effects. Treatments
marked with same letter are not significantly different (p-value>0.05) according to Tukey´s
test.
The remaining variables analyzed were not statistically influenced (p-value>0.05)
by the treatment or treatment x time and results are not shown.
Thinning effects on cone production
The cone production, once extrapolated taking into account 30 sampled trees per
plot were proportionally selected throughout the diametric distribution, the average
production of control, moderate and heavy plots was 34.4 kg ha-1 year-1, 50.8 kg ha-1 year-1
and 43.4 kg ha-1 year-1 respectively since 2005-2012. Regarding modeling data, from 2007
to 2012 the control plots produced 14.9 kg ha-1 year-1, the plots with moderate thinning
39.3 kg ha-1 year-1 and the plots with heavy thinning 32.8 kg ha-1 year-1. Fig. 4 shows the
average cone production per plot and years according to the tree treatments. It can be
seen that there was great variability among the years. Both the number and weight of
cones oscillated with minima in 2007 and 2012, and peaks 2005, 2006 and 2009 (Fig. 4).
The weight per cone behaved similarly; it ranged from 0.198 to 0.255 kg per cone. From
13
only 23.78 % of the measurements at least a cone were found. Furthermore, more than
70% of the trees produced at least one cone during the period 2005-2012.
Figure 4. Average cone production per hectare according to treatment after extrapolation
of 30 selected trees per plot cone production.
Concerning the probability of finding at least one cone in a given tree, the final
chosen model contained just the treatment as fixed effect. In terms of pseudo-likelihood,
none of the covariates analyzed improved the model (Table 2) and, therefore, they were
not included in the final model. The ratio of the generalized chi-square statistic and its
degrees of freedom was 0.90, indicating that the variability in this data has been properly
modelled and that there was not residual overdispersion (Schabenberger, 2007). The best
covariance structure was CS pointing out a constant correlation among tree observations.
The treatment effect was significant for the probability of finding cones in a tree (p-value
<0.0001). No significant differences between heavy and moderate thinning were found
(p-value = 0.9939). In both cases, the probability of finding at least one cone in a tree is about
23%. This probability is reduced by half in the control treatment, with significant differences
between thinned plots and control plots appearing (p-value < 0.0001 for both contrasts)
(Table 3). 0 20 40 60 80 100 120 140
2005 2006 2007 2008 2009 2010 2011 2012
C o n e p ro d u ct io n (kg h a -1 year -1)
14
Table 2. Estimates of the fixed effects parameters and covariance components for cone
production variables (only shown for significant effects p-value<0.05). p-values are
referred to Type III test for fixed effects.
Source Probability Source Log of weight cones
Fixed parameters
Intercept -2.2391 Intercept 2.0327
Heavy 1.0287 Heavy 0.1382
Moderate 1.0474 Moderate 0.1342
Control 0 Control 0
Ps (summer precipitation) 0.002050
dbh 0.001577
Covariance component
Tree – CS 0.02231 Block 0.007337
Tree – CS 0.06578
p-value treatment <0.0001 p-value treatment 0.0084
p-value Ps 0.0040
p-value dbh 0.0010
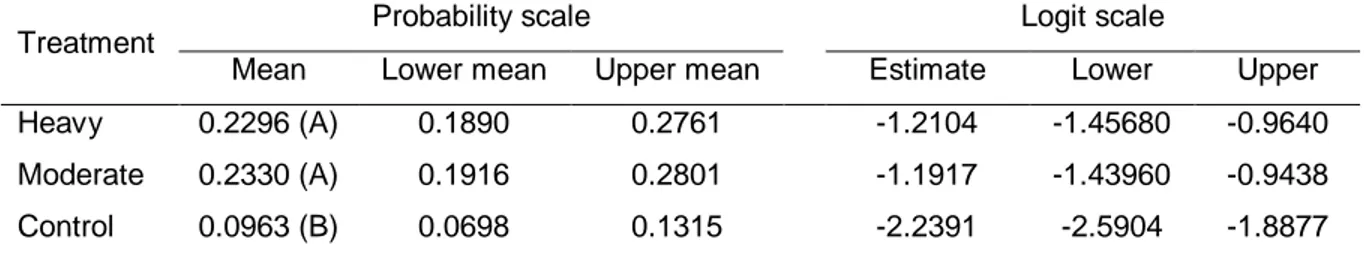
Table 3. Probability mean and its confidence limits and least squares mean estimate on
logit scale and its 95% confidence limits. Different letters indicate significant differences
(p-value<0.05) according to Tukey´s test.
Treatment Probability scale Logit scale
Mean Lower mean Upper mean Estimate Lower Upper
Heavy 0.2296 (A) 0.1890 0.2761 -1.2104 -1.45680 -0.9640
Moderate 0.2330 (A) 0.1916 0.2801 -1.1917 -1.43960 -0.9438
Control 0.0963 (B) 0.0698 0.1315 -2.2391 -2.5904 -1.8877
There was a significant effect of treatment (p-value=0.0488) on the logarithm of
non-zero weight cone values. The most productive treatments were heavy and moderate
thinning. However, Tukey´s test did not reveal significant differences between both
thinning treatments (p-value=0.9933). Heavy thinning was different from control treatment
(p-value=0.0114). Also, significant differences appeared between moderate thinning and
co-15
variable that showed statistically significant influence (p-value=0.0040) on cone production
(Table 2). Finally, diameter at breast height, dbh, also appeared as significant
(p-value=0.0010). Both co-variables showed a positive influence on stone pine cone
production.
Discussion
Thinning effects on growth
In this study, two thinning treatments (moderate and heavy) and one control one
were applied in a 20-year-old Pinus pinea stand. As expected, thinning favored diameter
growth. Similar results were found for other pine stands between 20 and 30 years old.
Cooley (1970) and Pukkala et al. (1998) already found differences in diameter growth 5
years after first thinning. Guller (2007) found a significant relationship between thinning
intensity and diameter increment. Peltola et al. (2007) reported higher growths in thinned
stands 12 years after first thinning. However, we found significant differences among
unthinned plots and thinned plots but there did not appear any difference between thinning
regimes. This might be a consequence of the soft difference between both thinning goal
densities. A heavier thinning could show larger tree diameter increments. In younger
stands than ours, the effect of pre-commercial thinning already produced diameter growth
increments in stone pine (Gordo et al., 2009). We suggest that the cause of the
appearance of the largest tree diameter increments six years after thinning development
(during 2010-2011) is the great rainfalls registered in 2010.
The diameter at the beginning of the period was significant, in that the smallest
trees had the greatest diameter growth. The Calama and Montero (2005) growth model for
stone pine included diameter at breast height as a negative effect on tree diameter
increment. Pukkala et al. (1998) also found that thin trees showed larger diameter growth.
Peltola et al. (2007) reported that regardless of thinning intensity, the small and medium
sized trees grew more in relative terms in response to the thinning than the largest trees.
However, they found that the largest trees grew more in absolute terms.
Our results show that heavily thinned plots had lower values of basal area than the
non-thinned plots, even cumulative basal area, i.e. current basal area plus basal area
removed in the thinning, is lower in thinned plots. Hasenauer et al. (1997) studied the
16
that at least 12 years after the thinning the basal area of control plots exceeds those of
thinned plots.
In Mediterranean forests, competition appears, characterized by a severe summer
drought during the period of high temperatures, due to competing for water and nutrient
resources. Even in the case of low density of stone pine stands, as supramediterranean
pine species, competition also exists from seedling state both in naturally and artificially
regenerated stands (Tang et al., 1994). Therefore, development of silvicultural treatments
in order to reduce density in each site index and stand age is primordial to optimize wood
and cone production.
Thinning effects on cone production
In this study we analyzed crop weight per tree which is function of both the number
of cones per tree and their weight. The number of cones is counting data and its statistical
problems have been described above. The use of the probability of finding a cone in a tree
allowed to complement the effect of thinnings on crop weight. To this end we used logistic
regression. Logistic regression techniques have been used in the field of forestry to predict
mortality (Bravo-Oviedo et al., 2006; Adame et al., 2010), ingrowth (Adame et al., 2010),
and to predict fruit and cone production (Calama et al., 2011). We found that thinning
favored the probability of finding at least one cone in a given tree, being more than the
double in thinned than in control plots.
The fact that bud formation takes place 3 years before maturation and the thinning
treatment was carried out in 2004, implies that cones harvested in 2006 and 2005 came
from buds formed before the thinning treatment. Therefore, the harvest of 2007 is the first
one to be considered under thinning effects. Until 2007 the differences between treatments
were weak and since 2007 control plots showed lower production. This was more evident
in bumper crop years, where the difference between thinned and control plots was larger.
Overall, the greatest cone production appeared in thinned plots, reaching more the twice
the production in thinned stands than control stands. Reukema (1961) found a similar
result. He reported that thinned stands of young Douglas fir (Pseudotsuga menziesii
(Mirb.) Franco) produced much more seed than unthinned stands in good years, but
thinning does not stimulate seed production in poor seed years. At the end of our study
period, trees located in thinned plots produced almost two times the number of cones and
17
plantation on a good site, Cooley (1970) reported the number of mature cones per tree
was increased two years after thinning. Our results are also in concordance with Karlsson
(2000), who studied seed production of mature Scots pine stands after release cutting. His
results showed that released trees produce much more cones than the unreleased.
Thinning treatment allows crowns to be exposed to more light and the availability of water
and mineral nutrients is higher (Karlsson, 2000; Krannitz and Duralia, 2004) because of
less inter-tree competition. Actually, Gonçalves and Pommerening (2012) found an
inhibition of cone production between trees close in space and stimulation at larger
distances. However, we did not find important differences between two thinning regimes.
We suggest a small difference between heavy and moderate intensities and, therefore, the
development of heavier thinnings to promote larger crops per tree. Moreover, more trials
are needed to find out when first thinning should be carried out in each site index.
Although we did not find differences in cone production between moderate and
heavy treatments, the harvest effectiveness is higher in heavily thinned plots since
production is located in less trees and, in this way, both manual and mechanized
harvesting reach greater yields.
When we carried out the statistical analysis by performing mixed model with the log
of cone weight production being the dependent variable differences between treatments
appeared with the significant difference between thinned treatments and control plots. Log
transformation was already used by other authors (Mutke et al., 2005; Calama and
Montero, 2007) to study stone pine cone production. However, instead of removing null
weight values to perform statistical analysis, they applied the log transformation of the
cone weight plus 1 to delete zero values since they were studying older stands than ours
which were more productive and null values were shorter.
Regarding the effect of climatic variables on log of cone weight production, the only
variable that appeared as significant was the Ps, summer precipitation after flowering,
related to flower survival and, therefore, number of cones. The other rainfall variables
(Pmj, Pon and Pws) are related to bud survival and cones fattening. In older stands,
Calama et al. (2011) found all of rainfall variables considered in our study to be statistically
significant. Mutke et al. (2005) studied meteorological effects on cone production in mature
stands of stone pine. They found that cone production was significantly affected by
winter/spring rainfall before primordia formation (3 years before cone maturation), rainfall
18
and the annual rainfall before cone ripening. Null influence of these precipitation variables
can be explained by short data series and the fact that pines are young and they did not
reach normal and regular cone productions. We suggest that the stands were quite young
and root-competition between trees was weak.
Despite of our short data series, we consider it is enough to compare the effect of
the thinnings over the whole study period (not over individual years) since we did not want
to identify those factors characterizing masting, or describe pattern of annual production
which has already been studied (e.g. Calama et al., 2011).
Finally, we found a positive effect of diameter at breast height with cone production.
This is in concordance with other authors (Krannitz and Duralia, 2004; Calama et al., 2008;
Calama et al., 2011). Therefore, thinning treatments, on the one hand, reduced the density
decreasing inter-tree competition and favoring cone production and, on the other hand,
increase diameter growths and, hence, promote larger crops.
Conclusions
We observed a positive effect of the density reduction on the growth of young stone
regenerated artificially pine stands. Also, cone production increased by employing early
thinning treatments. However, we did not find significant differences between moderate
and heavy thinning both on tree diameter growth and cone production and, despite of our
short data series, our results suggest to carry out heavier thinnings to favour individual tree
cone production. Wider knowledge about starting thinning age in each site index is
necessary.
References
Adame P, Del Río M, Cañellas I. 2010. Ingrowth model for pyrenean oak stands in
north-western Spain using continuous forest inventory data. Eur J For Res 129: 669-678.
AEMET. 2012. State Meteorological Agency. www.aemet.es
Bravo-Oviedo A, Sterba H, Del Río M, Bravo F. 2006. Competition-induced mortality for
Mediterranean Pinus pinaster Ait. and P. sylvestris L. For Eco Manag 222, 88-98.
Calama R, Montero G. 2005. Multilevel linear mixed model for tree diameter increment in
19
Calama R, Montero G. 2007. Cone and seed production from stone pine (Pinus pinea L.)
stands in Central Range (Spain). Eur J For Res 126, 23-35.
Calama R, Mutke S, Gordo J, Montero G. 2008. An empirical ecological-type model for
predicting stone pine (Pinus pinea L.) cone production in the Northern Plateau (Spain).
For Ecol Manag 255 (3/4): 660-673.
Calama R, Mutke S, Tomé JA, Gordo FJ, Montero G, Tomé M. 2011. Modelling spatial
and temporal variability in a zero-inflated variable: the case of stone pine (Pinus pinea
L.) cone production. Ecol Model 222, 606-618.
Ciancio O, Cutini A, Mercurio R, Veracini A. 1986. Sulla struttura della pineta di pino
domestico di Alberese. Ann Ist Sper Selv, Arezzo 17, 169-236 [In Italian]
Cooley JH. 1970. Thinning and fertilizing Red pine to increase growth and cone
production. North Central Forest Experiment Station, US Forest Service. 8 pp
Del Río M, Calama R, Cañellas I, Roig S, Montero G. 2008. Thinning intensity and growth
response in SW-European Scots pine stands. Ann For Sci 65 (3), 308.
Gordo J, Calama R, Rojo LI, Madrigal G, Álvarez D, Mutke S, Montero G, Finat L. 2009.
Experiencias de clareos en masas de Pinus pinea L. en la Meseta Norte. Summaries
of the Spanish Fifth Forestry Congress. S.E.C.F.-Junta de Castilla y León [In Spanish]
Gonçalves AC, Pommerening A. 2012. Spatial dynamics of cone production in
Mediterranean climates: A case study of Pinus pinea L. in Portugal. For Eco Manag
266, 83-93.
Guller B. 2007. The effects of thinning treatments on density, MOE, MOR and maximum
crushing strength of Pinus brutia Ten. wood. Ann For Sci 64 (4), 467-475.
Hasenauer H, Burkhart HE, Amateis RL. 1997. Basal area development in thinned and
unthinned loblolly pine plantations. Can J For Res 27 (2), 265-271.
Karlsson C. 2000. Seed production of Pinus sylvestris after release cutting. Can J For Res
30 (6), 982-989.
Krannitz PG, Duralia TE. 2004. Cone and seed production in Pinus ponderosa: a review.
Wes North Am Naturalist 64(2): 208-218
Littell RC, Milliken GA, Stroup WW, Wolfinger RD. 1996. SAS® System for Mixed Models.
Cary, NC: SAS Institute Inc. 633 pp
Mäkinen H, Isomäki A. 2004a. Thinning intensity and growth of Scots pine stands in
20
Mäkinen H, Isomäki A. 2004b. Thinning intensity and growth of Norway spruce stands in
Finland. Forestry 77 (4), 349-364.
Montero G, Calama R, Ruiz-Peinado R. 2008. Selvicultura de Pinus pinea L. In: Serrada
R, Montero G, Reque JA (eds). Compendio de Selvicultura Aplicada en España.
INIA-Ministerio de Educación y Ciencia. Madrid, Spain 1178 pp [In Spanish]
Montero G, Cañellas I, Ortega C, Del Río M. 2001. Results from a thinning experiment in a
Scots pine (Pinus sylvestris L.) natural regeneration stand in the Sistema Ibérico
Mountain Range (Spain). For Eco Manag 145 (1-2), 151-161.
Mutke S, Gordo J, Gil L. 2005. Variability of Mediterranean stone pine cone production:
Yield loss as response to climate change. Agric For Meteorol 132, 263-272.
Peltola H, Kilpeläinen A, Sauvala K, Räisänen T, Ikonen VP. 2007. Effects of early thinning
regime and tree status on the radial growth and wood density of Scots pine. Silva Fenn
41 (3), 489-505
Pukkala T, Miina J, Kellomäki S. 1998. Response to different thinning intensities in young
Pinus sylvestris. Scand J For Res 13, 141-120
Reukema DL. 1961. Seed production of Douglas-fir increased by thinning. PNW Old
Series Research Note 210, 1-5
SAS (2009) SAS/STAT® 9.2 User´s Guide, Second Edition. Cary, NC: SAS Institute Inc
Schabenberger O. 2007. Growing Up Fast: SAS® 9.2 Enhancements to the GLIMMIX
Procedure. SAS Global Forum 2007. Paper 177-2007
Slodicak M, Novak J, Skovsgaard JP. 2005. Wood production, litter fall humus
accumulation in a Czech thinning experiment in Norway spruce (Picea abies (L.)
Karst.) For Eco Manag 209, 157-166.
Tang S, Meng CH, Wang YH. 1994. A growth and self-thinning model for pure even-aged
stands: theory and applications. For Eco Manag 70 (1-3), 67-73.
Wolfinger RD. 1996. Heterogeneous variance-covariance structures for repeated
measures. J Agr, Biol Envir St, 1 (2), 205-230
Zuur AF, Ieno EN, Walker N, Saveliev AA, Smith GM. 2009. Mixed Effects Models and