Universidad
Universidad
de
de
Valladolid
Valladolid
Escuela Técnica Superior de Ingenieros de Telecomunicación Dpto. de Teoría de la Señal y Comunicaciones e Ingeniería Telemática
Tesis Doctoral
Characterization of Dynamical Neural
Activity by Means of EEG Data:
Application to Schizophrenia
Presentada porD. Alejandro Bachiller Matarranzpara optar al grado de Doctor
por la Universidad de Valladolid
Dirigida por:
Dr. Jesús Poza Crespo y Dr. Roberto Hornero Sánchez
Título:
Characterization of Dynamical Neural Activity
by Means of EEG Data: Application to
Schizoph-renia
Autor:
D. Alejandro Bachiller Matarranz
Directores:
Dr. Jesús Poza Crespo y Dr. Roberto Hornero
Sánchez
Dpto.:
Teoría de la Señal y Comunicaciones e Ingeniería
Telemática
Tribunal:
Presidente:
Dr. D.
Secretario:
Dr. D.
Vocal:
Dr. D.
acuerda otorgarle la calificación de
No te rindas, aún estás a tiempo de alcanzar y comenzar de nuevo, aceptar tus sombras, enterrar tus miedos, liberar el lastre, retomar el vuelo. No te rindas que la vida es eso, continuar el viaje, perseguir tus sueños, destrabar el tiempo, correr los escombros y destapar el cielo. No te rindas, por favor no cedas, aunque el frío queme, aunque el miedo muerda, aunque el sol se esconda y se calle el viento, aún hay fuego en tu alma aún hay vida en tus sueños. porque la vida es tuya y tuyo también el deseo porque lo has querido y porque te quiero. Porque existe el vino y el amor, es cierto. porque no hay heridas que no cure el tiempo. abrir las puertas, quitar los cerrojos, abandonar las murallas que te protegieron, vivir la vida y aceptar el reto, recuperar la risa, ensayar un canto, bajar la guardia y extender las manos desplegar las alas e intentar de nuevo, celebrar la vida y retomar los cielos. No te rindas, por favor no cedas, aunque el frío queme, aunque el miedo muerda, aunque el sol se ponga y se calle el viento, aún hay fuego en tu alma, aún hay vida en tus sueños porque cada día es un comienzo nuevo, porque esta es la hora y el mejor momento, porque no estás solo, porque yo te quiero.
Agradecimientos
En primer lugar, me gustaría dar las gracias a todos aquellos profesores que a lo largo de todos estos años, y gracias a su pasión por la docencia, me han transmitido multitud de conocimientos tanto a nivel personal, como profesional. En especial a mis directores, Dr. Roberto Hornero Sánchez y Dr. Jesús Poza Crespo por ofrecerme la posibilidad de entrar en el mundo del procesado de señal. Gracias por vuestro asesoramiento, vuestra dedicación, vuestra paciencia y vuestra capacidad para ofrecer una nueva perspectiva a la hora de resolver un problema.
Sin lugar a dudas, tengo que extender mis agradecimientos a todos los compañeros que he tenido a lo largo de estos años en el Grupo de Ingeniería Biomédica (GIB). Gracias a vosotros las tareas de investigación eran más amenas: entre las conversaciones comentando resultados o algún test estadístico siempre se colaba un café, una cerveza o cualquiera de las locuras que se nos ocurrían en loshappy meals. Muchas gracias María, Dani, Gonzalo, Rebeca, Laura, Ana, Luis Fernando, Celia, Víctor, Roberto, Fernando, Verónica y en especial a los compañeros en la línea de EEG: Carlos, Javier y Pablo. El grandísimo nivel de este grupo de investigación no solamente se mide en publicaciones científicas, sino también en la profesionalidad y la amabilidad de su personal. Muchas gracias por hacer que me sienta orgulloso de pertenecer al GIB.
No puedo dejar de acordarme y extender los agradecimientos a todo el equipo médico del Dr. Vicente Molina Rodríguez. Sin sus conocimientos médicos y su predisposición continua tampoco habría sido posible llevar a cabo está Tesis Doctoral. Muchas gracias también a Marta Ayuso, Benjamín y especialmente a Alba, los registros de EEG, los congresos y los seminarios bibliográficos han forjado una amistad que ambos tenemos que encargarnos de mantener.
Tampoco puedo olvidarme del Centre de Recerca en Enginyeria Biomédica (CREB) de Barcelona. Gracias a Miguel Ángel, Sergio, Joan Francesc y Carolina por integrarme en vuestro grupo de investigación, primero a través de una estancia y después ofreciéndome el comienzo de una nueva etapa laboral. También agradecer el buen ambiente y las interesantes conversaciones que surgen en el café y la sobremesa con Maria, Sergi, Ángela, Pere, Álex, Pedro, Rudys y Leo entre otros.
Finalmente, quiero dar las gracias a toda mi extensa familia. Todo lo que soy es gracias a ellos, es importante saber que la gente que te quiere tratará de aconsejarte, no se callará cuando esté en desacuerdo, pero sobre todo estará orgullosa de todos tus logros. Espero que esta Tesis Doctoral sirva para poner la guinda a la historia de una tradicional familia rural castellana: mis padres y la mayoría de mis tíos no tuvieron la oportunidad de poder estudiar y aun siendo muy jóvenes tuvieron que ponerse a trabajar para ayudar a sus familias. Estoy seguro de que mis abuelos sabrían valorar el valor simbólico que puede tener esta Tesis Doctoral. Quisiera agradecérselo especialmente a mis padres y mis hermanas, Sara y Azucena, que supieron comprenderme cuando decidí dejar el trabajo y embarcarme en esta aventura incierta por el mundo de la investigación. También quiero acordarme de mi familia adoptiva que tan bien me ha acogido e integrado en Terrassa.
x
Es un consuelo saber que aunque esté a cientos de kilómetros de mi casa, también tengo una familia en la que apoyarme.
Abstract
Schizophrenia is a disabling, chronic and severe mental illness characterized by disin-tegration of the process of thinking, contact with reality and emotional responsiveness. Schizophrenia has been related to an aberrant assignment of salience to external objects and internal representations. In addition, schizophrenia has been identified as a dyscon-nection syndrome, which is associated with a reduced capacity to integrate information among different brain regions. Relevance attribution likely involves diverse cerebral re-gions and their interconnections. As a consequence, many efforts have been devoted to identifying abnormalities in the cortical connections and their relation to schizophrenia symptoms and cognitive performance.
Neural oscillations are one of the largest contributing mechanism for enabling coor-dinated activity during normal brain functioning. Alterations in neural oscillations and cognitive processing in schizophrenia have long been assessed using electroencephalo-graphic (EEG) recordings (i.e. time-varying voltages on the human scalp generated by the electrical activity on the cerebral cortex). Event-related potentials (ERP) depict EEG data as a response to a cognitive task. ERP analyses are used to gain further insights into the neural mechanisms underlying cognitive dysfunctions. In this Doctoral Thesis, a 3-stimulus auditory-oddball paradigm was used for examining cognitive pro-cessing as response to both relevant and irrelevant stimuli. A total of 69 ERP recordings were analyzed in the research papers included in the Thesis, which comprises 20 chronic schizophrenia patients, 11 first episode patients and 38 healthy controls.
This Doctoral Thesis is focused on the study, design and application of biomedical signal processing methodologies in order to facilitate the understanding of cognitive pro-cesses altered by the schizophrenia. EEG data were examined using a two-level analysis: (i) local activation studies to quantify functional segregation of the brain network, by means of spectral analysis and by assessing neural source generators of P3a and P3b components; and (ii) EEG interactions studies to explore functional integration across brain regions, including pair-wise couplings and exploring hierarchical organization of neural rhythms.
Functional segregation aims to identify the brain areas dedicated to specific processing tasks. As a first step, spectral analysis of local activation was performed. Three local activation measures were computed: the relative power (RP) (i.e. the proportion of total power attributable to a given frequency band), the median frequency (MF) (i.e.
the frequency which comprises the 50% of the power) and the spectral entropy (SE) (i.e. a measure of the irregularity of the EEG data). RP analyses showed an increase of power from the baseline window to the response window for low frequency bands and a decrease for high frequency bands. Nevertheless, the changes were statistically significantly higher (p < 0.01) in controls than in patients. In addition, MF and SE revealed a widespread decrease from baseline to response window for healthy controls, whereas these changes were lower in schizophrenia patients. Our findings also suggested a statistically significantly larger (p <0.01) MF and SE decrease as a response to target
xii ABSTRACT
stimuli than as a response to distractor stimuli. Secondly, source imaging techniques were applied to detect neural generators that contribute to the scalp recorded ERP as a response to target (P3b) and distractor (P3a) tones. Our findings were consistent with previous reports, revealing a lower P3a and P3b source activation mainly in frontal and cingulate regions for schizophrenia patients than for healthy controls. Likewise, the intra-group differences between P3a and P3b were larger in patients than in controls, suggesting an inefficient hyperactivation during the processing of target stimuli.
On the other hand, functional integration evaluates the dependencies among brain areas. Functional neural coupling analyzes the statistical dependence between the neural activity at different EEG electrodes. In this study, three complementary functional con-nectivity measures (wavelet coherence (WC), phase-locking value (PLV) and Euclidean distance (ED)) were applied to analyze correlation, synchrony and similarity patterns. In comparison to healthy controls, schizophrenia patients are characterized by a lack of increase of coupling from baseline to response in the theta band and a lack of decrease for beta2 band. These findings suggested that schizophrenia patients failed to response to relevance (i.e. they are not able to change their connectivity patterns between the auditory response and pre-stimulus baseline). In addition, EEG rhythms in different frequency bands can interact with each other, which reflects the complex and hierar-chical organization of cognitive processes. This Doctoral Thesis evaluated event-related phase amplitude coupling (ERPAC), obtaining an association between alpha phase and gamma amplitude. Higher prevalence of alpha-to-gamma ERPAC after stimulus onset was found over central-parietal brain areas than over frontal and temporal brain regions. These findings could evidence the role of alpha rhythms as a core feature of cortical communication.
Contents
Abstract xi
List of Figures xvii
List of Tables xxiii
List of Acronyms xxv
1. Introduction 1
1.1. Introduction . . . 1
1.2. Context: Biomedical Engineering and neural signal processing . . . 1
1.3. Schizophrenia . . . 2
1.3.1. Aetiology . . . 3
1.3.2. Diagnosis . . . 6
1.3.3. Treatment . . . 6
1.3.4. Neurobiology and phenomenology in schizophrenia . . . 7
1.4. Electroencephalogram . . . 8
1.4.1. Neurophysiology . . . 8
1.4.2. Neural oscillations . . . 9
1.4.3. Cognitive electrophysiology . . . 11
1.4.4. Event-related potentials . . . 11
1.5. Hierarchical analysis of neural signals . . . 14
1.5.1. Time-frequency analysis of EEG oscillations in humans . . . 15
1.5.2. Local activation . . . 16
1.5.3. EEG interactions . . . 17
1.5.4. Network organization . . . 19
1.6. Doctoral Thesis overview . . . 19
2. Hypotheses and objectives 23 2.1. Introduction . . . 23
2.2. Hypotheses . . . 23
2.3. Objectives . . . 24
3. Decreased spectral entropy modulation in patients with schizophre-nia during a P300 task 27 3.1. Introduction . . . 28
3.2. Materials and methods . . . 29
3.2.1. Participants . . . 29
3.2.2. Electroencephalographic recording . . . 30
3.2.3. Spectral analysis and definition of parameters . . . 30
3.2.4. Spectral entropy . . . 31
xiv CONTENTS
3.2.5. Median frequency . . . 32
3.2.6. Relative power . . . 32
3.2.7. Parameter baseline correction . . . 32
3.2.8. Statistical analyses . . . 33
3.3. Results . . . 34
3.3.1. Spectral entropy . . . 34
3.3.2. Median frequency . . . 36
3.3.3. Relative power . . . 36
3.4. Discussion . . . 36
4. Decreased entropy modulation of EEG response to novelty and rele-vance in schizophrenia during a P300 task 41 4.1. Introduction . . . 42
4.2. Materials and methods . . . 43
4.2.1. Participants . . . 43
4.2.2. Electroencephalographic recording . . . 44
4.2.3. Spectral analysis and definition of parameters . . . 45
4.2.4. Spectral entropy . . . 45
4.2.5. Median frequency . . . 46
4.2.6. Parameter baseline correction . . . 46
4.2.7. Statistical analyses . . . 46
4.3. Results . . . 47
4.3.1. Within-group differences . . . 47
4.3.2. Differences between patients and controls . . . 48
4.3.3. Clinical relevance . . . 49
4.4. Discussion and conclusions . . . 50
5. Auditory P3a and P3b neural generators in schizophrenia: An adap-tive sLORETA P300 localization approach 53 5.1. Introduction . . . 54
5.2. Materials and methods . . . 55
5.2.1. Subjects . . . 55
5.2.2. EEG recording procedure . . . 55
5.2.3. Identification of ERP components . . . 56
5.2.4. sLORETA . . . 57
5.2.5. Statistical analysis . . . 57
5.3. Results . . . 59
5.4. Discussion . . . 60
5.4.1. P3a and P3b neural generator patterns . . . 61
5.4.2. Between-group differences . . . 62
5.4.3. Limitations and future work . . . 64
5.4.4. Conclusions . . . 64
6. A comparative study of event-related coupling patterns during an auditory oddball task in schizophrenia 65 6.1. Introduction . . . 66
6.2. Materials . . . 68
6.2.1. Selection of subjects . . . 68
6.2.2. EEG recordings . . . 68
6.3. Methods . . . 69
CONTENTS xv
6.3.2. Connectivity, synchrony and similarity measures . . . 71
6.4. Results . . . 73
6.4.1. Global analysis . . . 73
6.4.2. Electrode coupling analyses . . . 73
6.5. Discussion . . . 76
6.5.1. Dynamical properties associated with schizophrenia . . . 76
6.5.2. Coupling changes pattern characterization . . . 79
6.5.3. Limitations of the study and future research lines . . . 80
6.6. Conclusions . . . 81
7. Investigating ERPAC patterns of brain activity: Evidence of alpha-to-gamma hierarchical organization elicited by an auditory oddball task 83 7.1. Introduction . . . 84
7.2. Materials and methods . . . 85
7.2.1. Participants . . . 85
7.2.2. EEG recordings . . . 86
7.2.3. EEG data analysis . . . 86
7.2.4. CFC analysis . . . 88
7.2.5. Statistical analysis . . . 93
7.3. Results . . . 93
7.3.1. Spectral features at the sensor-level . . . 93
7.3.2. ERPAC patterns: selection of LF and HF sub-bands of interest . . 94
7.3.3. ERPAC differences between schizophrenia patients and healthy controls . . . 94
7.4. Discussion . . . 95
7.4.1. Methodological event-related CFC assessment . . . 96
7.4.2. Characterization of time-varying CFC patterns . . . 98
7.4.3. Limitations of the study and future research lines . . . 100
7.5. Conclusions . . . 100
8. Discussion 101 8.1. Time-frequency characteristics of ERP data . . . 101
8.2. Neural source generator patterns . . . 102
8.3. Functional connectivity analysis . . . 103
8.4. Cross-frequency coupling patterns . . . 105
8.5. Understanding schizophrenia disease by means of EEG . . . 105
8.6. Limitations of the study . . . 107
9. Conclusions 109 9.1. Introduction . . . 109
9.2. Contributions . . . 109
9.3. Main conclusions of the study . . . 110
9.4. Future research lines . . . 111
Appendix A: Scientific production during this Doctoral Thesis 115 A.1. Papers indexed in the Journal Citation Reports . . . 115
A.2. Recent papers submitted . . . 116
A.3. International conferences . . . 116
A.4. National conferences . . . 118
xvi CONTENTS
Appendix B: Resumen en castellano 120
B.1. Introducción a la esquizofrenia. . . 121
B.2. Hipótesis y objetivos . . . 122
B.3. Materiales . . . 123
B.4. Métodos . . . 123
B.5. Resultados y discusión . . . 124
B.6. Conclusiones . . . 125
List of Figures
1.1. Relationship among diagnosis, aetiology and treatment of the schizophrenia. 4 1.2. Schizophrenia is a complex syndrome with no clear etiology. This figure
shows the relationship among schizophrenia causes, life course and diag-nosis. It includes before birth causes, such as the genetic load andin utero
biological and environmental risk factors. Four different phases has been identified in schizophrenia: (i) Premorbid phase is a period with a normal functioning; (ii) prodromal phase is characterized by signs and symptoms that precede full manifestation of schizophrenia; (iii) in the active phase, two or more symptoms must be present for at least one month period; and (iv) residual phase is a period of remission where symptoms are absent or no longer prominent. . . 5 1.3. International 10-20 EEG electrode location system for EEG recording.
Picture adapted from Jasper (1958). . . 9 1.4. Neurotransmission from pre-synaptic and post-synaptic neurons and
neu-ron synapsis. Figure obtained from (Carter et al., 2009). . . 10 1.5. Auditory ERP data analyses are divided into two different approaches:
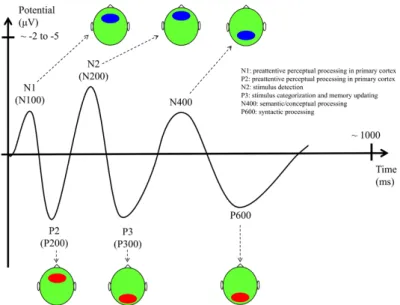
(i) evoked ERPs perform the domain averaging of ERP trials time-locked to a repetitive external event; and (ii) single-trial analyses assess time-frequency properties of each ERP trial. . . 13 1.6. Main ERP components with their functional interpretation, latencies, and
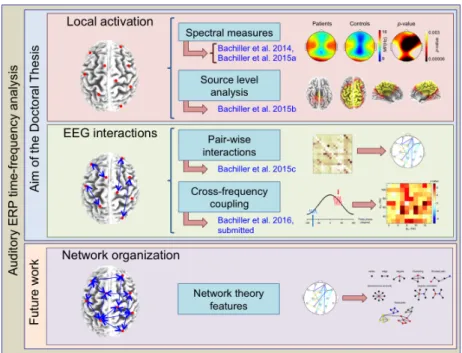
scalp topography (ellipses indicate the scalp location where the compo-nent has the largest amplitude. Red: positive potential. Blue: negative potential). Figure obtained from (Daltrozzo and Conway, 2014). . . 14 1.7. Hierarchical analysis of EEG data. A two-level of analysis has been applied
in this Doctoral Thesis, which characterizes: (i) functional segregation by means of local activation; and (ii) functional integration analyzing EEG interactions. A third level, which assesses the relationship between segregation and integration brain functions by means of complex network analysis, will be addressed in future studies. . . 15
3.1. Raw EEG trials from 17 acquisition electrodes (channels Fp1, Fp2, F3, F4, C3, C4, P3, P4, O1, O2, F7, F8, T5, T6, Fz, Pz and Cz) for: (a) a
patient with schizophrenia; and(b)a control participant. . . 31
3.2. Baseline SE (a) and MF (b) maps in the three groups. There were no significant differences at p < 0.05 level between patients and controls, between any group of patients and controls, or between patient subgroups.
CP chronic stable patients,MTP minimally treated patients,P patients;
C controls. . . 34
xviii LIST OF FIGURES
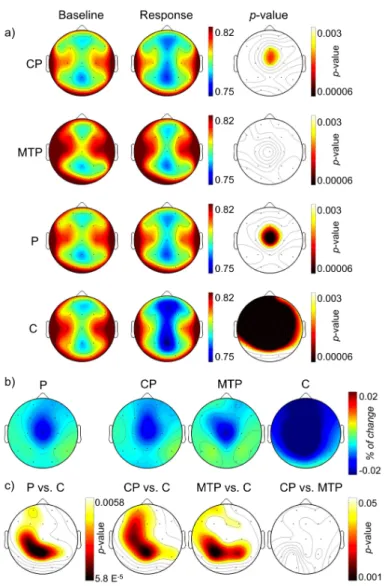
3.3. (a) SE maps at baseline and active window in the three groups (p val-ues of the within groups differences are shown in the right column); (b) maps depicting the difference between active and baseline SE values; (c) topographic maps depicting the statistical results of the between-groups differences between active and baseline variation of SE values. . . 35 3.4. (a) MF topographic maps at baseline and active window in the three
groups (values shown in Hz; p values of the within groups differences are shown in the right column); (b) maps depicting the difference between active and baseline MF values; (c)pvalues topographic maps depicting the significance of the between-groups differences between active and baseline variation of MF values. . . 37
4.1. SEtopographic maps for target (a, c) and distractor (b, d) stimuli. (a)SE
topographic maps at baseline, active response to target tone and within-groups statistical analyses; (b) SE topographic maps at baseline, active
response to distractor tone and within-groups statistical analyses; (c), (d)
topographic maps depicting the difference between active and baseline SE values for each group and between-groups statistical analyses for target and distractor tones, respectively. SE spectral entropy, P patients, CP
chronic patients,MTP minimally treated patients,C controls. . . 48 4.2. MF topographic maps for target (a, c) and distractor (b, d) stimuli. (a)
MF topographic maps at baseline, active response to target tone and within-groups statistical analyses; (b)MF topographic maps at baseline,
active response to distractor tone and within-groups statistical analyses; (c), (d) topographic maps depicting the difference between active and
baselineMF values for each group and between-groups statistical analyses for target and distractor tones, respectively. MF median frequency, P
patients,CPchronic patients,MTP minimally treated patients,C controls. 49 4.3. Comparison of the percent of change inSE (a) andMF (b) from baseline
to active window for each group. Each row depicts the averaged percent of change from baseline in each group for distractor and target tones, as well as the within-group differences between both conditions. SE spectral entropy,MF median frequency. . . 50 4.4. Scatterplots showing the association between SE changes in response to
distractor tones during a P300 task and positive (a) and total (b) PANSS
scores. SE changes represent the proportion of change ((SE active-SE
LIST OF FIGURES xix
5.1. Latency and adaptive WOI (aWOI) for each subject. Healthy controls were displayed at left column and schizophrenia patients at right column. A large latency andaWOI variability across subjects can be observed. (a)
P300 latency values (in seconds) are represented using a black "X" and
aWOI limits are depicted using an arrow. Each arrow represents a par-ticular subject (n = 38 for healthy controls andn = 31 for schizophrenia patients). They were sorted along Y-axis according to P300 response la-tency. Green arrows representaWOI limits for the two subjects displayed in the Figure 5.1c. (b) P300 aWOI density distribution for each group.
The bar plot displays a probability map for each group. It represents the percentage of subjects (in %) whose adaptiveWOI is considered for each post-stimulus time sample. (c) Baseline corrected ERP and 9-samples
moving average waveforms at Pz electrode for a healthy control (left) and a schizophrenia patient (right). The P300 and N200 components, as well as fixed WOI (fWOI) and aWOI ranges, are highlighted. In addition, the figure shows the comparison between the length of aWOI and conventional fWOI [250 550]ms post-stimulus. (d) sLORETA cortical current density maps are represented for: (i)aWOI; (ii) [250 550]msfWOI; (iii) [250 350] ms-window; (iv) [350 450] ms-window; (v) [450 550] ms-window. Source activity forfWOI is more distributed over the brain than foraWOI, since sLORETA averaging over afWOI includes some source information non-related to P300 component. Furthermore, detailed 100 ms-length window analyses show how the source density changes over time. . . 58 5.2. Grand-average of normalized cortical current density in healthy controls
(left) and schizophrenia patients (right) as a response to distractor (P3a) and target (P3b) tones. In order to reduce inter-subject variability, sLORETA current density at each voxel is normalized by the sum of current density across all voxels. Therefore, the sum of normalized voxel densities will be the unit. . . 59 5.3. Three dimensional sLORETA maps of voxel-by-voxel paired sample t
-statistics for healthy controls and schizophrenia patients. The cortical current density of P3b and P3a components is compared for each subject. The scale shows negative (blue) and positive (yellow) t-values for which alpha is statistically significant after voxel intensity NPT correction for multiple comparisons. An increase of P3b source activity from P3a is represented in yellow and vice versa. . . 60 5.4. Differences in brain activation patterns between schizophrenia patients
xx LIST OF FIGURES
6.1. Averaged raw ERP and scalograms at Pz electrode for: (a) a
schizophre-nia patient; (b) a healthy control. The schizophrenia patient shows the
wavelet energy concentrated in a narrow band at low frequencies. In ad-dition, the scalogram shows a decrease of energy in the stimulus response from baseline in this band. On the other hand, the control subject shows a less concentrated wavelet energy and exhibits a slight increase of energy in the response from baseline at low frequencies. The transparency outline represents the limits of the COI, where edge effects can be ignored. SCH,
schizophrenia. . . 71 6.2. Boxplots displaying couplingz-values averaged over all pairs of connections
at each frequency band. Positive values indicate an increase in the stimulus response compared to the baseline, whereas negative values indicate a decrease. (a) WC. (b) PLV. (c) ED. Statistical analyses were performed
using Mann–WhitneyU-tests (∗p<0.05,∗∗p<0.01). SCH, schizophrenia. 74
6.3. Spatial analyses ofθ-coupling between all pairs of electrodes for WC, PLV
and ED. Left and central columns depict z-values for schizophrenia
pa-tients and controls, where connections were only shown if they obtained statistically significant differences between the stimulus response and the baseline (Wilcoxon signed-rank test, z > 1.96; p <0.05). Right column
displays statistically significantp-values between-groups (Mann–Whitney
U-tests,α= 0.05). A color map was applied; in left and central columns,
hot colors are associated with a coupling increase during auditory response in comparison to baseline and cold ones are assigned to a decrease. In the right column, hot colors represent smaller z-values in schizophrenia pa-tients than controls and cold ones higherz-values in schizophrenia patients than controls. SCH, schizophrenia. . . 76
6.4. Spatial analyses of β2-coupling between all pairs of electrodes for WC,
PLV andED. Left and central columns depictz-values for schizophrenia
patients and controls, where connections were only shown if they obtained statistically significant differences between the stimulus response and the baseline (Wilcoxon signed-rank test, z > 1.96; p <0.05). Right column
displays statistically significantp-values between-groups (Mann–Whitney
U-tests,α= 0.05). A color map was applied; in left and central columns,
hot colors are associated with a coupling increase during auditory response in comparison to baseline and cold ones are assigned to a decrease. In the right column, hot colors represent smaller z-values in schizophrenia pa-tients than controls and cold ones higherz-values in schizophrenia patients than controls. SCH, schizophrenia. . . 77
6.5. Spatial analyses ofγ-coupling between all pairs of electrodes for WC, PLV
and ED. Left and central columns depict z-values for schizophrenia
pa-tients and controls, where connections were only shown if they obtained statistically significant differences between the stimulus response and the baseline (Wilcoxon signed-rank test, z > 1.96; p <0.05). Right column
displays statistically significantp-values between-groups (Mann–Whitney
U-tests,α= 0.05). A color map was applied; in left and central columns,
LIST OF FIGURES xxi
7.1. Grand-average time-frequency plots. Averaged raw EEG scalogram at electrode Pz for healthy controls group (A) and schizophrenia patients (B). The scalogram is divided into frequencies up to 30 Hz and the gamma range ([30 120] Hz). Wavelet energy is concentrated in a narrow band at low frequencies, which approximately corresponds to alpha band ([7 13] Hz). Wavelet scalogram and normalized power were obtained following the procedure described in (Bachiller et al., 2015b). . . 88 7.2. Analysis of spectral characteristics of EEG data. (A) Trial-averaged evoked
amplitude at Pz electrode for the whole spectrum ([1 120] Hz), and after a high-pass filtering process ([25 120] Hz). Remarked lines depict the average values of all subjects and the shaded areas represent their standard devi-ation. (B) Single-trial spectral power values at Pz electrode as a function of frequency for a period preceding (blue, [-500 0] ms) or following (red, [0 500] ms) the auditory stimulus onset. (C) Inter-trial phase coherence (ITPC) values at FCz electrode as a function of frequency for the same pre-stimulus baseline and response time windows. (D) Baseline corrected
ITPC changes over time for low frequencies ([5 8] Hz) at FCz electrode. Subjects were sorted based on the P300 latency (showed as a white mark). Non-statistically significant relationship was found between P300 latency and the time sample where the maximumITPC value occurs (Spearman’s rank correlation,R = 0.0227;p = 0.8320). . . 89 7.3. The algorithmic steps for PAC estimation. (A) Single-trial wave from the
cognitive response of a control subject. (B) Single-trial after applying a LF filter ([4 6] Hz). (C) Single-trial after applying a HF filter ([25 45] Hz) (blue line) and envelope of HF amplitude (dark line). (D) Single-trial after applying a LF filter (blue line) and LF phase obtained by means of Hilbert transform (green line). (E) HF envelope after applying a LF filter (blue line) and its phase obtained by means of Hilbert transform (red line). (F) LF phase (green line), HF phase (red line) and phase difference obtained by subtracting both phase waves (blue line). Phase difference is used to assess PLV-PAC. . . 92 7.4. Selection of LF and HF sub-bands of interest. Comodulograms show the
percentage of subjects whose surrogated ERPAC values were higher than their pixel-based statistics Z-threshold. It is also shown the evolution of comodulugrams along time. Only percentages higher than 40% are depicted. In order to facilitate the figure comprehension, comodulograms from only 10 channels were shown. These channels are representative from different brain regions and the two brain hemispheres. . . 95 7.5. Temporal evolution of topographical ERPAC patterns. Between-group
differences were assessed over [9 13] Hz and [17 53] Hz sub-bands of inter-est. The first and the second row depict surrogated ERPAC averages for healthy controls and schizophrenia patients, respectively. The third row summarizes statistically significantt-values between groups (permutation test with 1000 permutations, α = 0.05). A color map was applied. Hot
colors are associated with a higher ERPAC in controls than in schizophre-nia patients. On the contrary, cold ones depict higher ERPAC values in schizophrenia patients. Bold dots (·) indicate sensors showing statistically
xxii LIST OF FIGURES
List of Tables
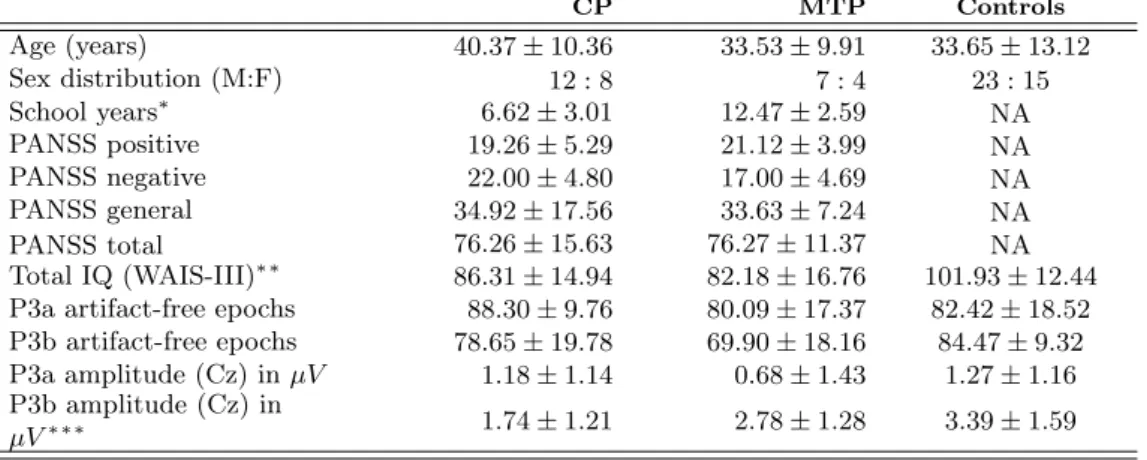
3.1. Demographic; clinical, cognitive and EEG parameters. Values are shown as mean (standard deviation, SD); P300 amplitudes are shown in microvolts;CP, chronic stable patients, MTP, minimally treated patients; NA not applica-ble. Significance of between-groups comparisons is shown in the first column (Kruskal-Wallis test,∗p <0.01;∗∗p <0.005;∗∗∗p <0.001) . . . 29
4.1. Demographic; clinical, cognitive and EEG parameters. Values are shown as mean (standard deviation, SD); P300 amplitudes are shown in microvolts (µV);
CP, chronic stable patients,MTP, minimally treated patients;NAnot applica-ble;M male;F female. Results of between-groups statistical analyses are shown in the first column (Kruskal-Wallis test,∗p<0.01;∗∗p <0.005;∗∗∗p <0.001) 44
5.1. Socio-demographic and clinical characteristics of the cohort of subjects enrolled in the study. Values are shown as "mean ±standard deviation, SD". Post-stimulus P300 latency was calculated over a target response using a 9-sample moving average. P3a and P3b amplitudes were obtained from distractor and tar-get responses, respectively. Significance of between-group comparisons is shown in the first column (Kruskal–Wallis test,∗p<0.05;∗∗p<0.001). aWOI adap-tive window of interest,CP chronic patients,MTP minimally treated patients,
M male,F female,NAnot applicable.. . . 56
5.2. Results of within-group (P3b vs P3a) analyses. Critical t-value (tcrit) was
esti-mated for each comparison applying a statistical threshold (p <0.01) to voxel intensity NPT. Gyrus and BA are only displayed when they obtained statisti-cally significant differences after multiple comparisons correction (voxel intensity NPT,t> tcrit). Bold names of gyrus and BA represent, respectively, the gyrus
and the BA that contain the maximum voxel statistical t-value. NS indicates that non-significant differences are found. . . 61
5.3. Results of between-group brain-source generator analyses. Cluster size NPT were carried out to obtain the critical size of the cluster of voxels and their associated statistical pcor value. Gyrus and BA are only displayed when they
obtained statistically significant differences after multiple comparisons correction (i.e. they formed a greater cluster of voxels than the critical size). Bold names of gyrus and BA represent, respectively, the gyrus and the BA that contain the maximum voxel statisticalt-value.NS indicates that non-significant differences are found. . . 62
6.1. Demographic and clinical characteristics. Values are shown as: mean±standard deviation, SD.NArepresentsnot applicable.. . . 69
6.2. Results of Wilcoxon signed-rank tests and Mann–WhitneyU-tests for the aver-aged coupling parameters. p-values have been FDR-corrected and statistically significant results (p <0.05) have been highlighted. . . 75
xxiv LIST OF TABLES
7.1. Demographic, clinical and behavioral characteristics. Values are shown as mean
±standard deviation, SD.NArepresentsnot applicable. CPZ stands for Chlor-promazine. . . 87
B1. Datos demográficos y clínicos de los sujetos de la base de datos, divididos en los grupos: pacientes crónicos (CP), pacientes minimamente tratados (MTP) y controles. Los valores se expresan como: media±desviación típica.. . . 123
B2. Datos demográficos y clínicos de los sujetos de la base de datos, divididos en los grupos pacientes crónicos (CP) y controles. Los valores se expresan como: media
Acronyms
AUC Area Under ROC Curve
BA Brodmann Area
BACS Brief Assessment of Cognition in Schizophrenia
CFC Cross-Frequency Coupling
COI Cone of Influence
COMT Catechol-O-Methytransferase
CP Chronic Patients
CWT Continuous Wavelet Transform
DNA Deoxyribonucleic Acid
DSM-IV-TR Diagnostic and Statistical Manual of Mental Disorders, Fourth Edition DSM-V Diagnostic and Statistical Manual of Mental Disorders, Fifth Edition
DTI Diffusion Tensor Imaging
ECoG Electrocorticography
ED Euclidean Distance
EEG Electroencephalography
ERP Event-Related Potentials
FDR False Discovery Rate
FIR Finite Impulse Response
fMRI Functional Magnetic Resonance Imaging
FT Fourier Transform
GABA Gamma-Aminobutyric Acid
GWAS Genome-Wide Association Studies
HF High-Frequencies
ICA Independent Component Analysis
IQ Intelligence Quotient
JCR Journal Citation Reports
K Potasium
LDA Linear Discriminant Analysis
LF Low-Frequencies
LFP Local Field Potentials
LOO-CV Leave-One-Out Cross-Validation
LORETA Low-Resolution Brain Electromagnetic Tomography
MEG Magnetoencephalography
MRI Magnetic Resonance Imaging
MTP Minimally Treated Patients
Na Sodium
NMDA N-methyl-D-aspartate
NPT Non-parametric Permutations Tests
PAC Phase-Amplitude Coupling
PANSS Positive and Negative Syndrome Scale
xxvi LIST OF TABLES
PLV Phase-Locking Value
PSD Power Spectral Density
ROC Receiver Operating Characteristics
RP Relative Power
SCH Schizophrenia
SE Shannon Entropy
SD Standard Deviation
sLORETA Standardized LORETA
STFT Short-Time Fourier Transform
TR-LCMV Time-reduction Region-suppression Linearly Constrained Minimum Variance WAIS-III Wechsler Adult Intelligence Scale third edition
WC Wavelet Coherence
WCS Wavelet Cross-Spectrum
Chapter 1
Introduction
1.1.
Introduction
Schizophrenia is still one of the most mysterious and costliest mental disorders in terms of human suffering and societal expenditure (van Os and Kapur, 2009). Active symptoms of schizophrenia typically emerge in late adolescence or early adulthood and may become a chronic condition. Thereby, it is considered a relevant socio-economic problem for health care systems.
The current Doctoral Thesis focuses on characterizing the neural dynamics underlying clinical manifestation and cognitive processing in schizophrenia by means of biomedical signal processing methodologies. This investigation has led to results published in jour-nals indexed in the Journal Citation Reports (JCR) from Thomson Reuters Web of Science™.
The thematic consistency of the articles included in the Doctoral Thesis is justified in this introductory Chapter. A brief introduction to Biomedical Engineering and neural signal processing can be also found. Moreover, there are sections devoted to explain schizophrenia characteristics, the electroencephalography (EEG) and event-related po-tentials (ERP). Finally, cognitive electrophysiology issue and the two-level hierarchical analysis of neural signals have been described.
1.2.
Context: Biomedical Engineering and neural signal
process-ing
The research field of this Doctoral Thesis is ’Biomedical Engineering’. Biomedical Engineering is an interdisciplinary field that focuses on altering, controlling, or under-standing biological systems by applying engineering principles (Bronzino, 2006). One of the greatest Biomedical Engineering benefits is the ability to identify issues and needs in healthcare systems. Hence, biomedical engineers apply engineering principles and methodologies to understand, model and solve problems associated with medicine and biology (Bronzino, 2006).
Among the different branches of expertise, this Doctoral Thesis is focused into the field of ’biomedical signal processing’ and particularly in ’neural signal processing’. Biomedi-cal signals are produced by biologiBiomedi-cal structures and systems (Cohen, 2000). Therefore, attending to their origin they can be classified into bioelectric, biomagnetic, bioacous-tic, biomechanical, biochemical, biooptical signals, among others (Sörnmo and Laguna, 2005). Usually, the information contained in biomedical signals is not directly
2 CHAPTER 1
pretable; hence, a processing stage is needed in order to obtain a meaningful measure of the data (Sörnmo and Laguna, 2005). Biomedical signal processing is essential to uncover signal components that may be very difficult, if not impossible, to observe by the naked eye (Sörnmo and Laguna, 2005). Signal processing techniques aim at reducing the noise present in the signals and the subjectivity of the manual measurements, as well as at increasing the reproducibility of the results (Sörnmo and Laguna, 2005). The biomedical signals that will be analyzed in this Doctoral Thesis are EEG recordings. These discrete signals reflect the electrical activity of the cerebral cortex by means of the recording of time-varying voltages on the human scalp.
This Doctoral Thesis aims at helping in the characterization of dynamical neural activity associated with the schizophrenia disorder. For this purpose, EEG data during the performance of an auditory cognitive task have been analyzed. Likewise, novel time-frequency signal processing techniques have been applied and assessed. Hence, all the above mentioned reflect the framework in which this Doctoral Thesis is encompassed. The next section introduces the schizophrenia and describes the aetiology and the treatment of this disorder.
1.3.
Schizophrenia
Schizophrenia is a disabling, chronic and severe mental illness characterized by dis-integration with the process of thinking, contact with reality and emotional responsive-ness (American Psychiatric Association, 2013). The syndrome of schizophrenia was first described in 1896 by the German physician Emil Kraepelin, as a global disruption in perceptual and cognitive functioning (Boyle, 2002). He named the disorder ’dementia praecox’ (early dementia) to distinguish it from other types of dementia that typically occur on elderly people (Boyle, 2002). Eugen Bleuler continued Kraepelin’s work and coined the term ’schizophrenia’ in 1911. The analysis of the psychopathological fea-tures of the schizophrenia suggests that the symptoms can be clustered into four main categories (van Os and Kapur, 2009):
i. Psychosis (including delusions and hallucinations – commonly known as positive
symptoms).
ii. Alterations in drive and willingness (lack of motivation, reduction in spontaneous
speech, social withdrawal – also known as negative symptoms).
iii. Alterations in neurocognition (difficulties in memory, attention and executive
func-tioning).
iv. Affective dysregulation (giving rise to depressive symptoms or to manic symptoms).
These symptoms are associated with a decrease in social and/or occupational functioning (American Psychiatric Association, 2013).
1.3 SCHIZOPHRENIA 3
Nevertheless, several studies have found a higher prevalence of schizophrenia in people with a low socioeconomic status, compared with a high socioeconomic status (Lewis and Lieberman, 2000).
The following subsections address the relationship among the aetiology, the diagno-sis and the treatment of the schizophrenia (Figure. 1.1). Firstly, the aetiology looks for a better understanding of the causes of schizophrenia; it appears that schizophrenia usually results from a complex interaction between biological and environmental fac-tors. Secondly, the identification of schizophrenia causes and symptoms is necessary to achieve a diagnosis. Finally, treatment subsection introduces pharmacologic treatments for schizophrenia.
1.3.1.
Aetiology
The aetiologyical mechanisms of schizophrenia remain unclear. Schizophrenia appears to be a polygenic disorder, which is associated with biological and environmental factors (Lewis and Lieberman, 2000). Biological models include among their causes a genetic hypothesis and a neurotransmitter dysfunction. In addition, several authors pointed out that environmental factors may also play a role in the pathogenesis of schizophrenia via subtle alterations of neurodevelopment (Howes et al., 2004; Lewis and Lieberman, 2000). Efforts to identify the pathophysiology of schizophrenia currently focus on several lines of research: (i) neuroanatomical and neurofunctional abnormalities; (ii) genes that confer susceptibility to schizophrenia and epigenomics studies; (iii) celular and immunological alterations; (iv) environmental risk factors; (v) neuropsychological disorders; and (vi) the mechanism of action of drugs that relieve symptoms (Orellana and Slachevsky, 2013).
In the next subsections, these different schizophrenia factors are further developed. Figure. 1.2 shows the relationship among these schizophrenia causes, life course and their diagnosis.
1.3.1.1. Genetic hypothesis
Genetic studies have consistently demonstrated that hereditary factors play a very important role in major psychosis (Petronis, 2004). Specifically, family, twin and adop-tion studies have demonstrated that the morbid risk of schizophrenia correlates with the degree of shared genes (i.e. the closer family degree, the higher incidence of schizophre-nia) (Jablensky, 2006; Lewis and Lieberman, 2000). In this regard, the heritability (i.e.
genetic contribution to the phenotypic variance observed) is generally accepted to be in the range of 64-81% (Lichtenstein et al., 2009; Sullivan et al., 2003). In the last years, genome-wide association studies (GWAS) of schizophrenia further have examined the genetic profile associated to psychotic disorders. GWAS are an important tool for un-derstanding the biological underpinnings of schizophrenia, they allow to associate several genes or loci with the schizophrenia. A recent and relevant GWAS study identified 108 loci that met genome-wide significance (Ripke et al., 2014). This study suggested that between half to a third of the genetic risk of schizophrenia is indexed by common alleles genotyped by the GWAS (Ripke et al., 2014).
4 CHAPTER 1
Figure 1.1: Relationship among diagnosis, aetiology and treatment of the schizophrenia.
real effect of epigenetic factors in schizophrenia is unknown, several studies have focused on the possibility of an epigenetic contribution to schizophrenia (Roth et al., 2009).
1.3.1.2. Neurotransmitter dysfunction hypotheses
This model focuses on chemical transmission, mainly in the prefrontal cortex, hip-pocampus and temporal lobes of the brain. Currently, there are three major neuro-chemical models for the schizophrenia: the dopaminergic, glutamatergic and GABAergic (Javitt and Sweet, 2015).
i. Dopamine has been widely regarded as an important neurotransmitter in
schizophre-nia (Stone et al., 2007). Salience attribution theory suggested that a dysregulation of dopaminergic neurons could underlie hallucinations and delusions in schizophre-nia, through the aberrant attribution of abnormal salience to normal internal and external events (Heinz and Schlagenhauf, 2010; Kapur, 2003). The dopamine hy-pothesis of schizophrenia is the principal explanatory model of antipsychotic drug action. In order to reduce psychotic symptoms, antipsychotic drugs block dopamine receptors, specifically D2 receptors (Carlsson et al., 2004).
ii. Glutamate receptors are also considered to play a role in cortico-cortical
interac-tions and communication. Glutamatergic models relate schizophrenia symptoms to neurocognitive deficits by blocking neurotransmission at NMDA (N-methyl-D-aspartate) receptors (Javitt and Sweet, 2015; Stone et al., 2007). Increased prefrontal glutamate concentrations have been also associated with poorer global functioning and may show a disconnection in cortical communication in schizophrenia (Friston, 1998).
iii. The inhibitory neurotransmitter gamma-aminobutyric acid (GABA) has been
1.3 SCHIZOPHRENIA 5
Figure 1.2: Schizophrenia is a complex syndrome with no clear etiology. This figure shows the relationship among schizophrenia causes, life course and diagnosis. It includes before birth causes, such as the genetic load and in utero biological and environmental risk factors. Four different phases has been identified in schizophrenia: (i) Premorbid phase is a period with a normal functioning; (ii) prodromal phase is characterized by signs and symptoms that precede full manifestation of schizophrenia; (iii) in the active phase, two or more symptoms must be present for at least one month period; and (iv) residual phase is a period of remission where symptoms are absent or no longer prominent.
1.3.1.3. Executive function failure hypothesis
The executive function is a set of abilities, which allows us to invoke voluntary control of our behavioural responses (Orellana and Slachevsky, 2013). These functions enable human beings to develop and carry out several functions, such as plans, make up analo-gies, obey social rules, solve problems, adapt to unexpected circumstances, do many tasks simultaneously or locate episodes in time and place (Orellana and Slachevsky, 2013).
Neuropsychological and neurocognitive paradigms implement experimental and clini-cal tests to better characterize cognitive abnormalities. They are increasingly being used to identify dysfunctional structures and brain systems that underlie cognitive and behav-ioral disorders of schizophrenia (Orellana and Slachevsky, 2013). It is possible to identify central cognitive deficits by studying how schizophrenia patients perform on neurocogni-tive tests. It may explain a significant proportion of the social and vocational morbidity of this disorder (Orellana and Slachevsky, 2013).
Impairment of executive function is one of the most commonly observed deficits in schizophrenia. Besides, the disorders detected by executive tests are consistent with evidences obtained from functional neuroimaging. They have shown a dorsolateral pre-frontal cortex dysfunction in schizophrenia patients while performing several cognitive tasks (Orellana and Slachevsky, 2013). In particular, it has been suggested that executive function impairments are associated with negative schizophrenic symptoms (Freedman and Brown, 2011).
1.3.1.4. Environmental factors
The concordance rate among identical monozygotic twins for schizophrenia is high (∼50%), suggesting that this disorder has a strong genetic component (Javitt and Sweet,
6 CHAPTER 1
gestation or childhood, obstetric complications or cannabis consumption are more com-mon in people with schizophrenia than in the general population (Howes et al., 2004). Moreover, maturational processes occurring in the postnatal period through adolescence (i.e. apoptosis, synaptic pruning and myelination) may unmask the genetic vulnerability to schizophrenia (Lewis and Lieberman, 2000).
As a conclusion, diverse studies suggest that the aetiology of schizophrenia involves the interaction of many factors. It is probably caused by the interaction of predisposing genes and hazardous environmental factors (Petronis, 2004). Stress in adolescence or early adulthood, such as drug use or social isolation, may interact to cause neurodevel-opmental impairments leading to schizophrenia (Broome et al., 2005). A basic knowledge of schizophrenia causes helps into the identification of its signs and symptoms in order to achieve a diagnosis.
1.3.2.
Diagnosis
Schizophrenia essentially represents a broad clinical entity defined by subjective symp-toms, behavioural signs and patterns of course (Jablensky, 2006). Currently, the diag-nosis of schizophrenia is based on criteria from the American Psychiatric Association’s Diagnostic and Statistical Manual of Mental Disorders (DSM) (American Psychiatric Association, 2013). These criteria take into account the self-reported experiences of the individual, and a clinical assessment by a mental health professional. For diagnosis, psychotic symptoms (i.e. delusions, hallucinations, disorganized speech, grossly disorga-nized or catatonic behavior or negative symptoms) must have been significantly present for at least one month, with some indication of the disorder having been present for a six month period. A diagnosis of schizophrenia should not be made if the symptoms are not better accounted for a schizoaffective disorder, a mood disorder with psychotic features, or by the physiological effects of a substance or medical disorder (American Psychiatric Association, 2013).
The symptoms of schizophrenia span a wide range of psychopathology and can display an interindividual variability and temporal inconsistency (Jablensky, 2006). Therefore, different subtypes of schizophrenia could be delineated based on clinical features, sta-tistically derived subtypes, putative genetic indicators and endophenotypes (Jablensky, 2006).
It is well established that there is a ’prodromal phase’ (i.e. a period during which specific symptoms are present before a diagnosis has been made). During this phase, schizophrenia patients exhibit specific behavioral and cognitive characteristics that are considered precursors of an psychosis episode (Klosterkötter et al., 2001; Yung and McGorry, 1996). Early symptoms include reduced concentration and attention, de-pressed mood, brief psychotic symptoms and sleep disturbance (Yung and McGorry, 1996). Once diagnosed with schizophrenia, the long-term prognosis of the disorder is diverse. Schizophrenia patients could have a remission that is followed by relapse peri-ods, remission with no further relapse, or have no remission at all (American Psychiatric Association, 2013).
1.3.3.
Treatment
1.3 SCHIZOPHRENIA 7
symptoms. Pharmacologic treatments for schizophrenia and bipolar disorder have been available since the 1950s. Early medications, also known as ’typical’ antipsychotics (e.g. chlorpromazine and haloperidol), were based on dopamine antagonism (Edwards and Smith, 2009). Nevertheless, they introduced problems related to tolerability, including tardive dyskinesia and extrapyramidal motor side-effects (Patterson and Leeuwenkamp, 2008). ’Atypical’ antipsychotics represented a significant improvement over first genera-tion antipsychotics. These include drugs such as risperidone, olanzapine, clozapine and quetiapine (Patterson and Leeuwenkamp, 2008). They are at least as effective as typical antipsychotics, controlling acute psychotic symptoms and having lower propensity for inducing some types of adverse events, such as extrapyramidal symptoms or elevation of prolactin levels (Kapur and Remington, 2001; Patterson and Leeuwenkamp, 2008). Nevertheless, they tend to have metabolic side-effects, such as weigh gain and increasing triglycerides and choresterol (Kapur and Remington, 2001). Finally, it is well known that schizophrenia patients respond in different ways to antipsychotic medications. Hence, medical and patients usually work together to find the most adequate medication, as well as the right dose. With medication and psychosocial therapy, many schizophrenia patients are able to control their symptoms, gain greater independence and lead fulfilling lives (Buckley, 2008).
1.3.4.
Neurobiology and phenomenology in schizophrenia
Kapur (2003) proposed a heuristic framework for linking the neurobiology (brain), the phenomenological experience (mind) and the pharmacological aspects of schizophrenia. Aberrant salience hypothesis relates schizophrenia to an aberrant assignment of salience to external objects and internal representations (Kapur, 2003). During the performance of a cognitive task, schizophrenia patients tend to pay more attention to non-salient events and less to salient events. It shows the central role of dopamine to mediate the salience of environmental events and internal representations, suggesting a dopamine hypothesis of antipsychotic action (Kapur, 2003).
In addittion, schizophrenia has been identified as a dysconnection syndrome, which is associated with a reduced capacity to integrate information among different brain regions (Friston, 1998; Stephan et al., 2009). Friston et al. (2016) have revisited the definition of dysconnection hyphothesis, trying to establish a link between the symptoms and signs of schizophrenia and the underlying neuronal pathophysiology. Both theories are related, an aberrant neuromodulation of synaptic activity mediates the influence of intrinsic and extrinsic connectivity (Friston et al., 2016). Relevance attribution likely involves diverse cerebral regions and their interconnections. As a consequence, many efforts have been devoted to identifying abnormalities in the cortical connections and their relation to schizophenia symptoms and cognitive performance (Uhlhaas and Singer, 2010).
In summary, we hypothesized that schizophrenia patients would show a failure to contextualize stimulus processing through a failure to optimize the synchronous gain of neuronal populations, leading to a functional disintegration or disconnection (Bachiller et al., 2015b). The physiological correlates of this disconnection would be expressed in terms of a failure to modulate synchronous activity; particularly when asked to attend to target stimuli (Friston et al., 2016).
8 CHAPTER 1
1.4.
Electroencephalogram
The human brain is a very complex structure formed by millions of interconnected neurons that communicate via electric impulses. Many neurons firing in sequence are able to generate an electric field strong enough to be measurable by scalp electrodes, producing the EEG signal (Nunez and Srinivasan, 1981). Therefore, EEG is the measurement of time-varying voltages on the human scalp generated by the electrical activity of the brain, especially in the cerebral cortex (Nunez and Srinivasan, 1981). Brain electrical activity was firstly measured by the German neurologist Hans Berger in the 1920’s. He observed rhythmic fluctuations of around 10 cycles per second (i.e. 10 Hz). Since then, EEG has been enhanced as a clinical tool; allowing its use in the study of brain pathologies (such as Alzheimer disease, epilepsy or schizophrenia), sleep disorders and disorders of the nervous system (Jeong, 2004; Merica et al., 1998; Roach and Mathalon, 2008; Salinsky et al., 1987).
The recorded EEG is the summation of the electrical activity primarily from groups of pyramidal neurons, which provides a sample of temporal brain activity (Olejniczak, 2006). EEG measures electric potential differences between pairs of scalp electrodes placed generally in an elastic cap with uniform coverage of the entire scalp. Recording protocols usually follow the International 10-20 system (Figure. 1.3). It is the accepted instrumentation standard for scalp electrode placement (Jasper, 1958).
EEG is a good tool for studying neurocognitive processes, since it provides a high temporal resolution, within the millisecond range. It allows to capture cognitive dynamics in the time frame in which cognition occurs (Cohen, 2014). However, the electrical activity generated by the cortex is partially distorted as it passes through the cortex, meninges and skull; hence, EEG data have small amplitudes and are spatially poorly localized (Wang, 2010). Better measurements could be obtained invasively using subdural electrocorticogram (ECoG), with the electrodes directly placed on the cortical surface, or mesoscopic local field potential (LFP), where electrodes are inserted deep into the brain (Wang, 2010). EEG signal provides multidimensional information useful to characterize neural processes (i.e. it comprises information in at least five dimensions: time, space, frequency, magnitude and phase) (Cohen, 2014). In comparison to brain-imaging tools, such as MRI, EEG allows to assess directly neurocognitive processes (Cohen, 2014). The oscillations that can be observed in the EEG signal reflect neural oscillations in the cortex. On the other hand, brain-imaging techniques do not directly measure neural events, but they are well suited for studies in which precise spatial localization are important (Cohen, 2014).
The next subsections further characterize the EEG signal. Firstly, section 1.4.1 ad-dresses the neurophysiology (i.e. the study of the functioning of the nervous system). Secondly, the main mechanism for enabling coordinated activity during normal brain functioning was assessed: the neural oscillations. Then, cognitive electrophysiology sec-tion examines how neural oscillasec-tions are related to cognisec-tion and behavior. Finally, section 1.4.4 depicts event-related potentials (ERP), distinguishing between two main approaches: (i) evoked potentials and (ii) single-trial analysis.
1.4.1.
Neurophysiology
1.4 ELECTROENCEPHALOGRAM 9
Figure 1.3: International 10-20 EEG electrode location system for EEG recording. Pic-ture adapted from Jasper (1958).
approximately -70 mV (Kandel et al., 1991).
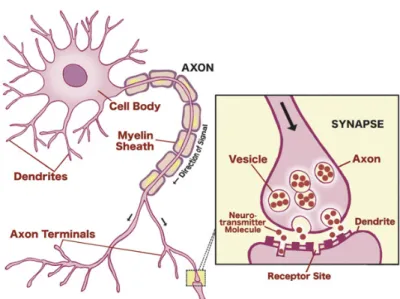
Communication among neurons is elicited by electrochemical processes underlying the generation of ’action potentials’, which consist on a rapid swing of the polarity across the neuron membrane. A synapse is a region where nerve impulses are transmitted and recieved. It can be observed in the junction between the axon terminals of a pre-synaptic neuron and a dendrite of a post-synaptic neuron. When an action potential reaches a synapse, it triggers the release of neurotransmitters that bind to the receptors of a post-synaptic neuron (Figure 1.4). Neurotransmitters can change the permeability of the membrane by means of a flow of sodium (Na+) and potassium (K+) ions. Post-synaptic potentials can be excitatory or inhibitory (Kandel et al., 1991):
If the neurotransmitter is excitatory (e.g. amino acid glutamate), positive ions flow from the post-synaptic neuron to the environment. It causes a reduction of the membrane potential (depolarization).
If the neurotransmitter is inhibitory (e.g. GABA), positive ions flow from the environment to the post-synaptic neuron. It causes an increase of the membrane potential (hyperpolarization).
These action potentials are the primary origins for the EEG recorded on the scalp. EEG reflects the degree of simultaneous activation of millions of local neurons in the cortex. In detail, it is the summation of synchronized synaptic activation from pyrami-dal neurons that have long straight dendrites perpendicular to the surface of the cortex (Olejniczak, 2006; Wang, 2010). Therefore, larger amplitudes in the EEG indicate a synchronous rhythmic activity in a local brain area (Lopes da Silva, 2013).
1.4.2.
Neural oscillations
10 CHAPTER 1
Figure 1.4: Neurotransmission from pre-synaptic and post-synaptic neurons and neuron synapsis. Figure obtained from (Carter et al., 2009).
Delta band (δ, 1-4 Hz): High-amplitude waves typically found in deep slow wave
sleep. Delta activity is mainly observed in the frontal regions in adults.
Theta band (θ, 4-8 Hz): It is associated with drowsiness and is enhanced during
sleep. Theta rhythms are found in the frontal midline region and they have been associated with inhibition of elicited responses.
Alpha band (α, 8-13 Hz): It is the predominant rhythm in awaked subjects in
a relaxed or reflected state, especially under eyes closed conditions. They are most pronounced in the posterior and occipital regions. Alpha rhythms have been related to inhibition control. They reflect the timing inhibitory activity in different locations across the brain.
Beta band (β, 13-30 Hz): It shows reduced amplitudes as compared to alpha waves.
Beta rhythms are associated with states of active concentration, anxiety or tension. They are exhibited symmetrically at both sides of the brain, they are most pro-nounced in the frontal regions. Beta band is commonly divided into β1 and β2 sub-bands, that include the frequency ranges 13-19 Hz and 19-30 Hz, respectively. Gamma band (γ, > 30 Hz): It is associated with an active processing of information
in the cortex. Gamma rhythms are most pronounced near the somatosensory cortex during multi-modal sensory processing, involving the linking of multiple sensations or memories.
1.4 ELECTROENCEPHALOGRAM 11
1.4.3.
Cognitive electrophysiology
Scientists have expressed skepticism about the usefulness of brain oscillations and EEG rhythmic activities in advancing the understanding of brain processes underlying cognitive functions (Lopes da Silva, 2013; Sejnowski and Paulsen, 2006). However, exper-imental evidences support the statement that scalp electrical signals reflect well-defined neurophysiological mechanisms that are relevant to understand how cognitive processes emerge (Lopes da Silva, 2013). Cognitive electrophysiology is a field that investigates the relationship between the brain rhythms and cognition (i.e. it links neuroscience and psychology). It focuses on understanding how cognitive functions (perception, memory, language, emotions, behavior control or social cognition) are supported or implemented by the electrical activity produced by populations of neurons (Cohen and Gulbinaite, 2014). Cognitive electrophysiology is a broad field of research that includes a wide range of objectives. From the point of view of cognitive processes, the electrophysiology is a useful tool for transient dissociating cognitive processes and their subcomponents. In this regard, the main objective is to understand the cognitive components of behavior rather than the physiological properties of the brain (Cohen, 2014). On the contrary, cognitive paradigms can be used as a useful tool to elicit specific patterns of neural activity. In this case, the ultimate goal of the research is to understand how the brain works rather than to dissect components of behaviour (Cohen, 2014). Both issues should be jointly addressed in order to avoid misunderstandings.
The mathematical development of time-frequency based data analyses has contributed to advance beyond the understanding of the neurophysiological events. Nevertheless, a better understanding of the neurophysiological processes that underlie the time-frequency features observed in scalp neural data would require complementary methodological ap-proaches, such as simultaneous invasive and non-invasive recordings or MRI analysis (Cohen and Gulbinaite, 2014). Future complementary studies will allow linking the ac-tivity at the level of individual neurons and populations of neurons recorded at scalp EEG.
In this Doctoral Thesis, event-related potentials (ERP) analyses are used to gain further insights into the neural mechanisms underlying cognitive dysfunctions (Uhlhaas et al., 2008). ERP coupling patterns based on time-frequency representations could provide a more sensitive measure to describe schizophrenia alterations than resting-state EEG analysis (Uhlhaas, 2013; Uhlhaas and Singer, 2006).
1.4.4.
Event-related potentials
Event-related potentials (ERPs) provide a safe and non-invasive method for explor-ing the psychophysiological correlates of mental processes. ERPs are very small voltages recorded from the scalp, which are originated in the brain structures as a response to specific sensory, cognitive or motor events. They appear as a series of peaks and troughs interspersed in EEG waves (Huang et al., 2015). Experimentally, their basic function is to observe the transient changes in neural activity of the cortex, as a function of sensory stimulation or internal event processing. Thus, ERPs are considered to be indicative of the role of different cortical areas to various sensory or behavioural functions (Nieder-meyer and Lopes da Silva, 2005).
char-12 CHAPTER 1
acteristics change as a function of engagement in task events). In detail, phase-locked activity (also called ’evoked’) is phase aligned with the event onset. It can be observed both in time-domain averaging and in time-frequency-domain averaging representations. On the other hand, non-phase-locked activity (also known as ’induced’) is time-locked but not phase-locked to the event onset. Therefore, it is observed in time-frequency-domain averaging but not in time-time-frequency-domain averaging (Cohen, 2014; Roach and Mathalon, 2008).
A large debate has been developed to investigate the neurophysiological mechanisms that produce ERPs. David et al. (2006) suggested that ERPs are formed through complex additive and nonlinear effects. Other models proposed that ERPs are the result from an alignment of the phases of ongoing oscillations (Makeig et al., 2002), or that ERPs are an amplitude asymmetry in the EEG oscillations (Mazaheri and Jensen, 2008). One issue that complicates matters is that different ERP components may have different neural origins; hence, it is not possible to achieve a unique explanation that includes the underlying mechanisms involved in the generation of all ERP components (Cohen, 2014). Figure 1.5 shows how traditional analyses of ERP data are divided into two different approaches: (i) time-domain analysis where evoked ERP is obtained, and (ii) time-frequency-domain analysis, which is performed over single-trial ERP data.
1.4.4.1. Time-averaging auditory evoked potentials
The time-domain approach obtains an evoked ERP wave as the average of a set of data epochs or trials time-locked to repetitive external events. As a result of averaging across a large number of trials, the background and non-phase-locked activity in the EEG cancels out and, thus, evoked ERPs are positive or negative voltage deflections that survive this averaging process (Roach and Mathalon, 2008). The traditional view of ERP assumes that averaged ERPs reflect transient bursts of neuronal activity time-locked to an external event (Makeig et al., 2004). Nevertheless, it could arise from one or more neural generators. The neural generators of ERP components remain imprecisely delineated, although appreciable progress has been carried out in the last years (Huang et al., 2015).
There are several cognitive tasks for evaluating brain responses, including auditory paradigms. In this regard, auditory oddball paradigm is a common experimental design used in ERP analyses to obtain a meaningful measure of cognitive function. Different components have been established on time-averaging auditory evoked ERPs, such as P50, N100, N200 and P300 components (Figure 1.6). The most extensively explored evoked ERP component in investigations of cognitive functions is the P300 wave (Huang et al., 2015). It is described as a positive deflection, which reaches its peak amplitude around 300 ms after stimulus onset. The P300 component mainly appears over superior temporal and parietal cortex and it has been associated with several processes, such as attention, relevance and memory (Polich, 2007). P300 wave includes two components: the P3a, elicited by distractor stimuli for which no subject-response is expected; and the P3b, evoked by target stimuli for which the subject is instructed to respond. Both P300 waves were traditionally assessed by means of their amplitude (the maximum evoked ERP voltage) and latency (the delay between stimulus onset and the time course of P300) (Polich, 2007).
1.4 ELECTROENCEPHALOGRAM 13
Figure 1.5: Auditory ERP data analyses are divided into two different approaches: (i) evoked ERPs perform the time-domain averaging of ERP trials time-locked to a repetitive external event; and (ii) single-trial analyses assess time-frequency properties of each ERP trial.
Strobel et al., 2008; Sumiyoshi et al., 2009; Volpe et al., 2007). In detail, the neural generators of two P300 components: the P3a, evoked by distractor stimuli for which no subject-response is expected; and the P3b, elicited by target stimuli for which the subject is instructed to respond were evaluated in this Doctoral Thesis (Bachiller et al., 2015c).
1.4.4.2. Single-trial analysis
The examination of time-averaging evoked ERPs has provided useful insights into the nature and timing of neuronal events that subserve sensory, perceptual and cogni-tive processes. Nevertheless, the whole ERP data have received relacogni-tively less attention (Roach and Mathalon, 2008). Time-frequency domain approach assesses the changes in the frequency power spectrum of the whole ERP data time-locked to the same external events (Makeig et al., 2004). Time-frequency analyses provide additional information about neural synchrony not apparent in the evoked ERPs (Makeig et al., 2004). In de-tail, they allow to view the brain as a parallel processor of information, with oscillations at multiple frequencies reflecting various neural processes co-occurring and interacting (Lisman and Buzsaki, 2008). Therefore, they may provide a greater sensitivity to the true nature of the neuropathophysiological processes underlying schizophrenia (Roach and Mathalon, 2008).