;
Forest management options for carbon stock and soil
reha-bilitation in Chilimo dry afro-montane forest, Ethiopia
DOCTORAL THESIS
Mehari Alebachew Tesfaye
ESCUELA TĖCNICA SUPERIOR DE INGENIERĺAS AGRARIAS
INSTITUTO UNIVERSITARIO DE INVESTIGACIȮN EN GESTIȮN
FORESTAL SOSTENIBLE
TESIS DOCTORAL:
FOREST MANAGEMENT OPTIONS FOR CARBON STOCK AND
SOIL REHABILITATION IN CHILIMO DRY AFRO-MONTANE
FOREST, ETHIOPIA
Presentada por Mehari Alebachew Tesfaye por optar al grado de
doc-tor por la Universidad de Valladolid
Dirigida por:
Dedication
ii
Table of contents
Contents
LIST OF ORIGINAL WORKS ... 1
ACKNOWLEDGEMENTS ... 3
ABSTRACT ... 5
RESUMEN ... 9
1. INTRODUCTION ... 13
1.1. African forest resources, the case of Ethiopia ... 13
1.1.1. Ethiopian forests ... 15
1.3. Carbon stock in tropical and Ethiopian forests ... 20
1.4. Chilimo dry afro-montane forest of Ethiopia ... 23
1.5. Forest management tools available for African tropical forests ... 26
2. OBJECTIVES OF THE THESIS ... 27
2.1. Aims and specific objectives... 27
2.2. Conceptual model ... 29
3. MATERIAL AND METHODS ... 33
3.1. Study sites ... 33
3.2. Experimental design and sampling ... 34
3.3. Data gathering ... 35
3.3.1. Tree data ... 35
3.3.2. Biomass data ... 37
3.3.3 Coarse wood debris and stump data collection ... 38
3.3.4. Soil data (study I and study III) ... 38
3.3.5. Wood density and carbon concentration (study V) ... 39
3.4. Laboratory methods ... 40
3.4.1. Soil analysis ... 40
3.4.2. Wood density and carbon concentration... 41
3.5. Statistical analysis ... 42
3.5.1. Mixed models ... 42
3.5.2. General linear models ... 43
3.5.3. R- software ... 44
4. RESULTS ... 47
4.2. Biomass model, partitioning and comparison (study II) ... 54
4.3. SOC and SON concentration and bulk density along elevation, land use and species (study III) ... 55
4.4. Stand density management model evaluation and fitting (study IV) ... 57
4.5. Carbon concentration and wood density for five most commonly tree species (study V) ... 58
5. DISCUSSION ... 61
5.1. Performance and soil condition of selected species in degraded highlands of Ethiopia (study I) ... 62
5.2. Biomass model, partitioning and comparison (study II) ... 64
5.3. SOC and SON concentration and bulk density along elevation gradient, land use and species (study III) ... 65
5.4. Stand density management model evaluation and fitting (study IV) ... 68
5.5. Carbon concentration and wood density for five most commonly tree species (study V) ... 68
6. GENERAL CONCLUSIONS ... 73
6. CONCLUSIONES GENERALES ... 75
REFERENCES ... 77
Sas codes used for data analysis ... 102
Study I ... 127
Selection of tree species and soil management for simultaneous fuelwood production and soil rehabilitation in the Ethiopian Central Highlands ... 127
Abstract ... 127
Introduction ... 128
Material and Methods ... 129
Results ... 135
Discussion... 148
Conclusions ... 152
Acknowledgements ... 153
References ... 153
Study II ... 163
Aboveground biomass equations for sustainable production of fuel wood in a native dry tropical afro-montane forest of Ethiopia ... 163
Abstract ... 163
Introduction ... 164
Material and Methods ... 166
Results ... 173
iv
Conclusions ... 182
Acknowledgements ... 183
References ... 183
Study III ... 191
Impact of changes in land use, species and elevation on soil organic carbon and total nitrogen in Ethiopian Central Highlands ... 191
Abstract ... 191
Introduction ... 192
Material and Methods ... 194
Results ... 200
Discussion ... 210
Conclusions ... 214
Acknowledgements ... 214
References ... 215
Study IV ... 223
Stand density management diagram for Chilimo dry afro-montane forest using species proportion in Central Highlands of Ethiopia ... 223
Abstract ... 223
Introduction ... 224
Material and Methods ... 225
Results ... 230
Discussion ... 239
Conclusions ... 241
Acknowledgements ... 241
References ... 242
Study V ... 247
Variation in carbon concentration and wood density for five most commonly grown tree species in Ethiopia ... 247
Abstract ... 247
Introduction ... 248
Material and Methods ... 250
Results ... 253
Discussion ... 262
Acknowledgements ... 265
LIST OF ORIGINAL WORKS
This thesis is based on five original works which are presented in the text with Roman nu-merals (I, II, III, IV, V) i.e. one published, one accepted with major revision, one submitted and two manuscripts.
I. Tesfaye, A. Mehari, Bravo-Oviedo, A., Bravo, F., Kidane, B., Bekele, K., Sertse, D., 2014. Selec-tion of tree species and soil management for simultaneous fuelwood producSelec-tion and soil rehabili-tation in the Ethiopian Central Highlands. Land Degradation & Development (2014). Doi: 10.1002/idr/.2268 (Wiley online library.com).
II. Tesfaye, A. Mehari, Ruiz-Peinado, R., Bravo-Oviedo, A., Bravo, F., 2014. Aboveground bio-mass equations for sustainable production of fuelwood in a native dry tropical afro-montane for-est of Ethiopia. Submitted to Annals of Forfor-est Science, Springer.
III. Tesfaye, A. Mehari, Bravo, F., Ruiz-Peinado, R., Pando, V., Bravo-Oviedo, A., 2015. Impact of changes in land use, species and elevation on soil organic carbon and total nitrogen in Ethiopi-an Central HighlEthiopi-ands. Accepted with major revision, Geoderma, Elsevier.
IV. Tesfaye, A. Mehari, Bravo, F., Bravo-Oviedo, A., 2015. Stand density management diagram for Chilimo dry afro-montane forest using species proportion in Central Highlands of Ethiopia. Manuscript.
ACKNOWLEDGEMENTS
This thesis is the results of many support and encouragement from many people. Then I would like to provide special thanks and appreciation for those people who helped me in all stages of my study. First of all, I would like to thank my major advisor Dr. Andrés Bravo Oviedo for ac-cepting me doing my PhD with you. Thank you for your enthusiasm, unreserved support and en-couragement. I learnt strength, carefulness and hardworking from you. Besides, I benefited a lot from your critical and stimulating comments at all stages of my study. Secondly, I would like to thank my co-advisor Prof. Dr. Felipe Bravo Oviedo for your continuous supervision, valuable ad-vice, comments, guidance and feedback throughout all my study. Besides, your office is always open for everybody and you have a solution for every problem. I would like to provide special thanks to Dr. Ricardo Ruiz-Peinado from INIA-Madrid for your valuable comment, advice and support to develop biomass equation models. I thank Dr. Valentín Pando from UVa-Palencia for your assisstance in statistical model selection and data analysis.
I would like to thank Spanish Agency for Development Cooperation (AECID) for giving me the scholarship to pursue my study and partial waiver for my field work in the home country and University of Valladolid for your enrollement and granting me the scholarship for six months. The Ethiopian Institute of Agricultural Research and Holetta Research Centre for letting me to continue my study, provided laboratory and vehicle facilities for my work and allowing my family staid in the center.
I would like also extend many thanks to staffs and students of University of Valladolid-Palencia: Dr. Pablo Martin Pinto, Celia Redondo, Dr. Julian Gonzalo, Dr. María José Fernández Nieto, Dr. Celia Herrero de Aza and Cristobal Ordóñez for your nice cooperation, faciliation and support to materialize my study. Lucia Risío,Wilson Lara, Irene Ruano, José Ríofrio, Dr. Encarna Rodríguez, Maria Hernández, Carmen Romeralo, Diana Bezos, Cristina Prieto, Jorge Aldea, Nicolás Cattaneo, Estela Sánchez, Pablo Martínez, Cristóbal Rullán and Adriana Olthoff for your unreserved cooperation, support and friendship during my study. I would like to thank my Ethiopi-an friends in UVa-Palencia: Temesgen Desalegne, Girma Hailemichael Ethiopi-and Tatek Dejene for your friendship, social life and encouragement.
Re-4
Adugna Wakjira Deputy Director General, EIAR-Addis Ababa and Dr. Aster Yohannes Centre Di-rector, Holetta Research Centre for your unreserved cooperation and support.
I thank to my former staffs of forestry research process: Dr. Yosef Amha, Tekle Hundessa, Balcha Regassa, Mestawet Teshome and Negash Eshete for your support in data collection and of-ficial facilitation. Soil and Water research process: Daniel Muletta, Geremew Taye, Tabote Daba, Alemayehu Terefe, Kebede Hailu, Kidiest Hailemichael, Bezaye Gorfu, Yohannes Habteyesus, Mi-hiretu Bedassa and Gemechu Amessa for analyzed my plant and soil samples. Administration staffs and drivers of Holetta Research Center: Melesse Zebre, Mekonnen T/Tsadik, Mesfin Sharew, Getu, Demelash Getachew, Alemayehu Belay, Fekadu Amsalu, Mahdere Tadesse, Almaze Geneti, Almaz Alabsie and Tesfaye Sodere for your nice cooperation, facilitation and assistance. Deriba Nigussie, Getachew Desalegne, Umer Sherif Mohammed, Dr. Shiferaw Alem, Dr. Abeje Eshete, Dr. Tesfaye Bekele and Mengiste Kindu from forestry research center (FRC) for your support, facilitation and cooperation. I thank staffs of Oromiya wild life and forest enterprise: Dida, Ararsa, Tesfaye, Diro, Battu Masqaluu, Fantu, Tilahun Gessesse, Shimelis Telila and Mossissa for allowing me to work in the Chilimo natural forest and let me to cut some sampled indigenous trees. I thank Mekonnen Ge-mencu, Mesfin Gemechu, Kebede Kefyalew and Solomon Gezu from Chilimo village for your sup-port in field data collection.
ABSTRACT
Five studies were conducted in Central Highlands of Ethiopia to generate alternative forest management options for carbon stock and soil rehabilitation in Chilimo dry afro-montane forest and adjacent land uses. A screening trial for fuel wood and rehabilitation of degraded lands was per-formed for four years (2005-2009) using: Acacia decurrens, Acacia saligna, Chamaecytisus pal-mensis, Dombeya torrida, Eucalyptus globulus, Grevillea robusta and Hagenia abyssinica under three soil management: control, manure and manure plus mulch. The experimental design was split plot, species as the main plot and treatments as subplot with three replicates. Data on survival rate, height growth and root collar diamater growth were taken annualy for selection experiment. Com-posite soil sampling was taken before and after intervension using augering method. Systematic random sampling technique was used for Chilimo natural forest under three forest patches: Chili-mo, Gaji and Gallessa. One time inventory was conducted using 35 sampling plots in Chilimo dry afro-montane mixed natural forest and 9 plots in plantation. Both biometric and soil sampling data were collected in these plots. Data required for aboveground biomass equation, carbon concentra-tion and wood density for Allophyllus abyssinicus, Olea europea ssp. cuspidiata, Olinia rochetiana,
Scolopia theifolia and Ruth glutinosa were generated using distructive sampling. Soil chemical ana-lyzed for % C, total N, P, K, Ca, Mg, pH and CEC following appropriate procedures. Carbon con-centration in the plant samples was estimated using ash method, while volume for wood density was estimated using water displacement method. Biomass equations found in the literature were selected, evaluated and fitted. A species propotion was calculated to develop stand density man-agement diagram for the Chilimo natural forest. A general linear model and general linear mixed model were used for data analysis with SAS software and graphing using R-software. Mean separa-tion was performed using Tukey-Kramer test. Among the six tested tree and one shrub species test-ed G. robusta A. Cunn. Ex R. Br. showed maximum survival (100 %) followed by H .abyssinica
8
RESUMEN
Se realizaron cinco estudios en la región Central HighlandEtiopía para generar alternativas de manejo forestal sostenible con los objetivos de secuestro de carbono y rehabilitación de suelos degradados en un bosque seco afro-montano. Se comparótambiénel efecto de cambio usos, en con-creto plantaciones y cultivos. El primer estudio (2005-2009) tuvo por objetivo la elección de espe-cies para producción de leñas y recuperación de suelo degradado. Las espeespe-cies utilizadas fueron A-cacia decurrens, AA-cacia saligna, Chamaecytisus palmensis, Dombeya torrida, Eucalyptus globulus,
Grevillea robusta y Hagenia abyssinica. Se probaron tres alternativas de manejo (control, es-tiércol y abono más mulch). El diseño experimental fue split-plot, las especies formaron la parcela principal y los tratamientos sobre el suelo las subparcelas con tres repeticiones cada una. Los datos sobre tasa de supervivencia, crecimiento en altura y diámetro en el cuello de la raíz se tomaron anualmente. Se tomaron muestras de suelo al principio y al final del experimento. Para desarrollar las alternativas de manejo sostenible en bosques naturales y plantaciones se diseñó un muestreo aleatorio sistemático en el bosque de Chilimo. Se realizó un inventario en 35 parcelas 9 parcelas en plantaciones. Tanto los datos biométricos y de muestreo de suelo se recogieron en todas las par-celas. En el bosque natural se desarrollaron ecuciones de biomasa para estimar la cantidad de car-bono almacenado en el suelo. Los datos necesarios para generar ecuaciones de biomasa aérea, con-centración de carbono y la densidad de la madera para A.Allophyllus, Olea europea. Spp. cuspidia-ta, Olinia rochetiana, Scolopia theifolia y Ruth glutinosa se obtuvieron utilizando un muestreo destructivo. Tamién se realizó une estudio de las propiedades edáficas de los suelos determinando el porcentaje de C, N total, P, K, Ca, Mg, pH y CIC siguiendo procedimientos adecuados. La con-centración de carbono de las muestras especies forestales se estimó mediante el método de las ce-nizas, mientras que el volumen se calculó utilizando el método de desplazamiento de agua. . Dentro del bosque natural se seleccionaron las especies principales para desarrollar un diagrama de mane-jo de densidad. Un modelo lineal general y un modelo lineal mixto se utilizaron para el análisis de datos con el software SAS y la representación gráfica utilizando R-software. La comparación de medias se realizó mediante la prueba de Tukey-Kramer. Los resultados de los estudios demuestras que, de las seis especies de árboles y un arbusto probados G. robusta A. Cunn. Ex R. Br. mostró la máxima supervivencia (100%) seguida de H .abyssinica (Bruce) JFGmel. (93,52%). E. globulus
abys-10
1. INTRODUCTION
1.1. African forest resources, the case of Ethiopia
According to FAO (2010) the total world forest area is 3.952 billion hectares. Forests and woodlands occupy 675 million hectares (23 %) in Africa, which accounted for (16.8 %) of the glob-al forest cover. Africa’s forest and woodlands are classified into: tropicglob-al rainforests, tropicglob-al moist
forests, tropical dry forests, tropical shrubs, tropical mountain forests, subtropical humid forests, subtropical dry forests, subtropical mountain forest and plantations (FAO, 2010). The distribution and species composition of these forests depends on the rainfall pattern and varies along the regions of Africa. Central Africa has the densest forest cover while, Northern Africa have the least forest cover (FAO, 2010). Tropical moist forests are widely found in coastal areas of west Africa and equatorial central Africa, where there is abundant rainfall and low dry season including: Cameroon, Central Africa Republic, Congo, Equatorial Guinea and Gabon. These countries accounted 60 % of the tropical moist forest. However, Mali, Niger, Chad and Sudan (Sahara Desert) in the north and Botswana (Kalahari Desert) in the south (Narendra et al., 1994) are widely dominated by deciduous and open woodland and gradually bend to grassland and finally desert. The forests and woodland coverage of eastern Africa is 13 % (UNEP, 2002). Kenya has the largest forest and woodland cov-erage (30 %) followed by Uganda (21 %). Djibouti has the lowest forest cover (0.3 %) (FAO, 2005). The natural high forest coverage of Ethiopia is 2.7 % but with the inclusion of woodlands and plantation forest the Ethiopian forest coverage is 10 % (Nyssen et al., 2004; Moges et al., 2010). Planted forest area is 14.8 million hectares and these represent 5 % of the global total (FAO, 2010).
domi-14
CIFOR (2007), dry forests are found in a band across Africa from Senegal in the west making a loop around the Congo basin, to Ethiopia in the east and South Africa in the south.
Forests in Africa provide energy, food, timber and non-wood forest products (NWFPs) and are important contributors to wealth and health of the household at community, national, sub re-gional and rere-gional levels. Wood fuels are the primary energy sources in Sub-Saharan Africa and over 70 % of the continent population depends on forest resources (AFDB, 2003). Forests and woodlands are also important for combating land degradation, mitigation of climate change, con-servation of wet lands, coastal area and freshwater ecosystems. The forests are also contributing 10 % to 70 % of the gross domestic product (GDP) in the Sub-Saharan African countries and from 5.5 to 9.0 % for the Ethiopian economy (FAO, 2010; Mekonnen et al., 2012).
However, African forests and trees are seriously threatened by agricultural expansion, com-mercial harvesting, increasing exploitation of fuelwood and other products and increasing urbaniza-tion and industrializaurbaniza-tion. All these problems are aggravated due to inadequate land use planning, inappropriate agricultural systems and drought.
Although, Africa is not a major emitter of CO2 and other greenhouse gases from commercial and industrial energy uses, it accounts about 20-30 % of CO2 emission due to deforestation and land use cover change (IPCC, 2013). To reduce deforestation and land degradation in the country, Ethio-pia has been implemented REDD+ (Reducing Emissions from Deforestation and Forest Degrada-tion) and now it is a REDD+ participant country to the Forest Carbon Partnership Facility (FCPF) of the World Bank (Moges and Tenkir, 2014). Even Ethiopia has developed the first carbon project under clean development mechanism (CDM) in Humbo (Welaita) before REDD+. Nowadays, there are regional REDD+ projects like Bale and Keffa biosphere reserve REDD+ projects (Moges and Tenkir, 2014). Chilimo dry afro-montane forest might be also part of the REDD+ project in the fu-ture.
1.1.1. Ethiopian forests
Ethiopia occupies the interior of the horn of Africa stretching between 3ᵒ and 15 ᵒN and 33ᵒ and 48 ᵒE. It covers a total area of 1.13 million km2 (CSA, 2000) that spands over a wide range of altitude, from 110 m below sea level to over 4600 m above sea level. The presence of wider altitudinal coverage enhances the diversity of climate, topography, soil type and vegetation resources.
Ethiopian is endowed with various landscape types resulted in different agroecological zones and vegetation types of the country. The vegetation types varied from tropical rain forest and cloud forests in the southwest to the desert scrubs in the east and northeast and diversified agroforestry practices and systems in the central highlands (Bongers and Tennigkeit, 2010). The structure and species composition of the natural vegetation types are also diverse due to the presence of wider physiognomic and climatic landscapes in the country. Ethiopia is among the top 25 biodiversity rich countries in the world. More than 7000 species of plants, 240 species of mammals and 845 species of birds are found in the country. Among this 1150 species of plants, 22 species of mammals and 24 species of birds are endemic (Bongers and Tennigkeit, 2010). The vegetation are important for production, protection and conservation functions in the country. They supply most of the wood products (industrial and non-industrial) consumed within the country and diverse non wood forest products (NWFPs) such as: wild coffee, gum, resin, honey, beeswax, herbal medicines and bamboo. They also provide various ecosystem services such as watershed protection, biodiversity conservation and carbon sequestration. The vegetation ecosystem in the Ethiopian plateau and mountains are the sources of a number of great rivers including one of the longest river in the world, Blue Nile and other big rivers in the country such as: Omo, Awash and Wabishebele Rivers.
16
The natural high forests of Ethiopian are mainly found in the highlands where annual rainfall distribution and amount is better. The Highlands cover 44 % of the country’s total land area accommodate 90 % of total human population, 93 % of the cultivated land and 75 % of the country’s livestock population. Dry afro-montane forests and moist afro-montane forests are the
dominant vegetation types found in the highlands. However, the dry afro-montane forests are the most dominant one in the central, northern and western Highlands.
The dry afro-montane forests are dominated by both broadleaved and coniferous species such as: Juniperus procera, Podocarpus falcatus and Olea europaea ssp. cuspidiata e.g. Chilimo, Menagesha-Suba, Wefwasha and Munessa-Shashemene forests. While, the moist montane forest are mainly found in the southern and southwestern parts of the country and are dominated by large broadleaved and soft-leaved species such as: Aningeria adolfi-friendercii, Olea welwitschii, O. hockstetter and Croton macrostachys (Bekele, 1994 and 2003; Woldemariam, 1998; Kelbessa and Soromessa, 2004; Kassa et al., 2008; Shumi, 2009) where relatively higher rainfall is found (Bekele, 1994).
Dry evergreen montane forests are very complex vegetation type occurring in areas of relatively high humidity, with limited and unreliable rain and prolonged dry season. During the dry season, temperature increases and day time humidity drops down and water courses either dry up or greatly diminish inflow (Teketay, 1996). Besides, dry afro-montane areas are inhabited by the majority of the Ethiopian population and represent a zone of sedentary cereal based mixed agriculture for centuries.
1.2. Land degradation and deforestation in Ethiopia
Forests contribute directly to the livelihood of 1.2 billion people living in the developing nations (90 %) from the total population and 38 % of the total energy requirement in these nations is also directly obtained from forest biomass (Sims, 2003).
Historical studies on forests showed that, forest depletion occurred when the society under go economic development, industrialization and urbanization (Rudel et al., 2005; Amarcher et al., 2009). Deforestation and land degradation are the major environmental problems facing developing countries (Africa, Asia and Latin America) (Amarcher et al., 2009). In the 1980s and 1990s, the annual rate of deforestation had averaged 1 % worldwide with deforestation in tropical rainforest averaging 0.6 % (FAO, 2001) and between 1990 and 2000, more than 14.2 million hectares of tropical rainforests disappeared. Deforestation, land degradation and poor forest management reduce carbon storage in forests on the contrary, sustainable management, planting and rehabilitation of degraded lands increase carbon sequestration (FAO, 2010).
Sub-Saharan Africa (SSA) accommodates one of the world’s fastest growing populations and it is significantly affected by land degradation because of deforestation, poor land management and conversion of fragile natural habitats into fields for crops. The forest area in East Africa was reduced by 783,000 hectares between 2000 and 2010: equivalent to an annual loss rate of 1.01 % (FAO, 2011). Shortage of forest products, loss of soil fertility and disruption of the water cycle are followed by poverty, hunger and social unrest in the region (Barrowclough and Ghimire, 1996). This general layout is similar to other tropical and sub-tropical areas and has made restoration of degraded lands as an essential challenge. John et al. (1997) identified some of the factors that act as a catalyst of such situation: intensive crop expansion, over-grazing and unsustainable fuel wood harvesting. Wood fuels are also the primary energy sources in Sub-Saharan Africa, accounting for approximately 70 % of total energy use and contributed to directly for deforestation and indirectly to land degradation in these region.
18
Agriculture is the backbone of the country, accounted 47 % of the gross domestic product (GDP), 80 % of the employment opportunity and 60 % of the export item (Shiene, 2012). Similarly, 90 % of the total population is using forest biomass for energy (Alem et al., 2010; FDRE, 2011).
Although, the remnants of dry afro-montane forests are found in the Highlands, majority of these forests are deforested due to the above mentioned problems (Lemenih et al., 2008). For example, the annual deforestation rate in the country is estimated to be 150,000 to 200,000 hectares (Tadesse, 2001). Most of the natural forests and wood lands are located in these areas and are converted into bush lands and agricultural lands (Dubale, 2001; Teketay, 2001). Nowadays, in addition to Highlands, deforestation is also continuing in the lowlands due to agricultural expansion by investors and new settlements in these areas. For example from 2000 to 2008, agricultural lands were expanded by about 4 million hectares and 80 % of these new expansions were come from conversion of forest lands, woodlands and shrub lands. The demand is also expected to increase from 15 million hectares in 2008 to 34 million hectares by 2030, respectively (Brown et al., 2010; EDRI, 2010). In addition, new threats such as: Land grabbing, biological invasion and climate change, which contributes to major forest depletion in the lowlands, are also emerged in the country (Tigabu et al., 2014). Due to deforestation, there is acute shortage of fuelwood, charcoal, construction wood, timber and non-wood forest products in addition to disturbed ecosystem services (soil erosion, hydrological imbalance, loss of biodiversity etc…), in both Highlands and
lowlands (Lemenih and Kassa, 2014).
Most parts of the soil found in the Highlands are degraded due to lack of vegetation cover and excessive soil erosion, annually 1.5 billion tonnes of top soil is eroded in the country (Tadesse, 2001), 27 million hectares representing approximately 50 % of the highlands are already signifi-cantly degraded and 14 million hectares are badly eroded. In two million hectares of the cultivated land, the soil depth is so reduced that the land is no longer able to support any vegetation cover. Fif-ty four percent of the remaining highlands are highly susceptible to erosion (Asmono et al., 2002). A continental study commissioned by FAO in 38 Sub-Saharan Africa (SSA) countries, including Ethiopia showed that, Ethiopia is among the highest rates of nutrient depletion (Lemma et al., 2006). The soil has become shallow as a result of persistence erosion that has been taking place for centuries (Zerihun, 1999).
over-cultivation of cropland and deforestation. Currently, the seemingly combined objective of restoring vegetation cover and production of fuel wood is a key environmental issue. Besides, restoration of degraded forest lands and woodlands can be paving as other potential opportunity in the future for firewood production where the resources are available. However, a time lag will appears and the allowable harvested volume should be carefully determined in these regard.
Though, relentless efforts have been made to avoid land degradation in the country through tree planting and soil and water conservation measures, the problem is still continuing. Then, spe-cies selection for afforestation is crucial as the tree spespe-cies may affect soil properties differently (Li
et al., 2012). Other interim management solutions such as physical soil retention structures may be needed prior to establishing vegetation in degraded lands (Yitbarek et al., 2012). Exclosures have been identified as a valuable rehabilitation option when the main driver of land degradation is graz-ing (Mekuria and Aynekulu, 2011) or intense recreational use (Özcan et al., 2013). Both measures are expensive for local communities. Effective restoration practices should be based on local per-ceptions of soil erosion and should include easily available local management options (Kiome and Stocking, 1995). The application of manure has demonstrated to be positively affecting the infiltra-tion capacity of soils and plant producinfiltra-tion on grazed lands at low cost (Tadesse et al., 2003). In ad-dition, mulching can both enhance conditions for plant growth in harsh environments (Blanco-Garcia and Lindig-Cisneros, 2005) and protect topsoil against erosion (Roose and Barthés, 2001). Consequently, the correct selection of plant species and soil management is vital for both fuel wood production and soil rehabilitation (Figure, 1).
In recent years the fuel wood crisis that links deforestation with fuel wood consumption has been discarded as many of the harvest occurs on species growing “outside” the forest (Mahiri and
Howorth, 2001). This pattern of fuel wood consumption is improved by householders ‘tree planta-tions’, where natural forests are scarce (Bewket, 2003). As a consequence, tree planting has
20
(a). Initial stage (b). Initial stage (C). Land degradation
(d). Land preparation (e). After 1 year : A. saligna (f). After 1 year : A. saligna
(g). After 2 years: A. saligna (h). After 3 years: G. robusta (i). After 4 years : C. palmensis
Fig. 1: Images from rehabilitation of degraded lands in the study areas, Fig.1 (a), (b), (c), (d), (e), (f)):
Showed the status of a degraded land,land preparation ,tree planting and A. saligna after one year,(Fig.1 (g), (h), (i)) : Showed A. saligna, G. robusta and C. palmensis trees after two,three and four years planted
under Debrelibanos site, Central Highlands of, Ethiopia. Photos by: Mehari A. Tesfaye (2005-2009)
(Debrelibanos, Ethiopia).
1.3. Carbon stock in tropical and Ethiopian forests
forests fix large amount of carbon in the process of photosynthesis and store it in the form of biomass. Carbon storage in forest ecosystems involves numerous components including biomass carbon and soil carbon (Annissa et al., 2013). As more photosynthesis occurs, more CO2 is converted into biomass, reducing carbon in the atmosphere and sequestering it in plant tissue above and below ground (IPCC, 2003; Gorte, 2009) resulting in growth of different parts (Charon and Rasal, 2010). Biomass production in different forms plays an important role in carbon sequestration in trees (Charon and Rasa, 2012). Aboveground biomass, belowground biomass, deadwood, litter, stumps and humus are the major carbon pools in any forest ecosystem (FAO, 2005; IPPC, 2003 and 2007).
IPCC (2013) reported the global forests cover over 4 billion hectares and contribute around 50 % global greenhouse gas mitigation. The tropical forests spread over 13.76 million km2 area worldwide accounted about 60 % of the global forest cover and store an estimated 193-229 Pg of carbon in aboveground biomass and recycling 915 Gt of carbon each year, through photosynthesis and net primary production (Brown, 1997; FAO, 2005; Millennium forest resources assessment re-port, 2005; Baccini et al., 2008) or roughly 20 times the annual emission from combustion and land use change (Friedlingstein et al., 2010). Tropical rain forests contribute substantially to the global carbon cycle accounting for 40 % terresterial net primary production, 60 % of forest biomass and 27 % of carbon stored in forest soils. Tropical dry forests constitute more than 40 % of all tropical for-ests, having a net terrestrial primary production of 40 %, stored 60 % carbon and contain half of world species (Mayaux et al., 2005; Miles et al., 2006; Chidumayo et al., 2011). Global climate change will further reduce rainfall intensity and seasonality in the tropics; this has a bigger impact on the livelihood of the people in the tropics including plant and animal species (FAO, 2006). In-creament of atmospheric concentrations of CO2 also affect plant metabolism directly through photo-synthesis and this has altered the dynamics of tropical forests (Chidumayo et al., 2011). The factors limiting carbon sequestration capacity must be understood to predict the changing role of tropical forests in the global carbon cycle.
Soil is the largest carbon reservoirs of the terrestrial carbon cycle 1500-1550 Gt of organic carbon and soil inorganic carbon approximately 750 Gt both to 1 m depth. About three times more carbon is contained in soils than in the world’s vegetation 560 Gt and soils hold double the amount
22
reserves, compared with 1.7 % in the atmosphere, 8.9 % in fossil fuels, 1.0 % in biota and 84.9 % in the oceans (Lal, 2004a). Carbon stocked in organic form in soils (SOC) is affected by environmental factors such as topography, parent material or soil depth (Fu et al., 2004; Johnson et al., 2000). Forest soils are subjected to lower human disturbance than agricultural soils and having lower bulk density than others soils due to the presence of higher organic matter content (Lal, 2005). Forest soils are part of any forest ecosystem and play a vital role in the global carbon cycle (Jabaggy and Jackson, 2000; Rooney, 2013). And, about 40 % of the total SOC of the global soils resides in forest ecosystem (Six and Jastrow, 2002; Baker, 2007).
The national carbon stock of Ethiopia was estimated to be 153 Tg C by Houghton (1998), 867 Tg C by Gibbs et al. (2007) and 2.5 Gt of C by Sisay (2010). Consequently, estimation of the natural high forest carbon stock was ranging between 101 Mg C ha-1 (Brown, 1997; Moges et al., 2010) and 200 Mg C ha-1 (Temam, 2010; Tsegaye, 2010). The discrepancy between these values is due to the different methods and tools used for the authors and the variability in soil, topography and forest types. Nevertheless, biomass equations and forest growth models are very scarce for Ethiopian condition, although, there are few works done by some authors (Zerfu, 2002; Embaye et al., 2005; Woldeyohannes, 2005; Mamo and Sterba, 2006; Zewdie et al., 2009). Thus, localized carbon stocking assessment works should have been made in these regards (IBC, 2005; Moges et al., 2010).
1.4. Chilimo dry afro-montane forest of Ethiopia
Chilimo forest is one of the few remnants of dry afro-montane forest located in Dendi dis-trict, Western Shewa zone, Oromia administrative region, Ethiopia. The forest is found 70 km southwest of Addis Ababa. The forest is geographically located at 38° 07′ E to 38° 10′ E and 9° 30′ to 9° 50′ N’ longitude, with an altitude range of 2,170-3,054 m above sea level (Figure 3). The
mean annual temperature of the area ranges between 15-20 ºC and receives a mean annual precipita-tion of 1,264 mm (Shumi, 2009). Köppen’s classificaprecipita-tion defines the climate of Chilimo forest is classified as warm temperate climate I (CWB) type (EMA, 1988). The forest is a small enclave in the western section of a chain of hills and ridges that stretch 200 km from north of Addis Ababa westwards up to the Ghedeo highlands, locally river valleys and gorges cut through the chain. A number of rivers, for example, Awash River it is one of the longest rivers in the country, starting from this forest. The forest is also home to over 180 species of birds and 21 species of mammals including endemic subspecies Meneliks bushbuck, vervet monkey, colobus monkey, Anubis ba-boon and leopard (Woldemariam, 1998). Besides, the forest is found in the nearby the capital city Addis Ababa, easily accessible through all-weather road and having old historical palaces inside it.
Chilimo forest is composed of mixed broad leaved Podocarpus falcatus, Olea europaea ssp.
cuspidiata, Scolopia theifolia, Rhus glutinosa, Olinia rochetiana and Allophylus abyssinicus and coniferous forest species Juniperus procera are the major species in the forest (Bekele, 2003; Kelbessa and Soromessa, 2004; Kassa et al., 2008). Accordingly Shumi (2009) investigated 42 spe-cies 27 (64 %) of trees and 15 (36 %) of shrubs in the forest. Similarly, the inventory result for this thesis work found a total of 33 different native species (22 tree species and 11 shrub species) in three forest patches (Chilimo, Gallessa and Gaji). The density also varied from 2, 533 stems ha-1 found in Chilimo to 848 stems ha-1 found in Gallessa patch. Besides, adjacent to the natural forest more than 400 hectares of small patches of plantations of different introduced tree species ( Euca-lyptus saligna, Eucalyptus camaldulensis, Pinus patula, Cupressus lusitanica) and native tree spe-cies (Juniperus procera, Hagenia abyssinica, Podocarpus falcatus) are found (Kassa et al., 2008). These plantation forests are serving as sources of income for the local community.
24
forests in the country. Its accessibility and proximity to market centers including Addis Ababa, the capital of Ethiopia contributed to its exploitation (Bekele, 2003). Higher timber extraction rates along with over grazing and agricultural expansion in the forest radically reduced the forest area from 22,000 hectares in 1982 to 11, 000 hectares in 1984 and 6,000 hectares in 1991 and are sur-rounded by vast areas of agricultural land (Shumi, 2009).
For over a century, Chilimo forest was owned and controlled by the state. Nevertheless, the state control from 1991 to 1996 had weakened. This resulted in increasing conversion of forest land into agriculture land and reckless cutting of trees for timber, construction wood and fuel wood. Thus, to maintain the continuity of the remaining forest, the government classified Chilimo forest into 58 of the National Forest Priority Areas (NFPAs). Then few years ago Chilimo forest was managed by the community through participatory forest management approach facilitated by Farm Africa (Farm Africa, 2000; Negassa and Wiersum, 2006). However, Farm Africa had left the forest in 2005 and it was transferred to Oromiya wildlife and Forest enterprise government office. Cur-rently Chilimo forest is owned by 12 Forest User Groups (FUGs), more than 3,000 households with a total population over 15,000 people live inside or on the periphery of the forest (Kassa et al., 2008). Agriculture is the main activity of the community; however, both forestry and crop produc-tion contribute almost equal to maintain their livelihoods (Negassa and Weirsum, 2006; Kassa et al., 2008). The forest user groups are generating income through selling timber from planted forest. In addition, this research output enables them to harvest some amount of wood from the natural forest. Secondly the outputs obtained from this research result can be taken as a forest management tool for Oromia forest and wildlife enterprise office.
regional level are needed in relation to carbon stock in the soil and aboveground biomass. Alterna-tive income generating mechanism such as carbon trade should be implemented to support the local community.
(a). Chilimo natural forest (b). P. patula plantation
(c). Remnants of crop residue (d). Degraded land adjacent to Chilimo natural forest
(e). Litter fall in plantation forest (f). Herbaceous plant and dead wood in Chilimo natural forest
Fig. 2: Described the carbon stock found in different land use types adjacent to Chilimo forest; (Fig. 2 (a)):
26 1.5. Forest management tools available for African tropical forests
Forest management is a branch of forestry concerned with the overall administrative, eco-nomic, legal and social aspects for silvicultural, protection and forest regulation (Glossary of Forest Terms in British Columbia, 2008). Tropical forests are under pressure due to conversion to pastoral and agricultural land or to forest plantations (Kent, 2004; Garder et al., 2009). The experience in other countries such as Zambia (Kokwe, 2012), showed that management intervention on natural forests increases wood production, carbon sequestration, besides its benefit in terms of biodiversity conservation and watershed protection. The average accumulation rate of CO2 in managed forest is around 5.5 tons ha-1 yr-1 in wood lands and 21 tons ha-1 yr-1 in tropical rainforests, subtropical for-ests and woodland forest (Moges et al., 2010), while unmanaged tropical rainforests grow at a rate of about 0.5 tons ha-1yr-1 (Lewis et al., 2009) leading to around 40 fold increase in annual yield. Di-verse management tools are available for the sustainable management of African forest including growth and yield modelling and stand density management diagram (Vanclay, 1994).
Forest growth and yield models are key tools for the sustainable forest management. Most of the forest growth and yield modelling studies addressed plantation and temperate forests. While, growth and yield models for mixed tropical forest in general and tropical and subtropical African forest in particular are very limited (Botkin, 1993;Vanclay, 1989, 1994 and 2003; Alder et al.,
2002, Vanclay, 2003). Moreover, ≥ 90 % of the the forests in developed countries have forest
man-agement plan, in the contrary, only 6 % of the total forests found in the developing countries have forest management plan (Nabuurs et al., 2007).
In addition, stand density diagrams are a management tools which facilitates decision making process for forest managers. It has been widely used as an important management tool for even-aged stands in many regions across North America and Europe (Drew et al., 1979; Smith, 1989; Wilson et al., 1999; Valbuena et al., 2008). Moreover, to even-aged plantation stands during the early to mid-1990s, SDMDs and stand density index were also developed for mixed species and uneven-aged stands as a management tool (Long, 1995; Shaw, 2000; Ducey and Larson, 2003; Woodall et al., 2005; Swift et al., 2007).
al., 2009; Fayolle et al., 2013; Ngomanda et al., 2014). Thus, adequate research works should be conducted on this topic.
2. OBJECTIVES OF THE THESIS
2.1. Aims and specific objectives
The major aim of this thesis is to generate appropriate forest management options to increase carbon stock and rehabilitation of degraded lands in Chilimo dry afro-montane forest and adjacent land uses, in Central Highlands of Ethiopia. To accomplish this general objective five specific objectives are proposed and implemented.
Specific objective 1: Selection of tree species and soil management for restoring degraded lands in Ethiopian Central Highlands
Land degradation and deforestation are major environmental problems in Central Highlands of Ethiopia in particular and overall the country in general caused by reckless cutting of trees and lack of well-established soil management. Restoration programs need scientific information about the species and soil management best suited for rehabilitating degraded lands. The purpose of this specific objective was to evaluate six tree: Acacia decurrense, Acacia saligna, Dombeya torrida, Eucalyptus globulus, Grevillea robusta, Hagenia abyssinica and one shrub species: Chamaecytisus palmensis, under three soil management options: control, manure and manure plus mulch, in degraded Central Highlands of Ethiopia for four years (2005-2009) and finally to screen the best performing species and soil management for both fuelwood production and rehabilitation of degraded soil.
Specific objective 2: Aboveground biomass equation model development for five native species in a tropical mixed forest of Ethiopia
28
carbon stocks for the above mentioned tree species in the tropical mixed forest. Finally, the equa-tions will be applied for sustainable management of Chilimo dry afro-montane forest in particular and other dry afro-montane forests in general.
Specific objective 3: Impacts of changes in land use, species and elevation on soil organic carbon and total nitrogen in Ethiopian Central Highlands
Information regarding soil organic carbon and nitrogen stock (SOC and SON) and concen-tration and bulk density are lacking in Chilimo dry afro-montane forest (both in forest floor and mineral soil) and adjacent land uses (plantation forest, crop land and degraded land) along elevation gradient and species. Therefore, the purpose of the specific objective was to quantify soil organic carbon (SOC) and soil organic nitrogen (SON) stock, concentration and bulk density of mineral soil and forest floor following an elevation gradient, land use types and introduced planted species ( Cu-pressus lusitanica, Eucalyptus saligna and Pinus patula) along four soil depths (0-10 cm, 10-30 cm, 30-50 cm, 50-100 cm).
Specific objective 4: Evaluation and formulation of stand density management diagram model for Chilimo dry afro-montane forest using species proportion.
Stand density management diagrams are useful tools for designing, displaying and evaluating alternative density management regime for both even-aged and uneven-aged forests. However, informations in this regards are very scanty in Chilimo dry afro-montane forest in particular and all the Ethiopian forests in general. Thus, the specific objective was to develop stand density management diagram for Chilimo dry afro-montane mixed forest using species proportion.
Specific objective 5: Evaluation and estimation of carbon concentration and wood density along plant parts and stem position for five most commonly grown tree species in Ethiopia.
Rhus glutinosa and Scolopia theifolia in a tropical mixed forest along plant parts (stem, branch and leave) and stem position (from stump height to commercial height) among and within a species.
2.2. Conceptual model
30
Forest management options for carbon stock and soil
rehabilitation under Chilimo dry afromontane forest, Ethiopia
Land degradation
V Estimation
of CC and WD in the plant parts IV SDMD model formulation III
SOC & SON Stock and Concentration estimation II Above ground biomass estimation I
Selection of fast growing trees and management
option
Low species diversity and slow growth
Loss of soil fertility & nutrient depletion
Deforestation
Low species survival and soil degradation
Lack of fast growing tree
species and soil management Lack offorest management options
Wood shortage for fuel & others
Losses of forest cover species
Loss of above ground biomass, SOC, SON and species diversity
etc. Soil degradation and climate change Chilimo dry afro-montane forest Degrad ed land
Fast growing tree species and soil mgt options
selected
Forest management options will be generated for Chilimo natural forest Crop
land
3. MATERIAL AND METHODS
3.1. Study sites
Debrelibanos study site
Debrelibanos degraded site was located geographically at 9º 38’ 19.66’’ N latitude and 38º 49’ 34.46’’ E longitude, 2,600 m above sea level (Figure 3) in Debrelibanos district, Northern
shewa zone, Oromia administrative region, Central Highlands of Ethiopia. Meteorological data were obtained from Ethiopian Meteorological Agency in Addis Ababa ((http://www.ethiomet.gov.et/). The averaged mean annual maximum and minimum temperature of the study area were 21 ºC and 8 ºC, respectively, with an annual mean averaged precipitation of 1, 200 mm falling mostly in July and August. Köppen’s classification is temperate highland tropical climate with dry winters.
Chilimo dry afro-montane forest
Chilimo dry afro-montane forest is geographically located at 38° 07′ E to 38° 10′ E and 9° 30′ to 9° 50’ N’ longitude, at an altitude of 2,170-3,054 m above sea level (Figure 3) in Dendi
34
Fig. 3: Location map of study sites of Debrelibanos district and Chilimo dry afro-montane forest.
3.2. Experimental design and sampling
plus mulch were applied after planting in July 2005 (manure) and in December 2005 (mulching). The experimental layout was organized as a split-plot design, with tree species as the main plot and soil management options as sub-plots; it was organized in three blocks to control variation along a slope gradient and three replicates for each species. The main plot consisted of 90 trees divided into three groups of 30 trees; each arranged into five rows, with six trees in each row. The distance between trees in the same row and between rows in the same sub-plot was 1.5 m, while the distance between treatments in the main plot and sub-plots was 2 m.
A systematic random sampling approach was implemented to conduct inventory in Chilimo dry afro-montane forest. Primarily, Chilimo forest was stratified into 3 major natural forest patches Chilimo, Gallessa and Gaji and an inventory was taken to compile information about species composition, diameter distribution and general forest condition. A total of thirty-five, 20x20 m square sample plots were marked based on Neyman optimal allocation formula (Köhl et al., 2006) along elevation gradient. The plots were laid out following top-down parts of the mountain. The distance between plots were 100 m and plot location was determined using measuring tape, GPS, altimeter and compass. Sampling and data collection were done in the measured plots of the mixed
natural forest. Individual species were categorized into trees (≥ 5 cm diameter at breast height-dbh-)
shrubs and saplings (height ≥1.3 m and dbh 2.5-5 cm) and seedlings (height 0.30-1.3 m and dbh ≤
2.5 cm) following Lamprecht’s classification (1989).
3.3. Data gathering
3.3.1. Tree data
Survival counts, tree height growth and root collar diameter (RCD) growth measurements were taken at 12, 24, 36 and 48 months after planting for A. decurrense, A. saligna, C. palmensis,
36
equation purpose (study II) and more 15 sampled trees (3 trees per species) for carbon concentration and wood density estimation in the plant samples. Tree diameter was measured with a metallic calliper and diameter tape. Crown height and total height were measured using a Vertex III digital tree height measurement instrument.
(a). A degraded land without plantation (b). A. saligna plantation
Fig. 4: Images of Acacia saligna after 2 years planted in degraded lands. Fig. 4 (a): Showed a degraded land
before intervention and Fig. 4 (b): Showed a degraed land planted with A. saligna after two years of
inter-vension. Photo by: Mehari A. Tesfaye (2009) (Guder, Ethiopia).
(a). Chilimo natural forest (b). Biometric data collection for A. abyssinicus
Fig. 5: Biometric data collection in the natural forest. Fig. 5 (a): Showed partial view of the existing natural
forest and Fig. 5 (b): showed biometric data collection for A. abyssinicus species in the natural forest.
3.3.2. Biomass data
A total of 90 trees (20 tree per species of O. europaea ssp. cuspidiata, O. rochetiana, and
S. theifolia and 15 trees per species of A. abyssinicus and R. glutinosa) from different diameter classes were selected, cut and divided into different sections (study II). The branches were de-limbed and separated into different biomass components (stem, large branches (diameter > 7 cm),
thick branches (diameter 2-7 cm), thin branches (diameter ≤ 2 cm) plus leaves). Fresh weights of
each component were recorded in the field and then samples were taken to the laboratory and oven dried at 67 ºC and 102 ºC to constant weight. Smalian’s formula (Nicolas et al., 2012) was used to calculate the volume of stems and large branches (Ø > 7cm). The large branches were obtained on-ly in few trees and its weight was added into stem biomass.However, for A. decurrense, A. saligna,
C. palmensis, D. torrida, E. globulus, G. robusta and H. abyssinica biomass was calculated from volume and wood specific gravity. Volume was calculated from the average height and diameter of the experiment trees and total biomass calculations were based on tree volume and specific gravity, using values obtained from the specific gravity biomass data were taken at 48 months (study I).
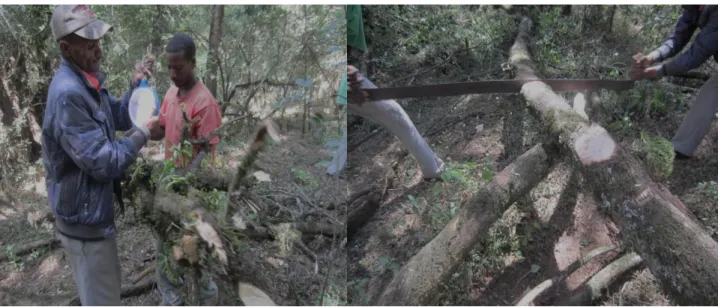
(a). Fresh weight biomass data sampling in the field (b). Stem biomass cutting using cross cut saw
Fig. 6: Biomass data collection and sampling in the field Fig. 6 (a): Fresh weight sampling in the field using
weigh and Fig. 6 (b): Stem biomass data collection (cutting) using two man cross cut saw in the natural
38 3.3.3 Coarse wood debris and stump data collection
Coarse wood debris (logs and stumps) for Juniperus procera, Podocarpus falcatus and Olea europaea ssp. cuspidiata were sampled inside 20 mx20 m plot (study III). Weight for coarse wood (logs and fallen branches) were measured in the field and then samples were taken into laboratory and oven dried at 102 ºC to constant weight. Number of stumps found in the plot and the species of the stump were also recorded (study III). The diameters of the stumps were measured in their bases and at the top using metallic calliper and diameter tape. Individual height of stumps was also meas-ured using a measuring tape. The volume of the stump was calculated using Smalian’s formula
(Ni-colas et al., 2012). Weighted mean wood density (WD) of 0.66 was used to calculate the biomass i.e. wood density for Juniperus procera (0.54), Podocarpus falcatus (0.52) and Olea europaea ssp. cuspidiata (0.91) (WUARC, 1995).
(a). Dead wood collected in the main plot (b). Illegally cut stump in the plot
Fig. 7: Showeddead wood and stump samples in the natural forest Fig. 7 (a): Fallen Juniperus procera dead
wood samples collected in one of the main plot and Fig. 7 (b): Illegally cut Juniperus procera stump found in
one of the main plot in of the natural forest. Photo by: Mehari A. Tesfaye (2012) (Chilimo, Ethiopia).
3.3.4. Soil data (study I and study III)
treat-ment and species combination. Seventy two composite soil samples in total were collected from three soil depths. Three random sampling points were mixed to form one composite sample.
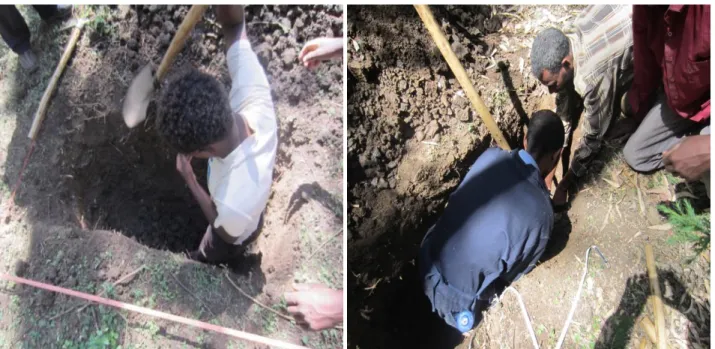
Soil sampled also carried out in Chilimo dry afro-montane forest and its adjacent land uses (natural forest, plantation forest, cropland and degraded soils). Both forest floor and mineral soil sampling were done inside main plots (20 m x 20 m). Forty forest floor samples were collected by using 0.25 m x 0.25 m metallic frame quadrant. The depth of the forest floor was measured using a metallic ruler. In eighteen main plots, mineral soil samples were taken below the forest floor up to 1 m depth using pit method (1 m x 60 cm) due to representativeness of the samples. A total of 33 pits in four land use types were dug for soil sample collection. Then, soil samples were taken in four soil depth (0-10 cm, 10-30 cm, 30-50 cm and 50-100) cm. Soil bulk density was calculated using metal-lic cylinder method (6.5 cm height, diameter and width) for each soil depth. A total of 280 samples (140 soil samples for C % and total N % analysed plus 140 cylinder samples for bulk density ana-lysed) were collected.
Fig. 8: An example of soil sampling in different land use types of the study area using pit sampling method.
Photo by: Mehari A. Tesfaye (2012) (Chilimo, Ethiopia). 3.3.5. Wood density and carbon concentration (study V)
Carbon concentration and wood density were collected for five tree species: A. abyssinicus,
afro-40
using destructive sampling. Trees were felled using local axes and cross cut saw and cut as close to the ground as possible. Wood samples were extracted using crosscut saw and chain saw. A total of 15 trees (3 trees per species) were selected to cover the entire diameter classes. A total of 105 discs, six cross-sectional discs (5 discs from stem and one disc from big branches) having a size of 30-50 mm thick, were collected per single tree. Discs were taken from each section, starting from stump height and every one meter along the stem upto the end of the commercial height (≤ 7 cm) and one sample for large branches per tree. Leaves samples were also taken from each tree for the same purpose. Fresh weights of each wood and leaves samples were taken in the field and then taken into the laboratory.
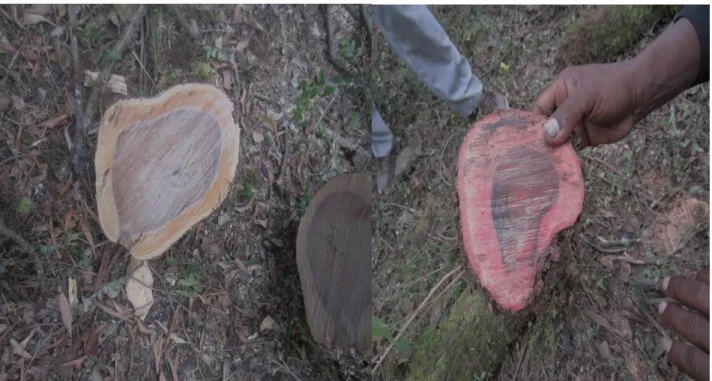
(a). Allophyllus abyssinicus extracted wood sample ( b). Olinia rochetiana extracted wood sample
Fig. 9: Showedwood sampling for the sampled trees, Fig. 9 (a): a wood sampled (white color) extartced
from A. abyssinicus tree and Fig. 9 (b): a wood sampled (red color) extracted from O. Rochetiana tree in the
study area.Photo by: Mehari A. Tesfaye (2013) (Chilimo, Ethiopia).
3.4. Laboratory methods
3.4.1. Soil analysis
(%) using Kjeldhal’s method (Keeny and Nelson, 1982), organic carbon (%) according to Walkley - Black’s method (Bremmer and Jenkinson, 1960), available Phosphorus (units) using Olsen’s
meth-od (Olsen and Sommers, 1982), ammonium and smeth-odium acetate were applied to determine cation exchange capacity, exchangeable K were measured with flame photometer (study I) (Thomas, 1982) at Holetta research centre, Ethiopia (www.eiar.gov.et/index.php).
Forest floor layers were air-dried and homogenized before the analyses were performed. All samples were weighted and subsamples were oven dried for 24 hours at 65 ºC to constant weight. The chemical analysis for organic carbon in the forest floor were done by drying samples at 105 ºC
and then ashes at 550 ºC (Ben-Dar and Banin, 1989). The loss in weight between 105 ºC and 550 ºC
constitutes the organic matter content. Then organic matter content was converted into organic car-bon by multiplyin it with 0.58 which has been found to be the most covenient conversion factor from organic matter to carbon content in the forest floor (de Vos et al., 2005). Similarly, bulk densi-ty for each soil depth was determined using a 5 cm diameter and 5 cm height metallic-cylinder coarse sampling method following the procedure of Blake (1965). Total N was determined using Kjeldahl’s method following the procedure in Keeny and Nelson (1982). Chemical analysis was
performed at Holetta research centre, Ethiopia (www.eiar.gov.et/index.php).
3.4.2. Wood density and carbon concentration
Similar to forest floor samples woody parts were oven dried at 102 ºC and 67 ºC to constant weight in the laboratory. The oven dried wood samples were weighed, splatted into pieces, chopped and finally ground into 0.2 mm with a grinding mill. Carbon % was estimated by ash methods de-scribed by (Ben-Dar and Banin, 1989; Allen et al., 1986; Negi et al., 2003; Jone et al., 2009). Oven dried and ground plant samples were placed in the graphite furnace at 105 ºC and 400 ºC tempera-ture for four hours. Then, the carbon concentration was determined using the following formula (study V):
Ash % X 100 (1)
) 58 . 0 %( % Ash
42
Where, C: the organic carbon concentration, w105: weight of dry ground plant sample at 105 ºC,
w400: weight of ground plant sample at 400 ºC and 0.58 is the carbon concentration in the organic
matter of wood.
Similarly, volume (cm-3) for wood density calcualtion was estimated using water displace-ment method. Then wood density was calculated using the ratio of oven dry weight of wood (g) and volume (cm-3). The carbon concentration and wood density analysis were performed at Holetta re-search centre, Ethiopia (www.eiar.gov.et/index.php).
3.5. Statistical analysis
Before performing actual statistical analysis datas were classified into longitudinal, spatial and autocorrellation datas. Height growth, root collar diameter growth, survival and soil datas (study I) were categorized as longitudinal datas. Carbon and nitrogen concentration and stock (study III) were spatial datas. The datas were analyzed using general linear mixed model. Tree da-ta, biomass, wood density and carbon concentration are autocorrelation datas and a correllattion analysis was performed. A general linear model was used for these datas. However, some datas lack homogenity and had heteroscedasticity problem, a logarithmic and arcsine transformation were per-fomed for these datas. The detailed statistical analysis was presented below.
3.5.1. Mixed models
Survival rate, height growth, root collar diameter growth and biomass (study I) and carbon and nitrogen stock and concentration and bulk density datas for (study III) were performed using Proc-Mixed Model on SAS (SAS Inst. Inc., 2012) (study III) and mean separation using Tukey-Kramer test. We tested the following general structure to obtain a model of survival, height and root collar diameter (study I):
(3)
The model used for biomass data were also presented as (study I):
(4)
land use type or altitude) and one within-subjects factor (depth with four levels) using the mathe-matical model (study III):
[5)
The assumptions for the errors in the linear mixed model were:
, with = random variance for the errors at depth k.
, with =correlation coefficient (6)
3.5.2. General linear models
Soil datas for (study I) and carbon and nitrogen concentration and stock (study III) were analysed using SAS PROC GLM method (SAS Inst. Inc., 2012). Mean comparison was made using least square means. A significance level of 0.05 is assumed across the analysis (Study I). An analy-sis of equality of means was performed using a Tukey-Kramer test for multiple comparisons among elevation classes at α=0.05 (Study III).
For biomass data 12 biomass equations found in the literature(Balboa-Murias, 2006; Ruiz-Peinado et al., 2011 and 2012) were evaluated and selected, simultaneously fitted using joint gener-alized regression. Model fits were performed using the SAS MODEL procedure (SAS Inst. Inc., 2012). The model efficiency were compared with previously developed general models (Brown et al., 1989; Brown and Lugo, 1992; Brown, 1997; Chave et al., 2005) for tropical areas using aver-age deviation (S), relative bias (RB), relative root mean square (RRMSE) and applying a paired t-test for estimation values (study II):
(7)
[8]
[9]
SAS PROC GLM (SAS Inst. Inc., 1999) was used with altitude (3 levels), land use types (4 levels) and species (3 levels) as main factors. The mathematical formulation of the model was (study III):
44
SDMD using species proportion and carbon concentration and wood density datas were also analyzed using Proc GLM and Proc logistic model (SAS Inst. Inc., 2012) and the model used for species proportion as (study IV):
(11)
(12)
For carbon concentration and wood density the following models were used (study V):
(13)
The logistic model was performed with the following structure:
(14)
(15)
Table 1: Summery of the statistical methods used
Data analysis Study I Study II Study III Study IV Study V Linear Mixed Model X X
GLM X X X X
Correlation analysis X X
Logistic X
3.5.3. R- software
4. RESULTS
4.1. Performance and soil condition of selected species in degraded highlands of Ethiopia
(study I)
The four years evaluation result of survival rate, height growth, root collar diameter growth, biomass production and its effect on soil fertility for six (introduced and native) tree and one shrub species under three soil management option: control, addition of manure, addition of manure plus mulch were species dependent. G. robusta and H. abyssinica had good survival rate, while A. decurrense was poorly survived. H. abyssinica and C. palmensis showed poor growth rates while these species showed highest soil improvement conditions. E. globulus and Acacia species outperformed in terms of growth rates and biomass production.
Survival: G. robusta (100 %) showed the highest overall survival rate followed by H. abyssinica
(93.52 %) (Figure 1, study I) where as, A. decurrense showed the lowest survival rate. Differences in survival rate among species appeared when they were compared at time points. A. decurrense
showed the lowest survival rate at all measurement times, though; it was similar to A. saligna
through the experiment. The differences was stronger as early as 24 months after planting (Table III, study I).
48
Fig. 10: Showed the effect of time since planting and soil management on height growth in degraded lands.
Fig. 10 (a): Tree height planted species time since planting. Fig. 10 (b): Height (cm) on soil management
option.
Root collar diameter growth: A. saligna showed a stronger response to manure plus mulch treatment than other species, whereas C. palmensis exhibited increased root collar diameter when either soil management options applied (Figure 2(e), study I). The root collar diameter of A. saligna increased for 36 months after planting. At 48 months, E. globulus showed higher root collar diameter (RCD) average. The other species showed similar values at 12 and 24 months after planting; root collar diameter differences become more pronounced C. palmensis, D. torrida and H. abyssinica had the lowest RCD average at the end of the experiment (Figure 11 (a)). The final model for RCD showed that neither the fixed effects for species and treatment in the slope nor the interaction between species and treatment were significant (Figure 11(b)). E. globulus outperformed all species in height growth but had almost the same root collar diameter as A. saligna at the end of the experiment.
Fig. 11: Showed the effect of time since planting and soil management on root collar dimater growth on
degraded lands. Fig. 11 (a): RCD (cm) planted species time since planting. Fig. 11 (b): RCD (cm) on soil
management option.