Leisure: Analysis of the Use of Time in Spain
Los efectos no monetarios de la educación sobre
el ocio: análisis del uso del tiempo en España
MARCOS FERNÁNDEZ-GUTIÉRREZ Universidad de Cantabria
https://orcid.org/0000-0002-4000-9283
JORGE CALERO Universidad de Barcelona [email protected]
https://orcid.org/0000-0001-8443-5412
Resumen: El análisis de los efectos de la educación se ha centrado tradicionalmente en aspectos mone-tarios, mientras que los efectos no monetarios (tales como aquellos en el uso del tiempo) han recibido menor atención. Este artículo analiza los efectos de la educación sobre el empleo del tiempo de ocio en España, a partir de la Encuesta de Empleo del Tiempo. Los resultados muestran una intensa relación entre el nivel educativo y la dedicación de tiempo a actividades culturales y deportivas y a la lectura de libros y de pren-sa. Los resultados muestran también, en consonancia con una perspectiva institucionalista, que un mayor nivel educativo no incrementa automáticamente la participación en todas las actividades de ocio benefi -ciosas, sino que dicho efecto se derivaría del entorno social y los valores de los individuos.
Palabras clave: Educación, Efectos no monetarios, Uso del tiempo, Ocio.
Abstract: The analysis of the effects of education have traditionally focused on income (the monetary effects), whilst other non-monetary effects of educa-tion (such as those on the use of time), have received less attention. This paper analyses the effects of edu-cation on individuals’ use of their leisure time in Spain, using data from the Spanish Time Use Survey. It fi nds a close relation between education and the dedication of time to cultural activities, sports and reading books and the press. It also fi nds that a higher educational attainment does not automatically increase participa-tion in all the leisure activities considered as benefi cial. The effects, according to an institutionalist perspec-tive, will be derived from social environment and indi-vidual’s values.
INTRODUCTION
I
n the fi eld of the analysis of education from an economic perspective (that is, Economics of Education), signifi cant advances have been made in measuring and evaluating performance in education and its impact, proving to be an in-dispensable tool in the design of education policies. Studies have focused primarily on the so-called monetary effects, that is, the increase in income associated with the acquisition of a higher level of education (Bils and Klenow, 2000). Fewer stud-ies have analysed the non-monetary effects of education: those consequences of ac-quiring a specifi c level of education not directly associated with a pecuniary benefi t (Wolfe and Zuvekas, 1997; Oreopoulos and Salvanes, 2011).The non-monetary effects of education are refl ected in a broad spectrum of elements, such as health habits, consumer behaviour and patterns of decision-mak-ing in the family and social domains. Accorddecision-mak-ing to the estimations of Haveman and Wolfe (1984), the magnitude of the non-monetary effects of education is no smaller than that of its monetary effects. As a result, the analysis of these effects is of great importance in fully evaluating the individual and social benefi ts of educa-tion and, therefore, in designing educaeduca-tional policies. Among the analyses of the non-monetary effects of education, most of the studies have focused on individuals’ consumption decisions and expenditure (Fernández-Gutiérrez and Calero, 2011). Fewer studies have focused on another quite different dimension, but one which is particularly important for this purpose: the use of time. Education is closely related to the diversity of activities that individuals carry out in their free time, in turn having a positive impact on them, promoting benefi cial personal outcomes and enhanced social integration (Stalker, 2011). For this reason, understanding and measuring the infl uence of education on the use of time is critical for an in-depth analysis of its individual and social effects.
which in turn may affect decisions on the use of time, the separation of the effects associated with income (that is, the monetary effects of education) and those spe-cifi cally associated with education (the non-monetary effects) is essential. For this reason, as the information on individual income provided by the Spanish Time Use Survey is limited to the population in employment, the analysis carried out in this paper focuses only on individuals in employment. This paper, following the approach described above, constitutes an updated contribution to the scarce litera-ture existent in Spain on the non-monetary effects of education, providing also a new perspective, based on the use of time. Thus, the results obtained contribute to the furthering of the existing understanding of education and its consequences for individuals in their role as citizens, as well as for the society in which they are integrated.
The rest of this article is structured as follows. After this introduction, the second section describes those areas in which the literature has identifi ed particu-larly relevant non-monetary effects of education, emphasizing those related to the use of leisure time. The third section examines different interpretations of the nature of these effects. The fourth section describes the source, variables and the methodology used in the analysis. The fi fth section presents the results obtained from it and the conclusions and implications of the analysis are discussed in the sixth section.
THENON-MONETARYEFFECTSOFEDUCATION: ANOVERVIEW
The non-monetary effects of education are observable in a broad range of dif-ferent aspects, as refl ected in the extensive reviews undertaken by Haveman and Wolfe (1984), Wolfe and Zuvekas (1997) and Calero, Gil-Izquierdo and Fernández Gutiérrez (2011).
impacts health as a result of general living conditions, air pollution and the prob-ability of having an accident (Feinstein et al., 2006). Similarly, a relationship has been found between higher educational levels and less exposure to occupational hazards (Wolfe and Zuvekas, 1997). All these aspects have a bearing on the non-monetary effects of education detected in relation to health outcomes: lower prob-ability of suffering physical limitations in regular activities, being obese or hospi-talised (Feinstein et al., 2006), or of suffering from depression (Miech and Shana-han, 2000) and a greater probability of reporting good health (Groot and Maasen Van den Brink, 2005).
Whilst health has been an area of particular interest in the analysis of these effects, education has a broader general impact on the development of individuals’ preferences, which in turn underpin most of their consumption and time-use deci-sions (Calero et al., 2011; Oreopoulos and Salvanes, 2011). Specifi cally, education infl uences the leisure activities individuals might engage in and the amount of time they dedicate to them (the non-monetary effects of education on leisure). A higher level of education (and not only the higher income associated with it) has been shown to increase preferences for activities such as reading, music, art and travel, and the amount of time dedicated to them (Haveman and Wolfe, 1984; Favaro and Frateschi, 2007; Ateca Amestoy, 2009).
In the case of Spain, Escardíbul (2002) found a positive relation between edu-cational attainment and households’ expenditure on theatre and music shows, as well as the consumption of a set of cultural goods. From the perspective of Cultural Economics, rather than that of Economics of Education, scholars have highlighted the role of education as a determinant of participation in cultural activities (Prieto Rodríguez, Pérez Villadóniga y Suárez Fernández, 2018). In Spain, Ateca Amestoy (2010) found that attainment of higher education is a strong predictor of participa-tion in every cultural form, including artistic performances, cultural media (books, music and so on) and practice of cultural activities. In other research, Muñiz, Rod-ríguez and Suárez (2011) found that education, in Spain, is positively associated with time spent on both cultural activities and sports (albeit the intensity of this effect is higher for cultural activities). In addition, Muñiz, Rodríguez and Suárez (2017) found that education is an important determinant of both the probability of participating and the frequency of participation in cultural activities.
by Stalker (2011). Peterson (1992) and Peterson and Kern (1996) used the term “cultural omnivorousness” to describe the way in which the highest social classes embraced the activities characteristic of the lower social classes. More recently, and closely related to the idea described above, Warde and Gayo-Cal (2009) have used this concept of “cultural omnivorousness” to defi ne the preferences of individuals with a higher educational level for a greater number of different leisure activities.
Studies have also detected non-monetary effects of education on the imme-diate circle of family and friends. These effects contribute notably to explaining the close relation between the educational level achieved by the parents and that subsequently attained by their children (Wolfe and Zuvekas, 1997). This relation-ship does not only depend on parents’ income, but also on the transmission of culture, determined by the environment and, in particular, by the family (Checchi, 1997; Nagel, 2010). It has been found that parents with higher levels of education dedicate more time to their children, which has an impact on their cognitive devel-opment (Gutiérrez-Domènech, 2010), and that the parents’ educational level also affects their children’s leisure habits, including, for example, their participation in cultural activities and physical exercise (Quarmby and Dagkas, 2010), and their reading habits (Wollscheid, 2014).
Finally, the non-monetary effects of education also impact on society as a whole. Research has found a relationship between education and social mobil-ity (Checchi, 1997); a reduction in criminal activmobil-ity (Haveman and Wolfe, 1984); greater civic participation and personal involvement in social activities (Huang, Maasen Van Den Brink and Groot, 2005; Wolfe and Zuvekas, 1997), and a greater concern and respect for the environment and its conservation (Worsley and Skr-zypiec, 1998).
HOWTOINTERPRETTHEEFFECTSOFEDUCATIONONLEISURE?
decision as to whether an individual allocates their time to leisure or to another activity (such as work) and, if opting for the former, on which leisure alternative is preferred. From this perspective, a higher education level would result in a more effi cient use and combination of inputs (consumption and time use) so as to obtain a greater number of positive outputs. Education would also lead to greater value being given to future benefi ts associated with consumption decisions, and as a re-sult to more appropriate decisions being made throughout the life cycle. As such, the neoclassical approach considers the non-monetary effects of education to be always benefi cial, referring to them as the non-monetary benefi ts of education.
From the alternative perspective of institutional economics, the non-mon-etary effects of education are seen as a result of the infl uence of the institutional environment (including the family, the social environment and personal charac-teristics) in forming individual preferences, which in turn are the basis for mak-ing decisions about consumption and lifestyle (Escardíbul, 2002; Escardíbul and Calero, 2006). Here, education is conceived as a critical element in the shaping of this institutional environment and, hence, in the development of an individual’s patterns of consumption and time use. From this approach, the non-monetary effects of education do not always result in positive patterns of consumption and behaviour. As a result, this perspective does not speak of “benefi ts” but rather of the non-monetary effects of education. The perspective of institutional eco-nomics connects the economic view on education with that derived from other disciplines, such as sociology. From a sociological perspective, Stalker’s (2011) analysis of the diversity of leisure activities identifi es education as one of the keys, together with economic status, for explaining individual consumption and behaviour in relation to leisure.
DATAANDMETHODOLOGY
To address the objectives of this article, the following hypotheses are tested: H1. An individual’s level of education infl uences the time they dedicate to a range of leisure activities. Were this hypothesis to be confi rmed (after controlling for the effects of other factors, including income), it would indicate the existence of non-monetary effects of education on the use of leisure time, the magnitude of which can then be estimated.
and Zuvekas, 1997; Feinstein et al., 2006); consuming newspapers (Escardíbul and Villaroya, 2009) and books (Fernández-Gutiérrez and Calero, 2011).
H3. A higher level of education has an unequivocally positive relationship with the time spent on the leisure activities analysed. Were this hypothesis to be confi rmed, the non-monetary effects of education could be explained in terms of the neoclassical perspective. In contrast, if they were linked exclusively to specifi c levels of education, the institutional approach would need to be incorporated to an explanation of the effects.
H4. A higher level of education is associated with a greater diversity of leisure preferences. This would be in line with the concept of “cultural omnivorousness”, understood in terms of the actual volume of cultural activities (Warde and Gayo-Cal, 2009).
To empirically analyse these hypotheses, we use the microdata from the Span-ish Time Use Survey (Encuesta de Empleo del Tiempo, henceforth, the EET) (INE, 2011), corresponding to the fourth quarter of 2009 and the fi rst three quarters of 2010. This survey provides information on the distribution of time use of the Spanish population, based on the keeping of a diary, in which the sample sub-jects noted the sequence and duration of all their activities in a 24-hour period, at 10-minute intervals. The design of these time-use surveys, common across Euro-pean countries, avoids errors linked to the overestimation of activities considered ‘desirable’ by society (Wollscheid, 2014). The EET also gathers information on the socioeconomic characteristics of the respondents and their households. The EET 2009-2010, with a sample size of 19,925 individuals, provides information on 2,778,480 time intervals, distributed in 115 categories of activities.
In our analysis, our dependent variable is the logarithm of time (in minutes) dedicated by each individual to the following activities:
— Cultural activities outside the home. This includes the following survey categories: “Cinema” (category nº 521), “Theatre and concerts” (522), “Art exhibitions and museums” (523) and “Libraries” (524). The cultural activi-ties are deemed benefi cial insofar as they increase an individual’s cultural capital and knowledge and, as a result, those of society as a whole. A review of economic arguments which, based on the social value of cultural activi-ties, may justify public policies to promote participation in them, can be found in Aguado Quintero and Palma Martos (2011).
ben-efi cial for the future health of those that participate in them, which also makes them benefi cial from a social perspective.
— Reading the press (811). This includes reading newspapers, magazines and other periodical publications. We consider the undertaking of these activi-ties to be representative of individuals’ cultural capital and their level of involvement in matters of social interest. This means these activities are also associated with benefi cial effects, linked to greater civic participation and involvement.
— Reading books (812), including novels, manuals, instructive books and oth-ers, for reasons other than work, study or religious practices. Reading books is deemed as being benefi cial, increasing the cultural capital and knowledge, as in the case of cultural activities.
— Watching television (821). Watching DVDs or videos, following courses, study programmes or religious services on TV are not included in this category by the survey – all these are included in other categories. This activity is one of the most common leisure options, and one in which in-dividuals sit quite passively in front of the screen. Authors such as Ateca Amestoy (2010) have found that those with higher educational attainment usually dedicate less time to this activity. In contrast to the other activities itemised above, it is not associated, a priori, with obvious benefi ts. It is included in the analysis so that comparisons can be drawn with the results of the other activities.
— Games. This includes “Solo games, gambling” (731) and “Social games” (732). Computer games and those played on mobile devices, and other un-specifi ed games, are included in other categories. As with watching televi-sion, these are leisure activities which are not expected to offer any particu-lar benefi ts. They are also included so that comparisons can be drawn with the results of the other activities.
Our main independent variables, central to our study, are those representing the level of education attained. Adhering to the simplifi ed classifi cation provided by the EET, these variables allow us to differentiate fi ve levels of education for the sur-vey respondents: primary education or primary education incomplete (PRIMED)
– which serves as our reference category; lower secondary education (SECED1); upper secondary education (SECED2); higher level vocational training (VOCTR); and university education (UNIVED).
— Number of hours usually worked each week (WORKH), given that the longer the time spent at work, the less time an individual has available for all other activities.
— Age of respondent (AGE) and the square of this variable (AGE^2).
— Gender, differentiating women (WOMAN) from men – which serves as a reference category.
— Nationality, differentiating between those born in Spain – which serves as a reference category – from those born in another EU country (FOREU) or outside the EU (FORNONEU).
— Individual’s monthly net income. As stressed by Oreopoulos and Salvanes (2011), this is essential for the analysis as it allows us to separate the mon-etary (associated with income) effects from the non-monmon-etary effects of education. Based on the income brackets employed in the EET and tak-ing that of 601 to 1,200 euros (the most frequent) as our reference cat-egory, we introduce fi ve control variables corresponding to the following income brackets of the respondents: up to 600 euros (INC<601); 1,201 to 1,600 euros (INC1201-1600); 1,601 to 2,000 euros (INC1601-2000); 2,001 to 2,500 euros (INC2001-2500), and more than 2,500 euros (INC>2500). The survey only provides this information for individuals in employment. As a result, as explained in the introduction, the whole empirical analysis developed in this paper is limited to this group. Employed individuals not reporting their income are also excluded.
— The quarter of the year corresponding to the activities reported in the diary is included to correct for the effect of the time of year. The fi rst quarter is taken as a reference category and the control variables corresponding to the remaining quarters are included as QUA2, QUA3 and QUA4.
— The day of the week corresponding to the activities reported in the diary is also included, given that this also affects the time dedicated to each activity. The aggregate of Monday, Tuesday, Wednesday and Thursday serves as a reference category and the control variables corresponding to the remain-ing days of the week are included as FRIDAY, SATURDAY and SUNDAY.
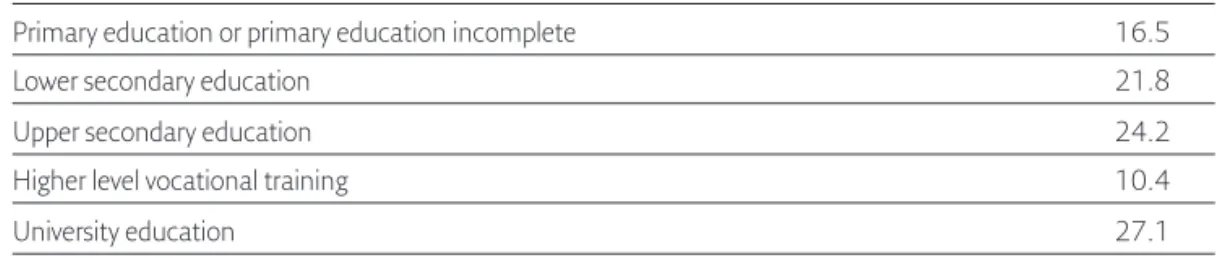
Table 1. Weighted distribution of the sample according to educational level
EDUCATIONAL LEVEL %
Primary education or primary education incomplete 16.5
Lower secondary education 21.8
Upper secondary education 24.2
Higher level vocational training 10.4
University education 27.1
Source: Based on INE (2011)
As regards the econometric analysis, the amount of time dedicated by the individu-als to the activities shows a high number of observations which present a value of zero (that is, the activity was not performed by the individual on the day of the survey). This may produce a bias in estimations using ordinary least squares. In order to correct this bias, we follow the methodology applied by Vaara and Ma-tero (2011) for modelling time use in leisure activities. This consists in a two-part model, in which the time dedicated to an activity is modelled as a decision made in two sequential and independent stages: the fi rst, whether or not to engage in the activity, and if affi rmative, the second, how much time to allocate to it. The two-part model can be expressed as follows:
f(y|x)=
{
(Pr (d =1|x) Pr (d =0|x), if y = 0where:
y= time, in minutes, dedicated to the activity in question.
x= vector of independent variables.
d is a binary variable taking value of 0 when y = 0 (the activity is not carried out), and 1 when y > 0 (the activity is carried out).
The effect of the level of education on the probability of each activity being car-ried out is estimated in the fi rst step of the model, correcting for the effect of the control variables, using probit estimates as follows:
Pr (di =1|x) = Φ (xi' β)
From these estimates we obtain the marginal effects associated with each educa-tional level, which indicate the expected increase in the probability of carrying out
the activity, in absolute values; and the semi-elasticities, which indicate the increase in this probability expressed in percentages.
The effect of the level of education on the time dedicated to each activity by those who carry it out is estimated in the second step of the model, using OLS as follows:
ln(yi|d =1,x) = xi' β + ui
Finally, to test the fourth hypothesis, we take the number of activities carried out by each individual on the day in question as the dependent variable. The effect of the level of education on this variable, correcting for the effects of the control vari-ables, is estimated using an ordered probit as follows:
Pr (ni = j) = Φ(αj – xi' β) – Φ(αj – xi' β)
where j = 1, …, m, and m is the number of activities analysed.
RESULTS
Descriptive analysis
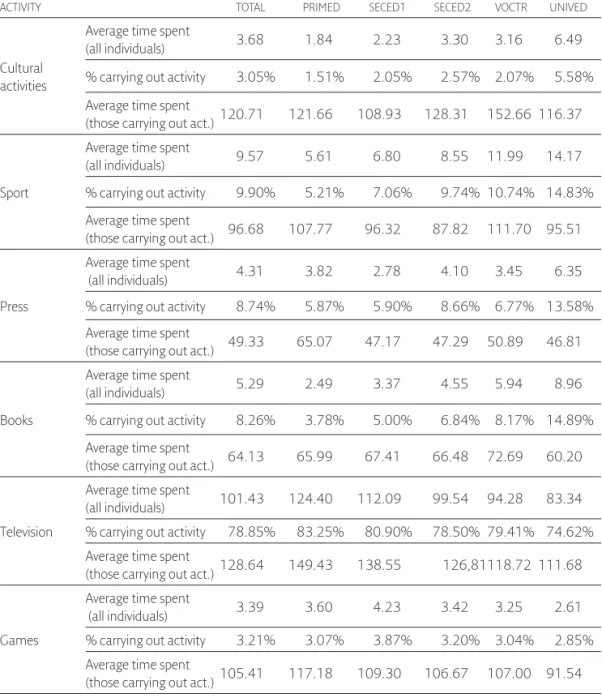
Table 2 describes individuals’ time use in relation to the activities analysed. For each activity, the average amount of time spent by the individuals (unconditional average), the percentage of them who carried out the activity on the day of the survey, and the average amount of time these individuals spent on the activity (con-ditional average) are given, broken down by educational level.
The time spent on cultural activities, sport, and reading the press and books, as well as the percentage of individuals who carried out these activities, increases as the level of education rises. Television (by far, the activity on which most time is spent) and games present the reverse trend: the time spent by individuals as well as the percentage of individuals carrying out these activities tends to decrease as the level of education rises.
attain-ment and the decision of participating or not in each activity, rather than from differences in the time spent on each activity among those who participate in it.
Table 2. Time spent on activities, as a function of educational level
ACTIVITY TOTAL PRIMED SECED1 SECED2 VOCTR UNIVED
Cultural activities
Average time spent
(all individuals) 3.68 1.84 2.23 3.30 3.16 6.49
% carrying out activity 3.05% 1.51% 2.05% 2.57% 2.07% 5.58%
Average time spent
(those carrying out act.)120.71 121.66 108.93 128.31 152.66 116.37
Sport
Average time spent
(all individuals) 9.57 5.61 6.80 8.55 11.99 14.17
% carrying out activity 9.90% 5.21% 7.06% 9.74% 10.74% 14.83%
Average time spent
(those carrying out act.) 96.68 107.77 96.32 87.82 111.70 95.51
Press
Average time spent
(all individuals) 4.31 3.82 2.78 4.10 3.45 6.35
% carrying out activity 8.74% 5.87% 5.90% 8.66% 6.77% 13.58%
Average time spent
(those carrying out act.) 49.33 65.07 47.17 47.29 50.89 46.81
Books
Average time spent
(all individuals) 5.29 2.49 3.37 4.55 5.94 8.96
% carrying out activity 8.26% 3.78% 5.00% 6.84% 8.17% 14.89%
Average time spent
(those carrying out act.) 64.13 65.99 67.41 66.48 72.69 60.20
Television
Average time spent
(all individuals) 101.43 124.40 112.09 99.54 94.28 83.34
% carrying out activity 78.85% 83.25% 80.90% 78.50% 79.41% 74.62%
Average time spent
(those carrying out act.)128.64 149.43 138.55 126,81118.72 111.68
Games
Average time spent
(all individuals) 3.39 3.60 4.23 3.42 3.25 2.61
% carrying out activity 3.21% 3.07% 3.87% 3.20% 3.04% 2.85%
Average time spent
(those carrying out act.)105.41 117.18 109.30 106.67 107.00 91.54
Econometric analysis
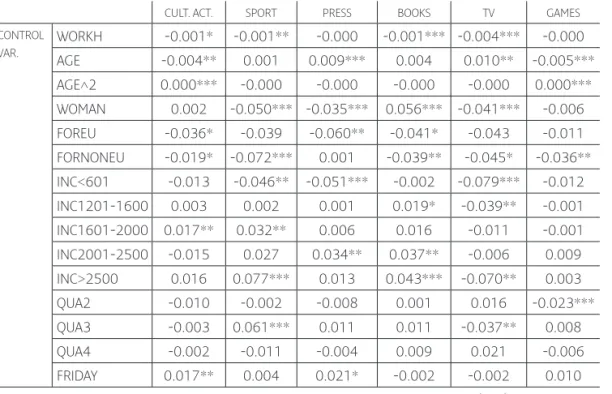
Table 3 shows the marginal effects obtained from the probit estimations, which capture the variation in probability of each of the activities being carried out as a function of educational level and the control variables. Table 4 shows the semi-elasticities obtained from these estimations, which show that variation in terms of percentage values. Table 5 shows the effects of educational level and of the other variables on the amount of time spent on each activity by those individuals that actually carried them out.
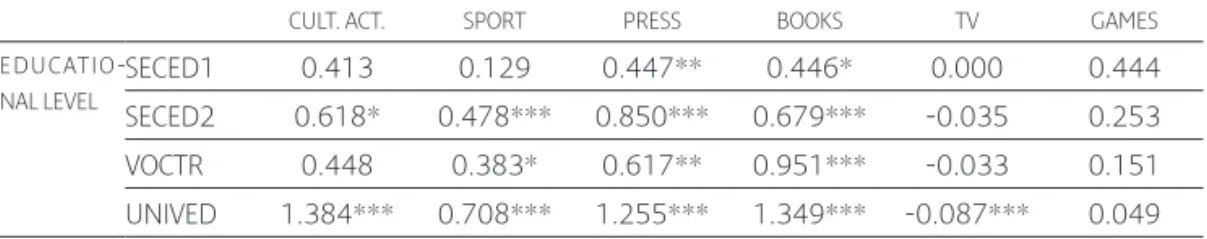
Cultural activities. There is a signifi cant positive relation between university education and the time dedicated to these activities. The semi-elasticities estimated show that an individual with university education is 138.4% more likely to engage in cultural activities (that is, the probability is 2.38 times higher) than an individual in the reference category (primary education or primary education incomplete), after controlling for the effects of the control variables. In the case of the other educational levels, only individuals with upper secondary education present a sig-nifi cant positive effect, with the probability of their engaging in this activity being 61.8% higher than for the reference category. When considering only those indi-viduals that carried out this activity, educational level shows no signifi cant effect on the amount of time dedicated to it, except the positive effect observed for those with higher level vocational training.
Sport. In comparison with the reference category, the probability of being involved in a sports activity increases by 47.8% and 38.3%, respectively, for indi-viduals with upper secondary education and higher level vocational training. In the case of university education, the effect is higher: 70.8%. In contrast, the effect is not signifi cant for lower secondary education. When we consider only those indi-viduals that actually carried out this activity, educational level shows no signifi cant effect on the amount of time dedicated to it.
Books. As with reading the press, education has a positive effect on the prob-ability of reading books, which tends to increase with rising educational levels. Compared to the reference category, the probability increases by 44.6% in the case of lower secondary education, 67.9% for those with upper secondary education, 95.1% for those with higher level vocational training, and 134.9% for individuals with a university education. Educational level has no signifi cant effect on the time dedicated to this activity by those who reported carrying it out.
Television. Having a university education reduces the probability of watching television on the day of the survey by 8.7% (compared to the reference category). However, no signifi cant relation is found between the other educational levels and the probability of carrying out this activity. When we consider only those individuals that carried out this activity, a higher educational level is associated with the dedica-tion of less time to it (except for those with lower secondary educadedica-tion): 9.4% less for those individuals with upper secondary education, 12.8% for higher grade vocational training, and 18.6% for university education, compared to the reference category.
Games. In contrast to the other activities, educational level has no effect on the probability of carrying out this activity, nor on the amount of time dedicated to it.
Table 3. Marginal effects on the probability of carrying out the activities
CULT. ACT. SPORT PRESS BOOKS TV GAMES CONTROL
VAR.
WORKH -0.001* -0.001** -0.000 -0.001*** -0.004*** -0.000
AGE -0.004** 0.001 0.009*** 0.004 0.010** -0.005***
AGE^2 0.000*** -0.000 -0.000 -0.000 -0.000 0.000***
WOMAN 0.002 -0.050*** -0.035*** 0.056*** -0.041*** -0.006
FOREU -0.036* -0.039 -0.060** -0.041* -0.043 -0.011
FORNONEU -0.019* -0.072*** 0.001 -0.039** -0.045* -0.036**
INC<601 -0.013 -0.046** -0.051*** -0.002 -0.079*** -0.012
INC1201-1600 0.003 0.002 0.001 0.019* -0.039** -0.001
INC1601-2000 0.017** 0.032** 0.006 0.016 -0.011 -0.001
INC2001-2500 -0.015 0.027 0.034** 0.037** -0.006 0.009
INC>2500 0.016 0.077*** 0.013 0.043*** -0.070** 0.003
QUA2 -0.010 -0.002 -0.008 0.001 0.016 -0.023***
QUA3 -0.003 0.061*** 0.011 0.011 -0.037** 0.008
QUA4 -0.002 -0.011 -0.004 0.009 0.021 -0.006
FRIDAY 0.017** 0.004 0.021* -0.002 -0.002 0.010
CULT. ACT. SPORT PRESS BOOKS TV GAMES CONTROL
VAR.
SATURDAY 0.037*** -0.021* 0.040*** -0.009 -0.032** 0.026***
SUNDAY 0.036*** -0.003 0.073*** 0.014 0.054*** 0.029***
EDUCATIO-NAL LEVEL
SECED1 0.011 0.011 0.031** 0.032** 0.000 0.013
SECED2 0.016* 0.042*** 0.059*** 0.048*** -0.026 0.007
VOCTR 0.012 0.034** 0.043** 0.068*** -0.025 0.004
UNIVED 0.037*** 0.062*** 0.087*** 0.096*** -0.067*** 0.001
N 6,918 6,918 6,918 6,918 6,918 6,918
F 106.03 230.66 310.88 248.87 148.46 87.97
PROB>F 0.000 0.000 0.000 0.000 0.000 0.000 Statistical signifi cance: *>90%, **>95%, ***>99%
Source: Based on INE (2011)
Table 4. Effects of educational level on the probability of carrying out the activities, in percentages (semi-elasticities)
CULT. ACT. SPORT PRESS BOOKS TV GAMES E D U C AT I O
-NAL LEVEL
SECED1 0.413 0.129 0.447** 0.446* 0.000 0.444
SECED2 0.618* 0.478*** 0.850*** 0.679*** -0.035 0.253
VOCTR 0.448 0.383* 0.617** 0.951*** -0.033 0.151
UNIVED 1.384*** 0.708*** 1.255*** 1.349*** -0.087*** 0.049
Statistical signifi cance: *>90%, **>95%, ***>99% Source: Based on INE (2011)
Table 5. Estimates on the time spent on the activities by those that carried them out
CULT. ACT. SPORT PRESS BOOKS TV GAMES
Constant 5.674*** 4.442*** 4.455*** 4.594*** 4.592*** 3.716***
CONTROL VAR.
WORKH 0.005 -0.009** 0.004 -0.005 -0.005*** 0.003
AGE -0.070*** 0.022 -0.046 -0.031* 0.002 0.015
AGE^2 0.001*** -0.000 0.000 0.000* 0.000 -0.000
WOMAN -0.043 -0.192*** -0.183*** 0.012 -0.156*** -0.108
FOREU 0.354** 0.484*** 0.079 -0.577*** 0.076 0.368
FORNONEU 0.193 -0.217 0.139 0.135 0.126*** 0.793**
INC<601 -0.100 -0.184 0.123 -0.059 -0.012 0.538**
CULT. ACT. SPORT PRESS BOOKS TV GAMES CONTROL
VAR.
I N C 1 2 0 1 -1600
-0.110 -0.094 0.091 0.178* 0.008 -0.220
I N C 1 6 0 1 -2000
-0.112 -0.073 -0.017 0.062 -0.067 0.077
I N C 2 0 0 1 -2500
-0.009 -0.157 0.049 0.082 -0.158*** 0.091
INC>2500 -0.136 -0.269** -0.008 -0.212 -0.100 -0.374
QUA2 -0.048 0.050 -0.076 0.002 -0.057 -0.112
QUA3 -0.123 0.066 0.026 0.159* -0.077** 0.011
QUA4 -0.142 -0.081 -0.086 -0.138* -0.017 -0.186
FRIDAY 0.340** 0.062 -0.007 -0.056 0.059* 0.020
SATURDAY 0.457*** 0.362*** 0.081 0.001 0.312*** 0.581***
SUNDAY 0.296** 0.300*** 0.237*** 0.170** 0.389*** 0.673***
EDUCATIO-NAL LEVEL
SECED1 -0.049 -0.152 -0.243* -0.039 -0.030 -0.089
SECED2 0.087 -0.182 -0.181 -0.060 -0.094** -0.152
VOCTR 0.393* 0.025 -0.090 0.125 -0.128** -0.118
UNIVED 0.117 -0.079 -0.226* -0.132 -0.186*** -0.207
N 194 691 668 621 5,503 215
F 2.21 4.55 3.10 3.16 17.63 3.18
PROB>F 0.003 0.000 0.000 0.000 0.000 0.000
Statistical signifi cance: *>90%, **>95%, ***>99% Source: Based on INE (2011)
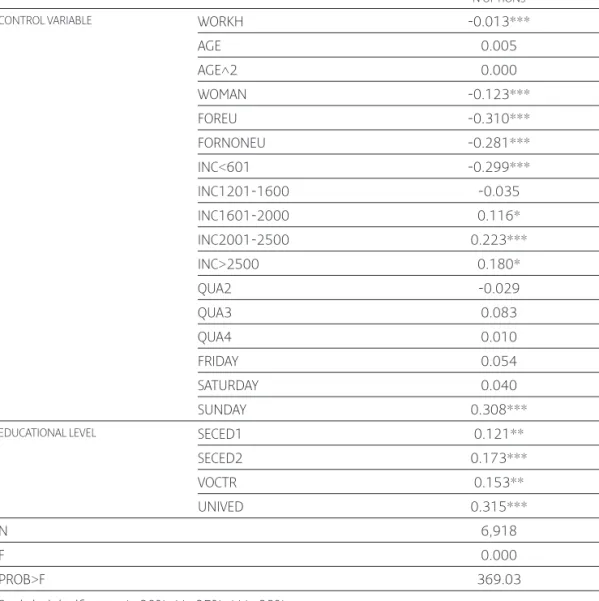
Table 6. Estimates on the number of activities carried out on the actual day of the survey
N OPTIONS CONTROL VARIABLE WORKH -0.013***
AGE 0.005
AGE^2 0.000
WOMAN -0.123***
FOREU -0.310***
FORNONEU -0.281***
INC<601 -0.299***
INC1201-1600 -0.035
INC1601-2000 0.116*
INC2001-2500 0.223***
INC>2500 0.180*
QUA2 -0.029
QUA3 0.083
QUA4 0.010
FRIDAY 0.054
SATURDAY 0.040
SUNDAY 0.308***
EDUCATIONAL LEVEL SECED1 0.121**
SECED2 0.173***
VOCTR 0.153**
UNIVED 0.315***
N 6,918
F 0.000
PROB>F 369.03
Statistical signifi cance: *>90%, **>95%, ***>99% Source: Based on INE (2011)
CONCLUSIONS
associ-ated with pecuniary benefi ts (the monetary effects)– stress the importance of these effects when undertaking a full evaluation of the returns to education and when designing educational policies (Haveman and Wolfe, 1984; Calero et al., 2011). Among them, the non-monetary effects of education on an individual’s use of lei-sure time are highly relevant not only from an individual perspective, but also from the point of view of society and the design of educational policies, as well as leisure policies.
Our analysis of the non-monetary effects of education on the use of leisure time shows that educational level has a deep infl uence on the time dedicated to leisure activities in Spain (non-monetary effects of education on the use of time). The results obtained show a strong relationship between the educational level and the probability of participating in each leisure activity. For most activities, the ef-fect of education as a determinant of participating or not in them exceeds those associated with other variables, including income. A higher educational level is related, in particular, to a greater propensity to participate in activities that gener-ate individual and social benefi ts, such as cultural activities, sport, reading the press and reading books. These results are consistent with those previously found in the fi eld of Cultural Economics (Ateca Amestoy, 2010; Muñiz et al., 2011 and 2017), and serve as a link between them and earlier studies in the fi eld of Economics of Education (Escardíbul, 2002; Calero et al., 2011; Fernández-Gutiérrez and Calero, 2011).
We also obtain that a higher level of education is related to a greater diversity of leisure options. This fi nding is in line with the concept of “cultural omnivorous-ness”, understood from the point of view of the volume of activities (Warde and Gayo-Cal, 2009), where a higher level of education increases the diversity of op-tions to the individual for making use of it. The educational level is negatively re-lated to the amount of time spent watching television, the activity that absorbs the greatest amount of leisure time. As the educational level increases, the probability of dedicating any time to a broader range of activities, including culture, sport and reading the press and books, increases signifi cantly. “Cultural omnivorous-ness” also explains why, when considering only the individuals who carry out each activity, time spent on it is not necessarily higher among those with the highest educational levels, as they tend to share their leisure time between a broader range of alternatives.
books. In contrast, the positive effects on the time dedicated to sport and cultural activities are not signifi cant for the lower secondary educational level. Also, the dif-ference between the magnitude of the effect associated to university education and the rest of levels is particularly high in the case of cultural activities. These results show that a higher level of education is not automatically associated to effects on time dedicated to leisure activities. This evidence suggests that the institutionalist view of the non-monetary effects of education (centred on the role of education in shaping an individual’s social environment) can usefully contribute to an accurate explanation of these effects. The main implication from the institutionalist view is that a higher level of education will not have an impact on all the leisure decisions that are benefi cial for individuals, but on those that are particularly valued in the social environment linked to that level of education (Escardíbul, 2002; Escardíbul and Calero, 2006). It will be the changes in individuals’ environment and values associated with education, and not education per se, which concentrate the highest potential for improving leisure habits.
The evidence obtained underlines the importance of analysing and under-standing the consequences of education from the point of view of individuals’ use of time. The methodology applied allows the effects on the use of time derived from educational attainment (the non-monetary effects) to be separated from those derived from the higher income that a higher education level implies (the monetary effects). A higher level of education is shown to be associated with non-monetary effects consistent in a greater propensity for individuals to dedicate time to lei-sure activities that positively affect their future health (sport), their cultural capital and knowledge (cultural activities and reading books), and their social involvement (reading the press). In general terms, a higher level of education is associated with a more diverse repertoire of leisure activities, which is in turn linked to a better qual-ity of leisure time and greater social integration (Stalker, 2011). For these reasons, these results are relevant not only for educational policies, but also for the design of leisure policies and, in particular, for those policies aimed at boosting individu-als’ participation in activities considered as benefi cial from the social point of view (such as culture and sports).
system without fi nishing more than compulsory studies) (European Commission, 2011). In these efforts Spain, still holding one of the highest early school leaving rates in the EU, is a case in point (Calero et al., 2011). Policies oriented at reduc-ing early school leavreduc-ing focus primarily on the monetary benefi ts that this would imply (such as a higher probability of fi nding a well-paid job). However, as shown in this paper, the acquisition of a higher educational attainment among broader segments of the population may also lead to benefi ts in terms of more benefi cial leisure decisions and a more diverse repertoire of leisure options. These potential benefi ts should be taken into account when designing and evaluating educational policies, as well as leisure policies.
This research, responding to the concerns highlighted by García (2013), re-fl ects that education may be a key tool for promoting equal access to broad leisure options and the benefi ts this implies. Nevertheless, given the complexity detected in the relation between education and leisure decisions, further research is needed to identify which changes in individuals’ environment and values generated by ed-ucation have an impact on leisure decisions. This line of research may also provide insights on policies which, apart from education, may be useful for promoting the further involvement of individuals in benefi cial leisure activities. In the future, as the last Spanish Time Use Survey dates from 2011, and given the deep and fast rise of the use of information and communication technologies, further research will be also needed in order to analyse how individuals’ use of their leisure time has changed, or not, as a result of this emergence of new technologies.
Fecha de recepción del original: 5 de noviembre 2018 Fecha de aceptación de la versión defi nitiva: 18 de enero 2019
REFERENCES
Ateca Amestoy, V. (2009). El capital humano como determinante del consumo cul-tural. Estudios de Economía Aplicada, 27(1), 87-110.
Ateca Amestoy, V. (October, 2010). Cultural participation patterns: Evidence from the Spanish Time Use Survey. Presented at ESA Research Network Sociology of Culture Midterm Conference, Milan.
Bils, M. and Klenow, P. (2000). Does Schooling Cause Growth? American Economic Review, 90(5), 1160-1183.
abandono escolar prematuro. Una aproximación a las pérdidas monetarias y no mon-etarias causadas por el abandono prematuro en España. Madrid: Ministerio de Educación.
Checchi, D. (1997). Education and Intergenerational Mobility in Occupations: A Comparative Study. American Journal of Economics and Sociology, 56, 331-351. Escardíbul, J. O. (2002). Benefi cios no monetarios de la educación sobre el consumo. Un
estudio aplicado al caso español. Madrid: Instituto de Estudios Fiscales.
Escardíbul, J. O. and Calero, J. (2006). Educación, estilo de vida y salud: un estudio aplicado al caso español. Revista de Educación, 339, 541-562.
Escardíbul, J. O. and Villarroya, A. (2009). Who buys newspapers in Spain? An analysis of the determinants of the probability to buy newspapers and of the amount spent. International Journal of Consumer Studies, 33, 64-71.
European Commission (2011). Tackling early school leaving: A key contribution to the Europe 2020 Agenda. Brussels: Communication from the Commission to the European Parliament, the Council, the European Economic and Social Com-mittee and the ComCom-mittee of the Regions.
Favaro, D. and Frateschi, C. (2007). A discrete choice model of consumption of cultural goods: the case of music. Journal of Cultural Economics, 31, 205-234. Feinstein, L., Sabates, R., Anderson, T. M., Sorhaindo, A. and Hammond, C. (2006).
What are the effects of education on health? In R. Desjardins and T. Schuller (Eds.), Measuring the effect of education on health and civic engagement (pp. 171-310). Paris: Organization for Economic Cooperation and Development. Fernández-Gutiérrez, M. and Calero, J. (2011). Los efectos no monetarios de la
educación. Análisis a partir del consumo de los hogares. Revista de educación, 355, 419-442.
García, R. (2013). The George Butler Lecture: Social Justice and Leisure. Journal of Leisure Research, 46(1), 7-12.
Groot, W. and Maasen Van den Brink, H. (2005). The health effects of education.
Economics of Education Review, 26, 186-200.
Gutiérrez-Domènech, M. (2010). Parental employment and time with children in Spain. Review of Economics of the Household, 8, 371-391.
Haveman, R. H. and Wolfe, B. L. (1984). Schooling and economic well–being: The role of nonmarket effects. The Journal of Human Resources, 19, 377-407. Huang, J., Maasen Van Den Brink, H. and Groot, W. (2008). A meta-analysis of
the effect of education on social capital. Economics of Education Review, 28, 454-464.
Kenkel, D. S. (1991). “Health Behavior, Health Knowledge, and Schooling. Jour-nal of Political Economy, 99, 287-305.
Miech, R. A. and Shanahan, M. J. (2000). Socioeconomic Status and Depression over the Life Course. Journal of Health and Social Behavior, 41, 162-176. Muñiz, C., Rodríguez, P. and Suárez, M. J. (2011). The Allocation of Time to
Sports and Cultural Activities: An Analysis of Individual Decisions. Interna-tional Journal of Sport Finance, 6, 245-264.
Muñiz, C., Rodríguez, P. and Suárez, M. J. (2017). Participation in cultural activi-ties: specifi cation issues. Journal of Cultural Economics, 41, 71-93.
Nagel, I. (2010). Cultural Participation between the Ages of 14 and 24: Inter-generational Transmission or Cultural Mobility? European Sociological Review,
26(5), 541-556.
Oreopoulos, P. and Salvanes, K. G. (2011). Priceless: The Nonpecuniary Benefi ts of Schooling. Journal of Economic Perspectives, 25(1), 159-184.
Palma Martos, L. A. and Aguado Quintero, L. F. (2011). ¿Debe el Estado fi nanciar las artes y la cultura? Revisión de literatura. Economía e Sociedade, 20(1), 195-228.
Peterson, R. A. (1992). Understanding audience segmentation: From elite and mass to omnivore and univore. Poetics, 21(4), 243-258.
Peterson, R. A. and Kern, R. (1996). Changing highbrow taste: from snob to om-nivore. American Sociological Review, 61, 900-907.
Prieto Rodríguez, J., Pérez Villadóniga, M. J. and Suárez Fernández, S. (2018).
El consumo cultural: ¿cuestión de gusto o de precio? Observatorio Social de La Caixa. Extraído de https://observatoriosociallacaixa.org/-/el-consumo-cul-tural_cuestion-de-gusto-o-de-precio
Quarmby, T. and Dagkas, S. (2010). Children’s engagement in leisure time physi-cal activity: exploring family structure as a determinant. Leisure Studies, 29(1), 53-66.
Rosenzweig, M. R. and Schultz T. P. (1989). Schooling, Information and Non-market Productivity: Contraceptive Use and Its Effectiveness. International Economic Review, 30(2), 457-477.
Stalker, G. J. (2011). Leisure Diversity as an Indicator of Cultural Capital. Leisure Sciences, 33(2), 81-102.
Vaara, M. and Matero, J. (2011). Modeling Daily Outdoor Recreation Participa-tion and Time-Use as a Two-Stage Choice Process: A Finnish Example. Lei-sure Sciences, 33(4), 269-289.
Wolfe, B. L. and Zuvekas, S. (1997). Nonmarket outcomes of schooling. Interna-tional Journal of EducaInterna-tional Research, 27, 491-501.
Wollscheid, S. (2014). The impact of the leisure reading behaviours of both par-ents on children’s reading behaviour: Investigating differences between sons and daughters. Poetics, 45, 36-54.