Financial development, the structure of capital markets,
and the global digital divide
Charles Amo Yartey
*African Department, International Monetary Fund, 700 19th Street NW, Washington, DC 20431, United States
Received 2 August 2006; received in revised form 25 February 2008; accepted 26 February 2008 Available online 4 March 2008
Abstract
This paper examines the extent to which financial development and financial structure may explain cross-country dif-fusion of information communication technology (ICT). Using panel data for 76 emerging and advanced countries for the period 1990–2003, it finds that credit and stock market development tends to foster ICT diffusion, but financial structure does not appear to have any significant relationship with it. The conclusions, which are consistent with what theory might predict, highlight the role of financial development in the market for knowledge-based products. The finding that financial development is an important determinant of ICT diffusion implies that countries with underdeveloped financial markets may sink even further to the information-poor and noncommunicating side of the global digital divide.
Ó2008 Elsevier B.V. All rights reserved.
JEL classification: G23; G32
Keywords: ICT; Digital divide; Financial development; Financial structure
1. Introduction
The global economy is being driven by greater integration of world markets and the spectacular growth of information and communication technologies (ICTs). Recent events, especially the acceleration of productiv-ity in the United States since 1995, have increased interest in this area; certainly, the acceleration seems to be connected with more investment in ICTs (Chinn and Fairlies, 2004). Interest in the global diffusion of tech-nology has also been increased by arguments that ICT might contribute to the spread of knowledge diffusion by making communication more efficient and might even allow developing countries to leapfrog traditional methods of increasing productivity (Steinmueller, 2001).
The problem, however, is that in many countries technological diffusion is hampered by the limited capacity of networks to carry large amounts of knowledge swiftly and the limited access of individuals even to networks
0167-6245/$ - see front matterÓ2008 Elsevier B.V. All rights reserved. doi:10.1016/j.infoecopol.2008.02.002
* Tel.: +1 202 623 7713; fax: +1 202 589 7713. E-mail address:[email protected]
Information Economics and Policy 20 (2008) 208–227
www.elsevier.com/locate/iep
in which knowledge products are minimal (Adriani and Becchetti, 2003). In this direction, the development of financial markets may affect both ICT diffusion and its impact on economic growth. In particular, well-devel-oped financial markets can make it easier to finance projects designed to increase the capacity of networks and the quality of peripherals.
In this paper, we seek to advance current understanding of the determinants of ICT diffusion. In particular, we examine how financial development and financial structure may explain diffusion of ICT across borders. Using a panel of 76 emerging and advanced countries for the period 1990–2003, the paper addresses two main questions:
1. What is the role of financial development and financial structure in explaining cross-country diffusion of ICT?
2. What kinds of financial system or capital market organization are most conducive to fostering use of ICT in the economy?
The role of finance in promoting technological development has long been controversial. Hicks (1969)
argued on the basis of economic history that the British industrial revolution was made possible by the availability of finance. He believed that the large-scale capital requirements of the industrial revolution could only be met by capital market institutions that permitted the pooling of small individual savings into a large fund for industrial development. Robinson (1952), however, saw finance as responding passively to technological innovation and development, stating that ‘‘where enterprise leads, finance follows”
(p. 123).
This debate has taken a new turn with the emerging emphasis on the importance of financial structure for technological development. This new paradigm has been motivated by the emerging role of technology com-panies in the stock market-based financial system of the United States (Jorgenson, 2001).1The United States has not only experienced fast growth of ICT industries but has also witnessed successful ICT adoption in many areas of the economy (Singh et al., 2001, 2005). It is has been suggested that the major reason the US leads in ICT and Japan and Europe lag has been the encouragement the US stock market has given to ICT. Recent theoretical papers based on endogenous growth models emphasize the capacity of the stock mar-ket to promote innovation and technical progress through such devices as venture capital funds. More specif-ically, the stock market provides a mechanism through which market participants pool their collective knowledge to assess competing new technological inventions. The market is therefore better able to finance the most promising technologies than banks, which do not benefit from the collective wisdom of numerous participants.2
Previous works have examined the nature and determinants of the global digital divide (e.g., Dasgupta et al., 2001; Kiiki and Pohjola, 2002; Chinn and Fairlies, 2004; Dewan et al., 2004). However, none of these has made a serious effort to understand the extent to which finance can explain cross-country diffusion of ICT. Here we are aligning our work with previous efforts but working to expand the results. Whereas many studies are limited to one or two ICT indicators (typically personal computers [PCs] and the Internet) studied over relatively short periods, our analysis covers four indicators over a comparatively long period, 1990–2003. Fur-ther, we conduct our empirical analysis, in a panel data framework and using dynamic panel data analysis techniques.
The remainder of the paper is organized as follows. The next section discusses the role of financial devel-opment and financial structure in the diffusion of technology. Section3discusses the growth of ICT and doc-uments cross-country differences in ICT diffusion. Section4discusses the methodology of the paper. Section5
presents the panel regression results. Section6draws conclusions.
1
The United States, for instance, has many banks that are small relative to large corporations and play a limited role in corporate governance, and a well-developed stock market with an associated market for corporate control. In contrast, Germany and Japan have fewer banks but theirs are relatively larger and are said to play a central governance role.
2
2. Finance, financial structure, and technological development
2.1. Theoretical links
The connection between finance and the real sector has been well established since the pioneering work of
Goldsmith (1969). The link usually emphasized is the role of financial markets in channelling savings toward investment and, more recently, the fact that financial intermediaries are able to solve informational problems that would otherwise lead to inefficient outcomes.Saint-Paul (1992)stressed another link: the impact of finan-cial development on technological choice. In Saint-Paul’s model, the interactions between technological choice and financial markets create an externality that can lead to multiple equilibria. The intuition is that if financial markets are underdeveloped, people will choose less productive but more flexible technologies. With these technologies producers do not encounter much risk, and hence there is little incentive to develop financial mar-kets. Conversely, if financial markets are developed, technology will be more specialized and risky, thereby creating the need for more financial markets. Thus, there is a strategic complementarity between financial mar-kets and technology because both are instruments that can be used for diversification.
Allen and Gale (1999, 2000)created a model to address the normative issue of whether financial markets or intermediaries like banks are better at financing projects where there is diversity of opinion, as in the devel-opment of new technologies. When a new industry starts up, there are several types of uncertainty, primarily about the effectiveness of the technology and about the best management strategies to follow and the effects of each strategy. In stock market-based systems a large number of people participate directly in the investment decision. This is costly because each investor has to acquire the information to make the decision, but it has the great advantage that each investor makes his own decision based on his own information and prior expe-rience. This ability to agree to disagree allows innovative projects to be financed.
Intermediated finance is different. The decision to invest in a new technology is delegated to a manager. Funds can be allocated to a project even if some of the investors providing the funds think the project is a bad one. The intermediary option economizes on the acquisition of information because only the manager needs to become informed. This is fine when investors have homogenous beliefs, but a problem arises when there is a diversity of opinion. Even when managers do their best to choose projects they honestly believe are profitable, diversity of opinion implies that some providers of finance would disagree even if they had the same information as the manager. If the probability of disagreement is sufficiently high, investors may be unwilling to provide funds in the first place. Thus, intermediated finance may underfund innovative pro-jects. The model thus suggests that stock market-based systems will probably lead to more innovation than bank-based systems.
2.2. Stock markets and technological development
Stock market-based systems are considered particularly conducive to innovation, specifically in relation to ICT. The former US Treasury Secretary Lawrence Summers argued, for instance, that the US financial mar-kets have played a major role in providing resources for entrepreneurs who can raise a million dollars before they buy their first suit. The huge investments in new US technology firms that have zero or even negative profits is an obvious refutation of the short-termism of the stock market.
Advocates of stock market-based systems stress the adaptive features of the market for corporate control are lacking in bank-centered systems and the lack of any empirical evidence of short-termism (Gilson, 1996, 1997). The mechanism that allows for hostile acquisitions is regarded as particularly helpful in the selection process, i.e., in making it possible to discriminate between useful technologies that benefit society as a whole by increasing shareholder value and those that do not. Thus, a free market for corporate control, by providing financial discipline, is expected to provide the best guarantee of efficiency in the use of assets (George et al., 1991). Similarly, the ability to effect changes in the management of quoted companies is expected to ensure that managerial resources are used efficiently.
helped to align the interests of employees and shareholders, leading to both greater social efficiency and higher rewards for innovation. The latter derives in part from the exit mechanism the US financial system provides in the form of initial public offerings and takeovers. Both avenues are thought to enormously improve the rewards for innovation compared with bank-based systems that do not have such mechanisms (Black and Gil-son, 1998).
Critics argue that the actual operation of the pricing and takeover mechanism leads to short-termism and a lower rate of long-term investment particularly in specialized human capital (Singh, 1997). This is because prices react very quickly to a variety of information that influences expectations in financial markets. There-fore, stock prices tend to be highly volatile and it is possible to make profits quite quickly. In addition, because the stock market undervalues long-term investments, managers are not encouraged to invest long-term because their activities are judged by the performance of a company’s financial assets; this may harm long-run prospects for companies (Binswanger, 1999).
In sum, the theoretical case that a stock market economy is particularly conducive to fostering technical change is far from unequivocal. The analysis and evidence reviewed suggests that a stock market-based finan-cial system has both positive and negative effects on the promotion of technological change (discussed here in terms only of ICT).
3. Cross-country diffusion of ICT
The extent to which an economy adopts ICT is an indicator of its potential for exploiting the economic opportunities offered by the new technologies, or more generally its prospects for transition to the new econ-omy. Access to ICT has been growing even faster than global economic growth. It is being driven by both demand side factors, such as the increasing popularity of mobile phones and the Internet, and supply side fac-tors, such as regulatory reforms, falling costs and prices for ICT, and technological innovation.
The growth in mobile phones has been particularly phenomenal. Since 2002, around the world there have been more mobile than fixed telephone subscribers. From just 11 million in 1990 the number of mobile phone subscribers exceeded 1.4 billion by the end of 2003 – an annual growth rate of 45%, compared with just 6% for fixed line subscribers. About 20% of the world’s population now have mobile phones, compared with 0.3% in 1991.
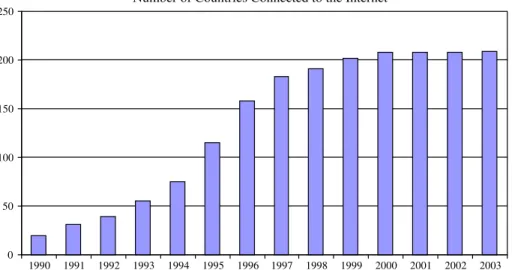
Internet use has also spread at a phenomenal rate. In 1988 only eight countries were online; today virtually every country in the world has an Internet connection. By the end of 2003 the estimated 691 million Internet users around the world represented about 11% of the world population (Fig. 1). The estimated number of
Number of Countries Connected to the Internet
0 50 100 150 200 250
1990 1991 1992 1993 1994 1995 1996 1997 1998 1999 2000 2001 2002 2003
personal computers (PCs) rose from about 120 million in 1990 to 650 million in 2003, when worldwide pen-etration reached 10.1% (International Telecommunications Union, 2005).
In the past 15 years the growth of ICTs has been greatest in the developing world, moderating somewhat the gap between developed and developing countries. In 1992, for example, only 3% of Internet users were from developing countries. Today the figure is nearly 40%. This trend is true for fixed and mobile phones as well as PCs, and it is rising faster than population growth in developing countries.
Despite the impressive ICT growth in recent years, the digital divide continues to separate the information-poor from the information-rich. While at the end of 2003 the developing world made up 85% of the world population, it hosted just 55% of the world’s fixed lines, 53% of mobile subscribers, and 39% of Internet users. In fact, by the end of 2003 the Internet penetration rate of the developed world was still eight times that of the developing world (International Telecommunications Union, 2005).
There are also major regional differences in ICT access and use. While almost half of the population in many advanced countries use the Internet, only 1% of those in sub-Saharan Africa were online at the end of 2003 (Table 1). Several countries, such as Luxembourg and Italy, had more mobile subscribers than pop-ulation but others, like the Democratic Republic of Congo, Ethiopia, and Lao PDR, had penetration rates of less than 3%. Even advanced countries show considerable differences in terms of ICT usage. While in 2003 Denmark had 512 Internet users per 1000 population, Spain had only 239 (Table 2).
Internet penetration rates show similar regional patterns. In North America about half the population use the Internet, but in South Asia and sub-Saharan Africa just over half of 1% do so. As for computer penetra-tion, Switzerland has the highest penetration rate, and the top ten are mostly European countries and Canada. Except for Korea, all are very wealthy.
Clearly, even though technological disparities have been generally decreasing over the past decade, partic-ularly in terms of access to mobile phones and the Internet, there are still major gaps between economies today. In many parts of the world the information economy and society are still a long distance away; many barriers have yet to be identified and removed. This paper attempts to identify factors contributing to the glo-bal digital divide, in particular those related to financial development and financial structure.
In attempting to estimate the nature and determinants of the global digital divide, most researchers have taken a technological perspective that emphasizes access to fundamental information technologies (usually telephone and Internet).Wong (2002)evaluates the digital divide in Asian countries based on numbers of tele-phone mainlines, PCs, and Internet use. Analyzing comparisons of the scale of ICT adoption relative to national income, he finds the digital divide in Asia to be wide, with the potential to become more severe.
Bellock and Dimitrova (2003)examine the impact of income, the level of civil liberties, infrastructure, and regional variables on Internet use in a sample of 105 countries. They find that income is by far the most
impor-Table 1
Access to ICTs by region
Telephones lines Personal computers Internet users
1990 2003 1990 2003 1990 2003
World 10.1 40.5 2.5 10.1 0.05 11.1
Developed 45.4 124.7 11.1 44.9 0.3 44.8
CIS 12 29.4 0.3 6.8 0.0 3.6
Transition economies – Europe 13.8 57.7 0.2 6.5 0.0 13.5
Developing 2.3 25.0 0.3 3.4 0.0 5.1
Northern Africa 2.9 21.0 0.1 2.0 0.0 3.4
Sub-Saharan Africa 1.0 6.0 0.3 1.2 0.0 1.1
Latin America and Caribbean 6.4 40.4 0.6 6.8 0.0 9.0
Eastern Asia 2.4 47.3 0.3 5.6 0.0 8.9
South Asia 0.7 7.1 0.0 1.1 0.0 1.7
South Eastern Asia 1.4 20.9 0.3 2.8 0.0 6.1
Western Asia 10.0 45.8 1.2 5.6 0.0 7.2
Oceania 3.4 10.1 0.0 6.1 0.0 3.8
tant determinant and the relationship appears to be nonlinear. In addition, increasing civil liberties have a positive and significant impact even where there are infrastructure advantages. Using a diffusion model and with the same dependent variable asBellock and Dimitrova (2003), Kiiki and Pohjola (2002)examined data from 60 countries for 1995 through 2000. Using a Gompetz model of technology diffusion, with income per capita, telephone access costs, and average years of schooling as explanatory variables, they found that GDP per capita and cost of Internet access are important factors in OECD countries, but education is not. How-ever, when developing countries are included in the sample, education becomes significant.
For a cross-section of 179 countries,Norris (2000)regressed the number of people online in spring 2000 on a number of variables measuring economic, social, and political development. Other than regional dummies, only GDP per capita and the share of research and development spending in GNP turned out to be statisti-cally significant. Neither adult literacy, secondary education, nor level of democratization had any explana-tory power. In effect economic factors outweighed all others in predicting cross-country differences in access to the Internet. Regional dummies for the Nordic countries, North America, and Western Europe were also significant, which Norris takes to suggest that some social and cultural factors are not being picked up in the model.
4. Methodology
4.1. The model
We test the role of financial development and financial structure in explaining cross-country diffusion of ICT using a modified version of the Gompertz technology diffusion model first introduced by Chow (1983). Let gitdenote ICT use per 1000 in countryi in yeartand gi be its post-diffusion equilibrium level.
Most models of technology adoption assume that over timegittends togi along an S-shaped path.
Table 2
ICT diffusion in selected countries, 2003
Country Computers per 1000 Internet users per 1000 Population
Developed countries
Switzerland 708.66 351.04 7,290,000
United States 658.88 551.38 288,000,000
Singapore 622.04 504.36 4,164,000
Sweden 621.27 573.07 8,924,000
Denmark 576.82 512.82 5,374,300
Australia 565.10 566.66 19,881,000
Norway 528.31 307.23 4,538,000
Canadaa 487.04 512.83 31,630,000
Netherlands 466.63 506.33 16,144,000
United Kingdom 405.70 423.10 59,229,000
Japan 382.16 448.86 127,000,000
Developing countries
Korea 555.84 515.56 47,640,000
Mexico 81.99 98.48 101,000,000
Brazila 74.77 82.24 177,000,000
South Africa 72.60 68.20 45,345,287
Zimbabwe 51.57 42.98 13,000,965
China 27.64 46.01 1,280,000,000
Russia 19.74 63.29 146,000,000
Indonesia 11.88 21.22 212,000,000
Bangladesh 7.77 1.80 138,000,000
India 7.20 15.91 1,050,000,000
Nigeria 7.10 3.50 133,000,000
Pakistan 4.21 10.28 141,000,000
Source: World Development Indicators, 2005.
The Gompertz model of diffusion specifies the rate of change in technological adoption as
loggitloggit1¼hi½loggi loggit1 ð1Þ
wherehis the speed of adjustment.
The equilibrium level of technological adoption will be a function of at least basic demand-side variables, such as income level. Given that income changes over time, we might argue thatg*is time-dependent and express it as
logg
it ¼aiþbilogXit ð2Þ
Substituting and adding a random error term we obtain the following equation:
loggitloggit1¼hiaiþhiblogXithiloggit1þeit ð3Þ
Including measures of financial development and financial structure and other control variables, we specify the following ICT model:
loggitloggiti¼hiaiþhiblogXitþhidFinithiloggit1þeit ð4Þ
wheregis a measure of ICT diffusion. TheXvariables are the control variables consisting of income, electric-ity consumption, telephone cost, urban population, total population, trade as percentage of GDP, and foreign direct investment (FDI) as a percentage of GDP. Fin is a measure of financial development and financial structure. We expect the coefficient of financial development to be positive and that of financial structure to be negative. We fit this model to panel data for 76 countries for the period 1990 through 2003.
4.2. The data
4.2.1. Dependent variable
The dependent variable is ICT diffusion. The choice of the ICT variables was dictated entirely by data avail-ability. We use four measures of ICT diffusion: telephone mainlines per 1000, number of PCs per 1000, Inter-net users per 1000, and mobile phones per 1000. Data on technology and telecommunications are from the World Development Indicators.3Computer and Internet penetration rates are derived from number of PCs and Internet users per 1000.
These measures suffer from two notable deficiencies:
1. The number of PCs may understate total computer use in some countries where mainframe computers are predominant. (This is probably of less concern with the rise of networked PCs.)
2. The number of Internet users is based on estimates of users derived from reported Internet service provider (ISP) subscriber counts or calculated by multiplying the number of Internet hosts by an estimated multi-plier. Thus, Internet use may be understated, particularly in developing countries where many commercial subscribers rent computers connected to the Internet.4
4.2.2. Explanatory variables
Having established a base to evaluate trends in the global digital divide, we turn to analyzing factors that affect its development. We have selected the most likely candidates for inclusion in our model in terms of their importance in past results and data availability.
3 The differences between communication technology and information technology have become blurred. For instance, mobile phones are
primarily tools of communication, but with the advent of wireless applications, consumers can use them to access data and information. The Internet is mainly an indicator of information technology, yet many Internet users communicate with others from their PCs. Thus, all four information indicators have also become tools of communication.
4
4.2.3. Economic and infrastructural factors
The first category includes GDP per capita and cost factors that affect technology adoption decisions. Con-sistent with the evidence suggesting the existence of a digital divide, we would expect a positive relationship between GDP per capita and all the measures of ICT diffusion (see, for instance,Dewan et al., 2004; Quibria et al., 2003; Pohjola, 2003). Income not only affects consumer budget constraints but also preferences for own-ing ICTs. The cost variables are proxies for the costs of acquirown-ing and usown-ing technology, which in our case is represented by the cost of local calls (see Chinn and Fairlies, 2004), which we expect to be negatively associated with ICT penetration. Another important input is power supply. This is proxied by per capita electricity consumption. Unfortunately, we do not have a measure of the proportion of the population with access to electricity, but a positive relationship is again expected between electricity consumption and ICT adoption.
4.2.4. External factors
The second category of variables captures the external environment; it is made up of trade openness and FDI. Trade openness is measured as the sum of the ratio of exports and imports to GDP; it measures how big trade barriers are. Since trade barriers tend to be correlated with other domestic constraints on commerce, trade openness is usually taken to represent the extent of the regulation of the business environment. Both export and imports may offer a channel for increased adoption and diffusion of ICT.5Inward FDI is usually expected to allow recipient economies access to advanced technologies, managerial skills, and more technical know-how. Multinational corporations tend to standardize their operations around the world and train work-ers in host countries to their own skill standards. Thus, it is reasonable to expect higher inward FDI to con-tribute to ICT diffusion.
4.2.5. Demographic factors
The third category of variables is demographic: We control for the proportion of the population residing in urban areas. While the inclusion of this variable is motivated by prior studies (for instance,Forman et al., 2002), its effects on ICT diffusion are ambiguous. On the one hand, the larger the proportion of urban pop-ulation, the higher the demand for information-intensive products and services, and therefore the stronger the derived demand for ICT. On the other, it has been argued that the more urban the population, the less press-ing the need for ICT to compensate for distance-related communication (Forman et al., 2002). In addition to urban population, we control for the size of the population in all regressions.
4.2.6. Financial development and financial structure
Broadly speaking, financial structure can be defined as the institutions, financial technology, and rules of the game that define how financial activities are organized at a particular time (Stulz, 2001). It is crucially important at this stage to distinguish financial structure from financial development. Financial develop-ment simply refers to the developdevelop-ment of well functioning financial markets and intermediaries. It com-prises both increased intermediated savings and an increase in the quality of intermediated services. Financial development depends on the financial structure of the economy and can materialize through infor-mal curb markets, rudimentary banks, modern banks, nonbank financial institutions, and finally the stock market.
In this paper, financial development is measured by a number of variables: stock market capitalization as a percentage of GDP (stock market development); credit to the private sector as a percentage of GDP (credit market development); stock market capitalization together with bank assets as a percentage of GDP (financial development – size); and stock market value traded together with credit to the private sector as a percentage of GDP (financial development – activity). To measure financial structure, we follow the criteria proposed by
Demirguc-Kunt and Levine (1999). We measure financial structure as the ratio of bank assets to stock market capitalization.
5
4.3. Estimation method
Most explanatory variables in our model are either simultaneously determined with the dependent variable or have a two-way causal relationship with it. There is also the possibility that unobserved country-specific effects exist; ignoring them may produce inconsistent estimates given that country-specific effects are likely to be correlated with the explanatory variables. Where there is any correlation between right-hand-side vari-ables and the country-specific effect (ui), estimation methods such as ordinary least squares will not be consis-tent, because the correlation would violate the assumption of strict exogeneity of the explanatory variables. In addition, the orthogonality condition between the error term and the regressors is not likely to be met for either the generalized least squares (GLS) or the fixed effects estimator to produce consistent estimates. It is possible to achieve the orthogonality condition through differencing of the data, but because the equation con-tains endogenous regressors as well as the effects of lagged endogenous variables, the error term in the differ-enced equation is correlated with the lagged dependent variable. In these circumstances neither the fixed effect nor the GLS estimator will produce consistent estimates. It is therefore appropriate to use an estimation pro-cedure that simultaneously addresses correlation and endogeneity.
Arellano and Bond (1991)have proposed a dynamic panel data estimator based on generalized method of moments (GMM) methodology that optimally exploits the linear moment restrictions implied by the dynamic panel ICT model. The dynamic GMM estimator is an instrumental variable estimator that uses as instruments lagged values of all endogenous regressors as well as lagged and current values of all strictly exogenous regres-sors. Equations can be estimated using the levels or the first differences of the variables. For the difference esti-mator the variables are measured as first differences and the lagged values of the variables are used as appropriate instruments.
Arellano and Bond proposed two estimators, one-step and two-step, with the two-step being optimal. Both will be asymptotically equivalent if the error terms are spherical. There is a tendency for the two-step estimator to underestimate the standard errors of estimates, providing a false sense of precision in some circumstances. The usual practice is to estimate with the two-step estimator but base hypothesis tests on the one-step statis-tics. We employ this practice in this paper.
However, before proceeding with the GMM an identifying assumption is necessary. We assume that there is no second-order serial correlation in the first differences of the error term. The consistency of the GMM esti-mator requires that this condition be satisfied. Given the construction of the instruments as lagged variables, the presence of second-order serial correlation will render them invalid. The specification tests for the GMM estimator are the Sargan test of over identifying restrictions and the test of lack of residual serial correlation. The Sargan test is based on the sample analog of the moment conditions used in the estimation process and evaluates the validity of the set of instruments; it therefore determines the validity of the assumptions of pre-determinacy, endogeneity, and exogeneity. Since in this case the residuals examined are those of the regres-sions in differences, first-order serial correlation is expected by construction and thus only second- and higher order serial correlation is a sign of misspecification.
5. Empirical results
This section presents the results of the empirical analysis of data for a large number of developed and emerging economies. To test the robustness of the model, four equations were estimated. We use the same explanatory variables for each ICT indicator, based on the hypothesis that the same factors are likely to influ-ence country Internet penetration, PC use, and fixed and mobile phone use. Income, FDI, trade, financial development, and financial structure may be especially relevant determinants of all our ICT indicators.
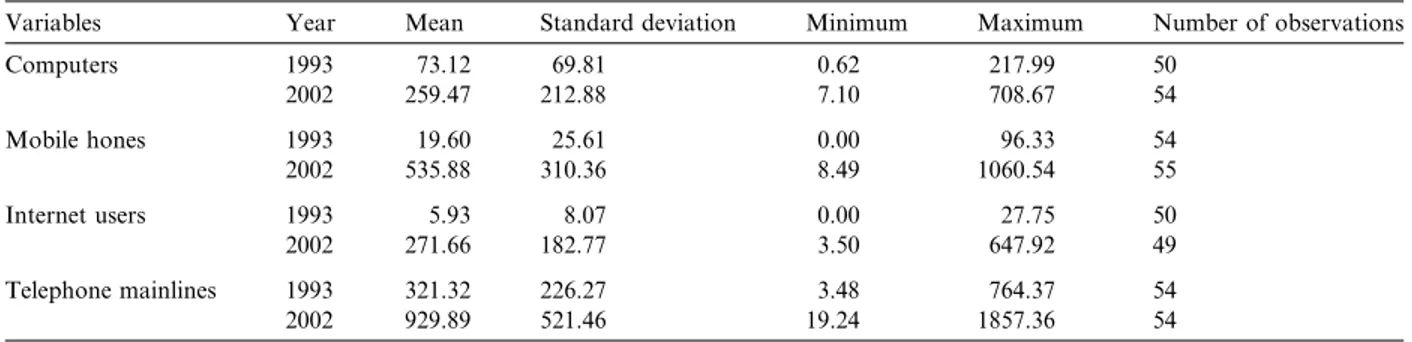
Summary statistics for the ICT indicators are provided inTable 3. It is clear that, worldwide, average pen-etration levels have grown significantly in all four technologies, especially in the last decade. The penpen-etration rate for PCs has more than tripled, from an average of 69.8 per 1000 in 1993 to 212.9 in 2002. Similarly, mobile phone use has surged, from an average of 25.6 per 1000 in 1993 to 535.9 in 2002.
1. Financial development is positively associated with all four indicators of ICT diffusion. 2. Financial structure is negatively associated with all four indicators of ICT diffusion.
Table 4displays the statistical results from estimating the model with telephone mainlines per 1000 as the dependent variable. Model 1 is the baseline using variables such as lagged telephone mainlines, stock market development, credit market development, FDI, trade openness, telephone cost, electricity consumption, and log of GDP per capita. The model captures the process of diffusion because the coefficient of the lagged depen-dent variable proves significant. The analysis also shows that both stock market development and credit mar-ket development are positively associated with ICT diffusion measured by telephone mainlines. In particular, a percentage point increase in stock market development increases the diffusion of telephone mainlines by 0.49 percentage points. Similarly, a percentage point increase in credit to the private sector as a percentage of GDP increases telephone mainlines diffusion by 0.28 percentage points. As expected, GDP per capita, FDI, lag of telephone mainlines, and trade openness are all positive and significant. The cost of telephone calls has an insignificant negative relationship with the diffusion of telephones. Per capita electricity consumption and tele-phone cost are both positive but not significant. Population enters with a highly significant positive sign. FDI, trade openness and GDP per capita are all positive and significant.
In Model 2 we examine the impact of financial structure and financial development (overall size) on the diffusion of telephone mainlines. Lag of telephone mainlines, FDI, trade openness, GDP per capita, and finan-cial development (size) are all significant and positive. In particular, a percentage point increase in the finanfinan-cial development increases telephone mainlines by 0.45 percentage point. Financial structure, however, is negative, indicating that economies with a high ratio of banks to stock markets tend to have fewer telephone mainlines. However, the relationship is statistically not significant. Per capita electricity consumption and urban popu-lation are both not significant. Popupopu-lation is negative and highly significant.
In Model 3 we examine the impact on telephone mainlines of financial development, measured as the sum of credit to the private sector as a percentage of GDP and stock market value traded as a percentage of GDP. This indicator is called financial development (activity) because credit to the private sector represents the extent of the activities of financial intermediaries, and stock market value traded represents stock market activity. Lag of telephone mainlines, FDI, trade openness, income level, financial development (activity), and financial structure are all positive and significant. For instance, a percentage point increase in the activities of financial intermediaries and stock markets increases ICT diffusion by 0.33 percentage points. Similarly, a percentage point increase in the ratio of bank assets to stock market capitalization increases ICT diffusion by 10.74 percentage points. Population is negative and significant. Urban population enters with an insignif-icant negative coefficient. Per capita electricity consumption is positive but not significant.
We now take up the results for mobile phone penetration. To maximize comparability with the results for telephone mainlines, we retain all the explanatory variables in our specification.Table 5presents the estimates with mobile phones as the ICT indicator. In Model 1 we have the baseline, with credit to the private sector and stock market capitalization, both as a percentage of GDP, as the indicators of financial development. The
Table 3
Summary statistics on measures of ICT development
Variables Year Mean Standard deviation Minimum Maximum Number of observations
Computers 1993 73.12 69.81 0.62 217.99 50
2002 259.47 212.88 7.10 708.67 54
Mobile hones 1993 19.60 25.61 0.00 96.33 54
2002 535.88 310.36 8.49 1060.54 55
Internet users 1993 5.93 8.07 0.00 27.75 50
2002 271.66 182.77 3.50 647.92 49
Telephone mainlines 1993 321.32 226.27 3.48 764.37 54
2002 929.89 521.46 19.24 1857.36 54
model does capture the process of diffusion – the coefficient on the lagged value of this variable is significant. FDI, trade openness, GDP per capita, and stock market development also are all positive and significant. A percentage point increase in stock market development increases ICT diffusion by 0.32 percentage points. Credit market development this time is not significant even though it has the expected positive sign. Telephone cost and total population are negative and significant.6Urban population and per capita electricity consump-tion have insignificant negative signs.
Table 4
Financial development, financial structure, and ICT GMM estimation dependent variable: telephone mainlines per 1000
Model 1 Model 2 Model 3
Lag of telephone mainlines 0.8493 0.8684 0.8364
(51.87)*** (55.40)*** (49.18)***
Foreign direct investment 2.9193 2.711 2.7972
(7.07)*** (6.08)*** (6.86)***
Trade openness 0.9754 1.0106 0.9619
(3.98)*** (3.98)*** (3.59)***
Urban population 1.866 2.4555 2.6675
(1.08) (1.37) (1.48)
Telephone cost 1.1277 0.6401 6.1939
0.23 (0.13) (1.13)
GDP per capita 128.4285 133.7 102.309
(2.63)*** (2.61)*** (1.93)***
Electricity consumption 0.5678 8.1533 1.0162
0.02 0.21 0.03
Population 50.967 47.4735 53.7296
(5.48)*** (5.11)*** (5.48)***
Stock market development 0.4903 (7.73)***
Credit market development 0.2814 (1.81)
Financial structure 1.0347 10.7383
(0.22) (2.72)***
Financial development (size) 0.4476
(6.35)***
Financial development (activity) 0.3246
(5.00)***
Number of observations 540 564 515
Sargan test of over identifying restriction Chi2(65) = 398.38 Chi2(65) = 393.48 Chi2(65) = 385.90 [0.0000]*** [0.0000]*** [0.0000]***
Test of 1st order residual autocorrelation Z=5,75 Z=3.77 Z=6.30 [0.0000]*** [0.0002]*** [0.0000]***
Test of 2nd order residual autocorrelation Z= 0.27 Z=0.91 Z=1.27
[0.7874] [0.3641] [0.2041]
Notes: All variables are in first differences and all regressions include time dummies.Tvalues in parenthesis andpvalues in squared brackets. ***,**,and * implies significant at 1%, 5%, and 10% significant levels.
6
In Model 2 we examine the impact of financial structure and financial development on the diffusion of mobile phones. The results show that lag of mobile phones, FDI, trade openness, GDP per capita, and cial development are all positive and statistically significant. In particular, a percentage point increase in finan-cial development increases ICT diffusion by 0.19 percentage points. Finanfinan-cial structure is positive but statistically insignificant, indicating that the structure of a country’s financial system does not matter for ICT diffusion. Urban population is statistically insignificant. Telephone cost and total population are both negative and significant.
In Model 3, we examine the impact of financial development (activity) on the diffusion of mobile phones. Lag of mobile phones, FDI, trade openness, GDP per capita, and financial development are all positive and significant. For example, a percentage point increase in the activities of both banks and stock markets
Table 5
Financial development, financial structure, and ICT GMM estimation dependent variable: mobile phones per 1000
Model 1 Model 2 Model 3
Lag of mobile phones 0.9114 0.8385 0.8017
(50.07)*** (51.71)*** (45.01)***
Foreign direct investment 2.5185 2.4925 2.393
(6.21)*** (6.32)*** (5.98)***
Trade openness 0.9922 1.1764 1.0586
(3.98)*** (4.49)*** (3.86)***
Urban population 1.3521 1.0517 2.6696
(0.77) (0.59) (1.48)
Telephone cost 12.539 11.4296 14.5782
(2.52) (2.25) (2.66)***
GDP per capita 69.4778 66.1009 38.2647
(2.86)*** (2.93)*** (2.19)***
Electricity consumption 27.279 17.6968 8.77
(0.86) (0.40) (0.24)
Population 56.834 57.8213 58.3219
(6.14)*** (6.18)*** (5.93)***
Stock market development 0.315 (5.07)***
Credit market development 0.1153 0.79
Financial structure 3.2311 7.203
0.73 (1.85)
Financial development (size) 0.1855
(2.74)***
Financial development (activity) 0.2327
(3.47)***
Number of observations 539 526 514
Sargan test of over identifying restriction Chi2(65) = 343.80 Chi2(65) = 357.20 Chi2(65) = 325.42 [0.0000]*** [0.0000]*** [0.0000]***
Test of 1st order residual autocorrelation Z=3.74 Z=2.16 Z= 2.62 [0.0006]*** [0.030]*** [0.0001]***
Test of 2nd order residual autocorrelation Z= 0.68 Z=0.68 Z=1.12
[0.4984] [0.4964] [0.2624]
increases ICT diffusion by 0.23 percentage points. Financial structure this time is positive and statistically sig-nificant. Population and telephone cost are negative and sigsig-nificant. Per capita electricity consumption and urban population are both negative but statistically insignificant.
We next take up the results for Internet users (Table 6). Model 1 is our baseline. The empirical results indi-cate that the model seems to capture the process of diffusion because the coefficient of the lagged dependent variable is significant. The result also suggests that FDI, trade openness, GDP per capita, stock market devel-opment, and credit market development are all significant and positive. In particular, a percentage point increase in stock market development increases Internet usage by 0.20 percentage point. Similarly, a percent-age point increase in credit market development increases it by 0.17 percentpercent-age points. Population size is neg-ative and statistically significant. The negneg-ative relationship between population and ICT diffusion is difficult to
Table 6
Financial development, financial structure, and ICT GMM estimation dependent variable: Internet usage per 1000
Model 1 Model 2 Model 3
Lag of Internet 0.863 0.9021 0.8779
(33.98)*** (35.40)*** (33.47)***
Foreign direct investment 1.5311 1.5731 1.405477
(4.86)*** (5.15)*** (4.90)***
Trade openness 0.0709 0.016 0.0653
0.33 0.07 0.29
Urban population 437 0.5211 0.0185
(0.33) (0.35) (1.4805)
Telephone cost 0.6802 0.8328 0.1917
(0.15) (0.19) (0.04)
GDP per capita 71.9022 85.5124 49.2995
(1.74) (2.05) (1.96)***
Electricity consumption 22.829 41.268 0.0062
(0.84) (1.40) (1.35)
Population 19.12 12.0381 14.0367
(2.09) (1.88) (1.57)
Stock market development 0.2014 (4.12)***
Credit market development 0.1731 (2.32)
Financial structure 8.062 6.6588
(1.59) (1.81)
Financial development (size) 0.0681
(1.60)
Financial development (activity) 0.2446
(4.51)***
Number of observations 455 446 439
Sargan test of over identifying restriction Chi2(65) = 254.67 Chi2(65) = 228.58 Chi2(65) = 223.28 [0.0000]*** [0.0000]*** [0.0000]***
Test of 1storder residual autocorrelation Z=4.49 Z=4.98 Z=4.83 [0.0000]]*** [0.0000]*** [0.0000]***
Test of 2ndorder residual autocorrelation Z=
1.29 Z=1.35 Z=1.58
[0.1979] [0.1763] [0.1135]
interpret. Telephone cost, electricity consumption, and urban population are negative but statistically insignificant.7
In Model 2 we examine the impact of financial development and financial structure on ICT diffusion mea-sured by Internet usage. Lag of Internet, FDI, GDP per capita, and financial development (size) are all posi-tive and significant. A percentage point increase in financial development induces a 0.07 percentage increase in
Table 7
Financial development, financial structure, and ICT GMM estimation dependent variable: personal computer usage per 1000
Model 1 Model 2 Model 3
Lagged dependent 0.9639 0.9622 0.9436
(48.78)*** (52.02)*** (48.02)***
Foreign direct investment 0.1545 0.2305 0.2527
(1.76) (1.83) (1.74)
Trade openness 0.2037 0.1989 0.2342
(1.93) (1.82) (2.09)***
Urban population 2.0543 1.8905 1.8303
(2.89) 0.57 (2.53)***
Telephone cost 0.0434 0.1609 0.6132
(0.02) (0.07) (0.25)
GDP per capita 41.1795 46.7005 32.1268
(2.04) (2.25) (2.82)***
Electricity consumption 22.9268 35.5396 30.956
(1.55) 1.17 (1.09)
Population 77.5652 73.7498 86.811
(1.76) (1.69) (1.86)
Stock market development 0.1142 (4.34)***
Credit market development 0.0163 0.24
Financial structure 1.6507 0.3853
(1.46) 0.24
Financial development (size) 0.1072
(3.73)
Financial development (activity) 0.1249
(4.79) )***
Number of observations 507 500 488
Sargan test of over identifying restriction Chi2(65) = 253.61 Chi2(65) = 273.99 Chi2(65) = 268.97 [0.0000]*** [0.0000]*** [0.0000]***
Test of 1st order residual autocorrelation Z=7.66 Z=7.51 Z=7.21 [0.0000]]*** [0.0000]*** [0.0000]***
Test of 2nd order residual autocorrelation Z=0.75 Z=0.75 Z=0.98
[0.4506] [0.4528] [0.3269]
Notes: All variables are in first differences and all regressions include time dummies.Tvalues in parenthesis andpvalues in squared bracket. ***,**,and * implies significant at 1%, 5% and 10% significant levels respectively.
7
ICT diffusion. Financial structure is positive but statistically not significant, implying that the structure of a country’s financial system does not matter for ICT diffusion. Total population is negative and statistically sig-nificant. Electricity consumption, urban population, and telephone cost are all not sigsig-nificant.
In Model 3 the indicator of financial development (size) is replaced with an index of financial development (activity). In it lagged Internet, FDI, and financial development are all positive and statistically significant. In particular, a percentage point increase in the activities of financial intermediaries and banks induces a 0.25 percentage point increase in ICT diffusion. Financial structure is positive and statistically significant. Popula-tion size is negative and statistically significant. Urban populaPopula-tion, telephone cost, and electricity consumpPopula-tion are all negative but statistically insignificant.
We now turn to the results for PC penetration rates, which are reported inTable 7. The model appears to capture the process of diffusion, since the coefficient of the lagged dependent variable is significant. The results also suggest that FDI, trade openness, GDP per capita, and stock market development are positive and sta-tistically significant. In particular, a percentage point increase in stock market development increases PC pen-etration by 0.11 percentage points. Credit market development this time is statistically not significant even though it has the expected positive sign. Urban population is positive and statistically significant. Population size is negative and significant. Per capita electricity consumption and telephone cost are negative; neither is statistically significant.
One puzzling result has to do with electricity consumption: There is essentially no significant relationship between per capita electricity consumption and PC penetration. This is very surprising, because access to elec-tricity is essential for the use of PCs. One possibility is that there is a threshold effect in the elecelec-tricity–PC rela-tionship. Widespread availability of a reliable electricity supply is critical to making PCs economically efficient, and over the range where electrification is occurring, there may be a close link between electricity con-sumption and use. Once nearly all households have access to electricity, the link between electricity consump-tion and PC use may break down.
In Model 2 we examine the combined impact of stock market development and credit market development on PC penetration. The results show that the model captures the process of diffusion because the coefficient of the lagged dependent variable is significant. FDI, trade openness, GDP per capita, and financial development are positive and statistically significant. For example, a percentage point increase in financial development increases PC penetration by 0.11 percentage points. Financial structure is, however, statistically insignificant, indicating that it has no role in explaining the global PC divide. Urban population is positive and telephone cost is negative; neither is statistically significant. Population size is again negative and significant.
In Model 3 we examine the effect of the activities of the financial system on ICT diffusion. Financial devel-opment is measured using an index of the activities of banks and stock markets. Lagged PCs, FDI, trade open-ness, GDP per capita, and financial development are all positive and statistically significant. A percentage point increase in the activities of financial intermediaries and stock markets increases computer penetration by 0.12 percentage points. Financial structure is positive but statistically insignificant. Urban population is positive and significant. Electricity consumption and telephone cost are both negative; neither is statistically significant.
In sum, the empirical results provide support for the role of financial development in explaining cross-coun-try diffusion of ICT. Similarly, trade openness, FDI, and GDP per capita are all major determinants of ICT diffusion. This confirms that censorship and restrictions on trade constitute high barriers to the adoption and dissemination of ICT. Financial structure, however, has no significant role in explaining cross-country diffu-sion of ICT, though it is positive and significant in some specifications of the model.
5.1. Robustness – financial structure and ICT in advanced countries
advanced structure variable in the regression.8 A T-test on the coefficient of advanced structure is then conducted.
The result of this estimation is presented inTable 8. In the second column we have the results of the model with telephone mainlines per 1000 as the dependent variable. The result is that the coefficient of financial struc-ture in advanced countries is positive and statistically significant. This indicates that advanced countries in which the banking system is relatively more important than the stock market tend to use more ICT (measured by telephone mainlines). We also find a similar result using mobile phones as the dependent variable. In the third column we present the result of the estimation using Internet users as the dependent variable. This time
8
We include both the advanced dummy and advanced structure in the regression to be sure that any rejection of the null hypothesis would not be due to the fact that the advanced dummy is excluded.
Table 8
Financial structure and ICT in advanced countries GMM estimation
Dependent variable
Telephones Mobile phones Internet users PC users
Lagged dependent 0.872 0.8381 0.8774 0.928
(53.19)*** (48.23)*** (31.28)*** (42.88)***
FDI 2.735 2.4554 1.5618 0.2653
(6.82)*** (6.26)*** (5.15)*** (2.36)***
Trade openness 0.976 1.1918 0.0662 0.2558
(3.85)*** (4.57)*** 0.3 (0.018)***
Urban population 1.794 0.1302 0.1092 1.5529
(1.00) (0.07) 0.07 (2.13)***
Population 40.2478 54.1559 85.0927 4.4905
(4.03)*** (5.34)*** (1.89) (1.70)
Telephone cost 1.182 10.2267 0.839 0.1985
0.24 (2.01) 0.19 0.09
GDP per capita 132.103 65.6715 71.7852 55.1966
(2.59) (1.70) (1.73) (2.74)***
Electricity consumption 3.559 21.6754 27.4488 33.8408
(0.09) (0.60) (0.91) (2.10)
Financial structure 10.965 4.2394 1.75 3.4405
(2.16) (0.85) 0.23 (1.67)***
Financial development 0.387 0.1382 0.0506 0.0894
(5.33)*** (1.97) (1.76) (1.93)
Advanced dummy 0.079 0.1617 0.2369 2.1574
1.52 0.1 1.09 0.03
Advanced structure 32.219 22.6845 8.3707 1.2318
(3.87)*** (2.91)***
1.09 0.37
No. of Observations 527 526 446 500
Sargan test Chi2(65) = 388.33 Chi2(65) = 352.95 Chi2(65) = 226.87 Chi2(65) = 273.84 [0.00]*** [0.0000]*** [0.0000]*** [0.0000]***
1st order residual autocorrelation Z=6.28 Z=5.95 Z=4.74 Z=7.37
[0.000]*** [0.000) [0.000] [0.0000]***
2nd order residual autocorrelation Z=0.59 Z=1.00 1.27 Z=0.60
[0.533] [0.340] [0.2053] [0.5452]
Notes: All variables are in first differences except advanced dummy and advanced structure and all regressions include time dummies.T
advanced structure is not statistically significant even though it has a positive sign. Therefore, we fail to reject the null hypothesis that the coefficient of advanced structure in and outside of advanced countries is the same. In the last column, we present the result of the regression using PC users as the dependent variable. Here the coefficient of advanced structure is not statistically significant.
In sum, the evidence presented in this paper does not give any significant and robust role to financial struc-ture in explaining cross-country diffusion of ICT even in advanced countries.9
6. Concluding remarks
This paper has examined the role of financial development and financial structure in explaining cross-coun-try diffusion of ICT for a group of developing and advanced countries. There are four major findings:
1. Income influences ICT infrastructure as it relates to higher use of fixed and mobile phones, the Internet, and PCs.
2. Government trade policies have a positive impact on ICT – openness is associated with the adoption and adaptation of technology. This finding is generally consistent with the results of other studies.
3. Financial development is associated with more use of ICTs. In particular, development of stock markets and banks tends to foster ICT diffusion.
4. The structure of a country’s capital market does not seem to have any significant relationship with ICT diffusion.
9
We conducted a similar exercise for developing countries and found that they are no different; ICT diffusion there can be explained by the same global factors. In particular, credit and stock market development are important determinants of the diffusion of ICT in developing countries. These results are available from the author upon request.
Table A1
Countries in the sample
Developing countries Developing countries Developed countries
Argentina Korea, Rep. Australia
Bangladesh Lebanon Austria
Bolivia Lithuania Belgium
Brazil Malaysia Canada
Bulgaria Malta Denmark
Chile Mauritius Finland
China Mexico France
Colombia Morocco Germany
Coˆte d’Ivoire Nigeria Greece
Croatia Pakistan Iceland
Cyprus Peru Ireland
Czech Republic Philippines Italy
Dominican Republic Poland Japan
Ecuador Romania Luxembourg
Egypt, Arab Rep. Russian Federation Netherlands
Ghana Saudi Arabia New Zealand
Guatemala Singapore Norway
Hong Kong, China Slovak Republic Portugal
Hungary Slovenia Spain
India South Africa Sweden
Indonesia Sri Lanka Switzerland
Israel Thailand United Kingdom
Jamaica Tunisia United States
Jordan Turkey
Kenya Uruguay
Correlations
Fixed Mobile Internet PC GDP Population Electricity FDI Openness Structure Size Activity Urban Cost Capital Credit
Fixed 1.000
Mobile 0.808 1.000
Internet 0.765 0.899 1.000
PC 0.942 0.793 0.783 1.000
GDP 0.876 0.583 0.536 0.904 1.000
Population 0.365 0.277 0.264 0.315 0.281 1.000
Electricity 0.889 0.602 0.595 0.904 0.924 0.360 1.000
FDI 0.191 0.258 0.230 0.180 0.104 0.169 0.100 1.000
Openness 0.198 0.239 0.215 0.173 0.028 0.456 0.112 0.405 1.000
Structure 0.008 0.157 0.074 0.075 0.002 0.070 0.049 0.125 0.081 1.000
Size 0.475 0.410 0.372 0.540 0.538 0.048 0.048 0.182 0.268 0.412 1.000
Activity 0.461 0.428 0.400 0.532 0.513 0.151 0.457 0.108 0.118 0.277 0.883 1.000
Urban 0.663 0.425 0.400 0.676 0.714 0.236 0.654 0.166 0.025 0.031 0.294 0.215 1.000
Cost 0.387 0.264 0.213 0.443 0.515 0.116 0.406 0.067 0.009 0.038 0.214 0.145 0.332 1.000
Capital 0.310 0.358 0.303 0.384 0.322 0.049 0.304 0.222 0.274 0.711 0.880 0.750 0.187 0.117 1.000
Credit 0.473 0.381 0.354 0.532 0.566 0.088 0.508 0.060 0.093 0.103 0.840 0.882 0.234 0.177 0.586 1.00
Notes: Fixed is telephone mainlines per 1000; mobile is mobile phones per 1000; Internet is Internet users per 1000; PC is PC users per 1000; electricity is per capita electricity consumption; Structure is financial structure; size is financial development(size); Activity is financial development (activity); urban is urban population relative to total population; population is total population; FDI is foreign direct investment relative to GDP; openness is trade openness relative to GDP; cost is telephone access cost, capital is stock market capitalization relative to GDP; and credit is credit to the private sector relative to GDP.
Yartey
/Information
Economic
s
and
Policy
20
(2008)
208–227
We find that in a broad sample encompassing developed and developing countries, policy variables that have generated considerable attention, such as the cost of telecommunication access, do not show up as sta-tistically or economically important in explaining the fixed line, Internet, and PC divide. This should not be taken as implying that pricing policies are not relevant. Rather, it suggests that such issues are overshadowed by economic, demographic, and financial factors in samples with wide variations in Internet penetration rates. Indeed, pricing policies are found to be important in explaining mobile phone usage.
The result of the paper is related to the literature on finance and technological adoption. Our analysis show that finance development is associated with higher adoption of ICTs because well-developed financial markets makes it easier to finance ICT project. The analysis of the paper did not, however, find any conclusive evidence to support the assertion that intermediated finance may underfund innovative projects and those countries in which the financial system is tilted in favour of stock markets will probably lead to more innovation in ICTs than bank-based systems.
The conclusions highlight the role of financial development in the market for knowledge-based products and are consistent with the theoretical propositions ofSaint-Paul (1992). The finding that financial develop-ment is an important determinant of ICT diffusion implies that countries with underdeveloped financial mar-kets may sink even further to the information-poor side of the digital divide.
Acknowledgements
I thank Gianni De Nicolo, Luc Laeven, Eswar Prasad, Marco Terrones, and Kenichi Ueda for useful com-ments and suggestions. The usual disclaimer applies. The conclusions of this paper are my own and should not be attributed to the IMF or taken as IMF policy.
Appendix A
SeeTables A1 and A2.
References
Adriani, F., Becchetti, L., 2003. Does the digital divide matter? The role of information and communication technology in cross country level and growth estimates. CEIS Working Paper, No. 4 (Rome: Center for International Studies on Economic Growth).
Allen, F., Gale, D., 1999. Diversity of opinion and financing of new technologies. Journal of Financial Intermediation 8, 68–89. Allen, F., Gale, D., 2000. Comparing Financial Systems. MIT Press, Cambridge, MA.
Arellano, M., Bond, S., 1991. Some tests of specification for panel data: Monte Carlo evidence and an application to employment equations. Review of Economic Studies 58 (2), 277–297.
Bellock, R., Dimitrova, D.V., 2003. An exploratory model of inter-country internet diffusion. Telecommunication Policy 27, 237–252. Binswanger, M., 1999. Stock Markets, Speculative Bubbles and Economic Growth. Edward Elgar Publishing, Cheltenham.
Black, B., Gilson, R., 1998. Venture capital and the structure of capital markets: banks versus stock markets. Journal of Financial Economics 47 (8), 490–508.
Chinn, M.D., Fairlies, R.W., 2004. The determinants of the global digital divide: a cross-country analysis of computer and internet penetration. eScholarship Repository, No. 562, University of California, Santa Cruz.
Chow, G.C., 1983. Econometrics. McGraw Hill, New York.
Dasgupta, S., Lall, S., Wheeler, D., 2001. Policy reform, economic growth, and the digital divide: an econometric analysis. World Bank Working Paper, No. 2567. World Bank, Washington.
Demirguc-Kunt, A., Levine, R., 1999. Bank based and market based financial systems: cross country comparisons. World Bank Working Paper, No. 2143. World Bank, Washington.
Dewan, S., Ganley, D., Kraemer, K.L., 2004. Across the digital divide: a cross country analysis of the determinants of IT penetration. PCIC Working Paper. University of California, Irvine.
Forman, C., Goldfarb, A., Greenstein, S., 2002. Digital Dispersion: An Industrial and Geographic Census of Commercial Internet Use. National Bureau of Economic Research, Cambridge, MA.
George et al., 1991. Industrial Organisation: Competition, Growth and Structural Change, fourth ed. Routledge, New York. Gilson, R., 1996. Corporate governance and economic efficiency. Washington University Law Quarterly 74, 327–345.
Gilson, R., 1997. The legal infrastructure of high-technology industrial districts: silicon valley and covenants not to compete. Unpublished Working Paper, Stanford Law School, Stanford, CA.
International Telecommunications Union, 2005. International Telecommunication Indicators.<http://www.Itu.int/itu-d/ict/statistics>. Jorgenson, D.W., 2001. Information technology and the US economy. American Economic Review 91, 1–32.
Kiiki, S., Pohjola, M., 2002. Cross country diffusion of the internet. Information Economics and Policy 14, 297–310.
Maggi, K., 2000. Trade, foreign direct investment and international technology transfer: a survey. Working Papers – International Economics. World Bank, Washington.
Norris, P., 2000. The Global Divide: Information Poverty and Internet Access Worldwide. <www.ksg.harvard.edu/people/pnorris/ acrobat/IPSA2000.pdf>.
Pohjola, M., 2003. The adoption and diffusion of ICT across countries: patterns and determinants. In: Jones, D. (Ed.), New Economy Handbook. Academic Press, New York.
Quibria et al., 2003. Digital divide: determinants and policies with special reference to Asia. Journal of Asian Economics 13, 811–825. Robinson, J., 1952. The generalization of the general theory. In: Robinson, J. (Ed.), The Rate of Interest and Other Essays. Macmillan,
London.
Saint-Paul, G., 1992. Technological choice, financial markets and economic development. European Economic Review 36, 763–781. Singh, A., 1997. Financial liberalisation, stock markets and economic development. Economic Journal 107, 771–782.
Singh et al., 2005. Shareholder wealth maximization, stock market and new technology: should the US Corporate Model be the Universal Standard? Working Paper, No. 325. University of Cambridge, Center for Business Research.
Singh, A., Singh, A., Weisse, B., 2001. Information technology, venture capital and the stock market. A Background Paper for the International Labour Organization’s World Employment Report 2000–2001.
Steinmueller, W.E., 2001. ICTs and the possibilities of leapfrogging by developing countries. International Labour Review 140 (2), 193– 210.
Stulz, R.M., 2001. Does financial structure matter for economic growth? A corporate finance perspective. In: Demirguc-Kunt, A., Levine, R. (Eds.), Financial Structure and Economic Growth: A Cross Country Comparison of Banks, Markets and Development. MIT Press, Cambridge, MA.
Wallsten, S., 2003. Regulation and internet use in developing countries. AEI-Brookings Joint Center for Regulatory Studies Related Publication 03–8. AEI and Brookings Institution, Washington, DC.