Department of Experimental and Health Sciences
PhD Programme in Biomedicine 2012
DOCTORAL THESIS
GENETIC FACTORS ASSOCIATED WITH
CORONARY HEART DISEASE AND ANALYSIS OF
THEIR PREDICTIVE CAPACITY
Ph.D candidate:
Carla Lluís Ganella
ACKNOWLEDGMENTS
Durant tots aquests anys que comprenen no només la part del doctorat, sinó també molt abans, he acumulat una gran quantitat de persones que han representat pilars importants per la meva formació, no només acadèmica sinó majoritàriament com a persona. Algunes d’aquestes persones podran llegir aquesta tesi, altres no, però no per això mereixen un menor agraïment, ans el contrari.
Voldria començar per agrair als meus pares tot l’esforç que han fet durant els últims 30 anys per fer de mi qui sóc, i per no deixar que mai em faltés de res, renunciant a moltes de les coses que ells haguessin pogut tenir. Voldria agrair-li en especial a ma mare totes les hores i hores que ha dedicat a estar al meu costat, que m’ha fet molt més que de mare i d’amiga, i sense la que jo no estaria aquí.
Voldria també donar les gràcies al Gavin i al Roberto, per la infinita paciència que han tingut amb mi, i per tot el que m’han ensenyat. Durant els anys que he pogut compartir al seu costat, m’han encomanat la seva passió per la feina ben feta i dia a dia m’han deixat gaudir de la seva forma de ser i de tots els seus coneixements entre altres coses. Gavin, per moltes hores que ens quedéssim treballant, que sàpigues que mai se m’ha fet llarga una sola tarda. Thanks Gavin, gracias Roberto.
A tota la resta de membres que han fet possibles els projectes que hem realitzat, des dels participants en l’estudi REGICOR, fins a les persones que han recollit les dades i mostres, i també als que han dissenyat i dut a terme l’estudi, ja en marxa des d’abans que naixés. En especial, i per proximitat durant tot aquest temps, voldria agrair a tot l’equip d’estadística i maneig de dades de la unitat pel gran treball que realitzen, atenent sempre les demandes de tots els que els necessitem. En especial a l’Isaac i al Joan, per totes les hores que m’han dedicat i per tota la paciència que han tingut. Han estat tots dos uns grans mestres.
També vull deixar un record especial per les meves amigues que m’han acompanyat des que era petita (Eva, Laia, Nuria), i entre les quals encara conservo les meves millors amistats. Amb elles he compartit els millors i els pitjors moments de la meva vida, i res hauria estat possible sense elles. I com la vida sempre ens va deixant bones coses pel camí, no em voldria oblidar de les amistats que he fet al llarg d’aquests anys (Esther, Marta, Irene, Gerard), i que no han estat menys importants. Ah!, i amb tots els que he compartit els últims 4 anys (Mariana, Marc, Mari, Vaquero, Gianni, Giulia, Simone, Tobias, Edu)! Han estat realment uns anys fantàstics!!
PUBLICATIONS AND PRESENTATIONS
PUBLICATIONS ARISING FROM WORK CARRIED
OUT IN THIS THESIS
Lluís-Ganella C, Subirana I, Lucas G, Tomás M, Muñoz M, Sentí M, Salas E, Sala J, Ramos R, Ordovas JM, Marrugat J, Elosua R. Assessment of the value of a genetic risk score in improving the estimation of coronary risk. Atherosclerosis 2012; Article in press.
Lucas G, Lluís-Ganella C, Subirana I, Sentí M, Willenborg C, Musameh MD, Schwartz SM, O’Donnell CJ, Melander O, Salomaa V, Elosua R. Post-Genomic Update on a Classical
Candidate Gene for Coronary Artery Disease: ESR1. Circ Cardiovasc Genet. 2011; 4(6):
647-654.
Lluís-Ganella C, Lucas G, Subirana I, Sentí M, Jimenez-Conde J, Marrugat J, Tomás M, Elosua R. Additive effects of multiple genetic variants on risk of ischemic cardiopathy. Rev Esp Cardiol. 2010; 63(8):925-33.
Lluís-Ganella C, Lucas G, Subirana I, Escurriol V, Tomás M, Sentí M, Sala J, Marrugat J, Elosua R. Qualitative assessment of previous evidence and an updated meta-analysis
confirms lack of association between the ESR1 rs2234693 (PvuII) variant and coronary
heart disease in men and women. Atherosclerosis 2009; 207(2): 480-486.
ORAL PRESENTATIONS AND AWARDS
Lluís-Ganella C, Subirana I, Lucas G, Tomás M, Muñoz M, Sentí M, Salas E, Sala J, Ramos R, Ordovas JM, Marrugat J, Elosua R. Assessment of the value of a genetic risk score in improving the estimation of coronary risk. Atherosclerosis 2012; Article in press. Presented at the Congress of the Spanish Society of Cardiology 2011, Maspalomas, Las Palmas de Gran Canaria, 2011.
Lluís-Ganella C, Lucas G, Subirana I, Escurriol V, Tomás M, Sentí M, Sala J, Marrugat J, Elosua R. Qualitative assessment of previous evidence and an updated meta-analysis confirms lack of association between the ESR1 rs2234693 (PvuII) variant and coronary heart disease in men and women. Atherosclerosis 2009; 207(2): 480-486. Presented at the Congress of the Heracles Network: in the category of: “Best Publication from HERACLES 2009 from a Young Investigator”, Granada 2010. Received the first prize.
Lluís-Ganella C, Lucas G, Subirana I, Sentí M, Jimenez-Conde J, Marrugat J, Tomás M, Elosua R. Additive effects of multiple genetic variants on risk of ischemic cardiopathy. Rev Esp Cardiol. 2010; 63(8):925-33. Presented at the Congress of the Heracles Network, Granada 2010.
ABBREVIATIONS
AHA: American Heart Association
BMI: Body Mass Index
CAD: Coronary Artery Disease
CARDIoGRAM: Coronary ARtery DIsease Genome-Wide Replicationa And Meta-analysis
CHD: Coronary Heart Disease
Chr: Chromosome
CI: Confidence Interval
CVD: CardioVascular Disease
CVRF: CardioVascular Risk Factor
DNA: DeoxiriboNucleic Acid
ESR1: Estrogen Receptor Alpha gene
GRS: Genetic Risk Score
GWAS: Genome Wide Association Study
HDL: High Density Lipoprotein
HGP: Human Genome Project
HR: Hazard Ratio
HRT: Hormone Replacement Therapy
HWE: Hardy-Weinberg Equilibrium
IDI: Integrated Discrimination Improvement
IHD: Ischaemic Heart Disease
LD: Linkage Disequilibrium
LDL: Low Density Lipoprotein
MeSH: Medical Subject Heading
MI: Myocardial Infarction
MIGen: Myocardial Infarction Genetics consortium
NHGRI: National Human Genome Research Institute
NRI: Net Reclassification index
OR: Odds Ratio
QS: Quality Score
REGICOR: REgistre GIroni del COR
ROC: Receiver Operating Characteristic
RNA: RiboNucleic Acid
RR: Relative Risk
SD: Standard Deviation
SNP: Single Nucleotide Polymorphism
STREGA: STrengthening the REporting of Genetic Associations
WHI: Woman Health Initiative
WHO: World Health Organization
WTCCC: Wellcome Trust Case-Control Consortium
GENERAL SUMMARY
The main expansion of the discovery of genetic variants associated with complex diseases has occurred during the last decade. This expansion has been accompanied, and in some sense motivated, by the desire to use this information to improve the predictive capacity of many diseases with an unidentified familial component, including coronary heart disease (CHD), with the aim of translating this genetic knowledge into clinical practice. This doctoral thesis is structured in two lines of investigation that address distinct aspects of this issue, first to evaluate the possible role of genetic variation in a candidate gene in modulating CHD risk, and second to evaluate whether genetic information can be used to improve risk assessment tools used in clinical practice.
In the first research line (described in Part I), I investigate the contribution of genetic variation in one of the most widely-studied genes in cardiovascular genetics, ESR1, which encodes the Oestrogen receptor α protein. I provide a solid meta-analysis of evidence regarding the most widely-studied variant in this gene and we further explore the role of a broad range of common and uncommon variants in this gene in CHD risk. Using these approaches, we find no evidence of association between the genetic variants studied and CHD risk. However, although we can confidently accept that common genetic polymorphisms are not associated with CHD, we cannot discard the possibility that other types of variation in this gene (for instance epigenetic variation) could modify susceptibility to CHD, or that other elements of this pathway are associated with an increased risk of CHD. In this research I have provided a reliable answer to this long running unanswered question in cardiovascular genetics, allowing research to re-focus on other elements of this system or other pathways.
In the second line (described in Part II), I explored the possible utility of genetic information obtained from genome-wide association studies (GWAS) in prediction of 10-year risk of CHD events by adding this information to cardiovascular risk functions. I have followed the recommendations proposed by the American Heart Association for evaluating the utility of novel biomarkers in clinical practice, and have demonstrated that although the magnitudes of the effects of these genetic variants on CHD risk are modest, there is a tendency towards improvement in the capacity of the risk functions to predict future CHD events. The translation of genetic information into clinical practice was one of the main motivations for the investment in genome-wide association studies, and my research represents one of the first efforts to explore this possibility.
RESUM GENERAL
L’expansió principal pel que fa al descobriment de variants genètiques associades amb malalties complexes s’ha dut a terme durant la última dècada. Aquesta expansió ha estat acompanyada, i d’alguna forma motivada, pel desig d’usar aquesta informació per millorar la capacitat de predicció d’aquelles malalties on hi és present un cert component familiar però en les que no es coneixien les variants que conferien un major risc de patir la malaltia, entre elles la cardiopatia isquèmica (CI). La present tesis doctoral està estructurada en dues línies d’investigació que avaluen el possible rol d’un gen candidat en la susceptibilitat de la CI i també avalua la millora en la capacitat de predicció d’un esdeveniment coronari de les eines usades habitualment en la pràctica clínica mitjançant la inclusió d’informació genètica.
Més concretament, la primera línea d’investigació es centra en la contribució de la variació genètica en un dels gens més estudiats en relació amb CI: el gen que codifica pel receptor d’estrogens α (ESR1). En aquesta línea he proveït un sòlid meta-anàlisis entre la variant més àmpliament estudiada d’aquest gen i risc coronari i també hem explorat el paper de la majoria de les variants comunes descrites en aquest gen i risc de CI. Mitjançant cap dels anàlisis he trobat evidència d’associació entre les variants genètiques en aquest gen i el risc de CI. No obstant això, i encara que podem acceptar que les variants genètiques comunes d’aquest gen no estan associades amb esdeveniments coronaris, no podem descartar que altres tipus de variació en aquest gen (com per exemple variació epigenètica) pugui estar modificant la susceptibilitat a patir un esdeveniment coronari, ni tampoc que altres elements de la mateixa cadena de senyalització estiguin associats amb la malaltia. En aquesta recerca he donat resposta a una qüestió que havia estat plantejada des de feia molts anys en el camp de la genètica de malalties cardiovasculars, permetent als investigadors de centrar tots els seus esforços en investigar altres elements d’aquest sistema o altres rutes metabòliques.
En la segona línea d’investigació, hem explorat el possible paper de les variants genètiques, obtingudes mitjançant estudis d’associació global del genoma (GWAS), en la millora de la capacitat de predicció a 10 anys dels esdeveniments coronaris, mitjançant la seva addició en les funcions de risc cardiovascular clàssiques. Hem seguit les recomanacions proposades per la American Heart Association per l’avaluació en la pràctica clínica de nous biomarcadors, i hem demostrat que, tot i que la magnitud de l’associació d’aquestes variants és modesta, hi ha una tendència cap a la millora de la capacitat de predicció de les funcions de risc. La translació de la informació genètica en la pràctica clínica fou una de les principals motivacions dels estudis d’associació global del genoma, i la meva recerca representa un dels primers intents de posar en pràctica aquesta translació.
TABLE OF CONTENTS
0. Preface
, p. 191. Introduction
, p. 211.1. General introduction, p. 23
1.1.1. Epidemiological studies, p. 23 1.1.2. Brief introduction to genetics, p. 29 1.1.3. Translation from genetics to clinics, p. 37
1.1.4. Coronary heart disease: an example of complex disease, p. 42 1.1.5. Current state of the field of complex disease genetics, p. 46 1.1.6. Revision Article: Rev Esp Cardiol Supl. 2009; 9:24B-38B, p. 49 1.1.7. Update on cardiovascular genetics, p. 65
1.2. Global hypotheses, p. 67 1.3. Global objectives, p. 67
2. Part I: evaluation of the role of genetic variation in
ESR1
on
risk of CHD
, p. 69 2.0. Abstract, p. 70 2.1. Introduction, p. 802.1.1. Gender differences in CHD risk, p. 70 2.1.2. Oestrogen phisiology, p. 76
2.1.3. Previous research into the ESR1 gene and other oestrogen receptors, p. 78
2.2. Hypotheses, p. 81 2.3. Objectives, p. 81
2.4. Article 1: Atherosclerosis 2009; 207(2): 480-486., p. 83
2.5. Article 2: Circulation: Cardiovascular Genetics 2011; 4(6): 647-654., p. 91 2.6. Discusion, p. 101
3. Part II: improvement of risk assessment using genetic
information
, p. 1073.0. Abstract, p. 108 3.1. Introduction, p. 108
3.1.1. Cardiovascular risk factors, epidemiology and risk functions, p. 108 3.1.2. Improving the precision of risk functions by adding new risk
markers, p. 114
3.1.3. Genetic variants as novel biomarker of cardiovascular risk, p. 120 3.2. Hypotheses, p. 123
3.3. Objectives, p. 123
3.4. Article 3: Rev Esp Cardiol. 2010; 63(8):925-33., p. 125 3.5. Article 4: Atherosclerosis 2012. Article in press, p. 135 3.6. Discussion, p. 145
4. General remarks and conclusions
, p. 1515. Bibliography
, p. 1536. Glossary
, p. 1677. Appendices
, p. 171PREFACE
0
0. PREFACE
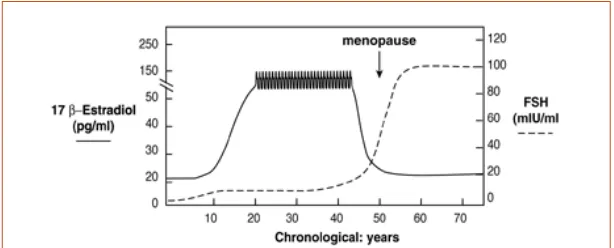
The difference in incidence of cardiovascular diseases between males and females is one of the most striking observations in the epidemiology of ischaemic heart disease but still remains largely unexplained. Not even the observed differences between genders in terms of cardiovascular risk factors, lifestyle, environmental exposures, or any other known differences are able to explain this. Historically, the fact that this difference disappears almost completely after menopause has driven researchers to focus on physiological or social characteristics that also change during this period, such as the reproductive hormone system.
Previous studies have extensively evaluated but not conclusively determined the role of genetic variation in one of the most attractive candidate genes for cardiovascular risk, ESR1 (encoding the Oestrogen Receptor α protein). In this context, my aim was to perform a detailed exploration of the genetic variation in this gene in order to provide a more definitive answer to this question. The results of these studies are presented in the first research line of this doctoral thesis.
An important priority in modern medical research is that the knowledge obtained be rapidly and efficiently applied in clinical practice. Thus, one of the main motivations of my research is to explore how genetic information can be used to improve cardiovascular medicine.
During the last decade there has been an impressive expansion in our understanding of the genetic basis of complex diseases. My research represents one of the first attempts to begin the process of translating this new information into clinical practice, the results of which are presented in the second research line of this doctoral thesis.
INTRODUCTION
1. INTRODUCTION: Table of contents
1.1. General introduction
1.1.1. Epidemiological studies
- Definition of epidemiology and uses - Box 1
- Experimental studies: introduction, definition and uses - Non-experimental studies: Cohort studies
- Non-experimental studies: Case-control studies - Deciding when to use cohort and case control study
designs
- Genetic epidemiology: Genetic factors as a potential risk factor
1.1.2. Brief introduction to genetics
- Origins of the concept of genetics and Mendel’s laws - Discovery of Mendelian inheritance patterns in human disease - Exceptions to Mendel’s Law of Independent Assortment - DNA as a carrier of genetic information
- Cracking of the genome: the development of genotyping techniques
- Describing the human genome: The Human Genome Project & The HapMap Project
- From genetic variation to the discovery of the genetic basis of the disease
- Present and future of genotyping techniques - Ways to use this information
- Box 2
1.1.3. Translation from genetics to clinics
- Why and when is it necessary to translate genetics to clinical practice?
- Step 1: Determine whether the disease being studied has a genetic component
- Step 2: Establish the genetic architecture of the disease - Step 3: Determine the impact of the genetic variability
on disease risk
- Step 4: Evaluate the utility of the genetic information in diagnosis, prediction, prevention and treatment of the disease
- Box 3
1.1.4. Coronary heart disease: an example of complex disease - Definition and stages of atherosclerosis
- Definition and manifestations of coronary heart disease - Global burden of disease
- Factors that increase risk of coronary heart disease 1.1.5. Current state of the field of complex disease genetics
- Problems in genetic studies: Lack of robust findings - Problems in genetic studies: Correct selection of genes/
loci
- How much information have we gained using GWAS. Is it enough?
- Characteristics of the variants obtained with GWAS - Is there more?
1.1.6. Revision Article: Rev Esp Cardiol Supl. 2009; 9:24B-38b 1.1.7. Update on cardiovascular genetics
1.2. Global hypotheses 1.3. Global objectives
Epidemiological Studies
1.1. GENERAL INTRODUCTION
1.1.1. Epidemiological studies
Definition of epidemiology and uses
The main focus of epidemiology is the study of the distribution and determinants of disease frequency in populations and the application of this study to control health problems [Aschengrau, 2008]. Factors that are associated with an increased probability of a specific disease are known as risk factors, and can be studied using several types of study designs.
There are two main groups of designs: interventional
or experimental studies* (clinical trials) and observational
studies (such as cohort or case-control studies) (see Box 1).
Although interventional studies are the preferred design because they provide the most powerful evidence, the use of observational studies can help to avoid some of the economic and ethical limitations that clinical trials or interventional studies might have, in the case of both human subjects as well as other living organisms.
The different types of study designs can be classified in a hierarchy (see Box 1), according to the power of evidence provided by each design. The World Health Organization (WHO) has established a working group to develop a common, sensible and transparent approach to grading the quality of evidence. This grading is based on four domains: study design, study quality, consistency (measuring the internal validity of a study), and directness (external validity of a study, refers to the extent to which the people, interventions, and outcome measures are similar to those of interest. E.g. there may be uncertainty about the directness of the evidence if the people of interest are older or sicker than those in the studies) [Atkins, 2004].
Advantages and disadvantages of the use of case-control or cohort studies.
To evaluate the influence of an exposure in the incidence of a disease given a certain population, and depending on the study design, some measurements can be obtained, such as relative risk or the odds ratio:
Cohort Studies Case-Control Studies
Useful for common disorders with short
latency periods Useful for rare diseases or common diseases with long latency periods Need to be relatively large for the study of rare
diseases Relatively smaller for any frequency of disease. Can be even smaller for rare diseases Allow study of multiple disease outcomes and
multiple exposures Usually focused on one disease, but allow study of multiple exposures Considers the effect of time Limited ability to identify temporal patterns
Relative risk(RR) is a ratio of the probability of the event occurring in the exposed group versus a non-exposed group [Sistrom, 2004]. RR is often used when the binary outcome that is being measured has a relatively low
probability. It is thus often suited to clinical trials or cohort studies.
Odds ratio (OR) is the ratio of the odds of an event occurring in one group to the odds of it occurring in another group [Sistrom, 2004].
Box 1. A hierarchical representation of the different types of study designs, according to the power of the evidence they provide.
Meta-Analysis
Systematic Review
Randomised Controlled Trial
Cohort Studies
Case-Control Studies
Case Series / Case Reports
These two measures can be computed as follows:
Cases Controls
d c c b a a RR + + = c b d a OR ⋅ ⋅ =
Exposed a b a + b
Non-exposed c d c + d
a + c b + d
In both measures, a value of 1 means absence of effect of the factor evaluated, a value <1 means a protective effect, and a value >1 means a harmful effect.
These two measures can be considered almost equivalent, except when the incidence of a disease is very high, and there is a big difference in the incidences of the disease in those individuals exposed and non-exposed to the factor.
Example. Three different scenarios are presented below. In each scenario, the
incidence of the disease varies among the exposed and unexposed groups, but the total of individuals (10,000), and the prevalence of smokers (40% of smokers) is constant in all situations.
- Scenario 1: low disease incidence:
- disease incidence among smokers: 4%
- disease incidence among non smokers: 0.4%
- Scenario 2:high disease incidence:
- disease incidence among smokers: 40%
- disease incidence among non smokers: 4%
- Scenario 3:high disease incidence in both exposed and non-exposed:
- disease incidence among smokers: 40%
- disease incidence among non smokers: 35%
Scenario 1 Scenario 2 Scenario 3
cancer no cancer cancer no cancer cancer no cancer Smokers 160 3,840 4,000 1,600 2,400 4,000 1,600 2,400 4,000
Non-smokers 24 5,976 6,000 240 5,760 6,000 2,100 3,900 6,000 184 9,816 10,000 1,840 8,160 10,000 3,700 6,300 10,000
RR→ 10.0 000 , 6 24 000 , 4 160
= 10.0
000 , 6 240 000 , 4 600 , 1
= 1.1
000 , 6 100 , 2 000 , 4 600 , 1 =
OR→ 10.4 840 , 3 24 976 , 5 160 = ⋅
⋅ 16.0
400 , 2 240 760 , 5 600 , 1 = ⋅
⋅ 1.2
400 , 2 100 , 2 900 , 3 600 , 1 = ⋅ ⋅
Note that the values obtained in the RR and the OR are more similar when the incidence of the disease is low, but also when the difference in the disease incidence in the exposed group and the non-exposed group is small.
Experimental studies: introduction, definition and uses
In biology, when we want to evaluate the “effect” that a certain characteristic or factor has on another condition (for example, a disease), the ideal type of study design is generally an interventional study, in which the investigator designs an experiment to evaluate the changes in disease status of a group exposed to the factor when compared to an unexposed group. The exposure to the factor of interest is usually introduced by the investigator in a random way: some individuals are randomly exposed to the factor and the others are not exposed (randomised clinical trial). The aim of randomisation is to ensure that the two groups are equal in all ways except with regard to their exposure to the factor of interest. If this is true and the disease or condition is more frequent in one of the two groups, we can conclude that the factor is causally associated with the condition. As an example, to evaluate the effects of a pesticide, we plant 200 roses at the same time, and monitor all the conditions. During a two month period, we treat half of the flowers with pesticide and leave the rest untreated. If the untreated roses flower normally, and the treated roses fail to develop flowers, we could conclude that the pesticide prevents flower development in roses. If we try to perform the same type of experiment in other species, for instance humans, we may encounter ethical problems. For example, we could not expose individuals to chemicals with unknown effects in order to identify their side effects. Therefore, other types of study designs are often required for the evaluation of specific relations with certain exposures.
Non-experimental studies: Cohort studies
While there are several types of non-experimental or observational study design [Rothman, 2008] (e.g. cohort studies, proportional mortality studies, control, case-cohort, etc.), cohort studies give the closest approximation to the true influence of a risk factor in the populations under study. A cohort study is an analytical study in which a representative sample of individuals from a population is selected, each individual’s level of natural exposure to the factor of interest is measured, and the rate of occurrence of the outcome of interest (outcome incidence) during a specific time period (follow-up) is recorded [Rothman,
Epidemiological Studies
2008]. A requirement of this type of study is that all subjects must be free of disease at the time of enrolment, because in these longitudinal studies we compare the incidence of the disease of interest in those who are exposed and non-exposed to the factor under study (time to event). A classical example of this type of study is the Framingham Heart Study, which started in 1948 with the follow-up of 5,209 residents of Framingham (Massachusetts, USA). This study has identified most of the currently known risk factors for cardiovascular disease (www.framinghamheartstudy.org).
Non-experimental studies: Case-control studies
Due to the elevated cost and the long period of time required to perform cohort studies, another type of study design that has also been widely used is the case-control design. In this type of study, a group of individuals who have a specific disease (cases) are compared with a group of individuals who are free from that disease (controls) [Rothman, 2008] (see Box 1). A classical example of an application of this type of study design is the demonstration by John Snow that persons who drank well water from the Broad Street Pump in London in 1849 had a much higher death rate from cholera than those who did not. The author also showed that the rate of death from cholera was much higher among those who had drunk water that had been polluted by sewage (www.sph.umich.edu/epid/GSS/pub.html).
Deciding when to use cohort and case-control study designs
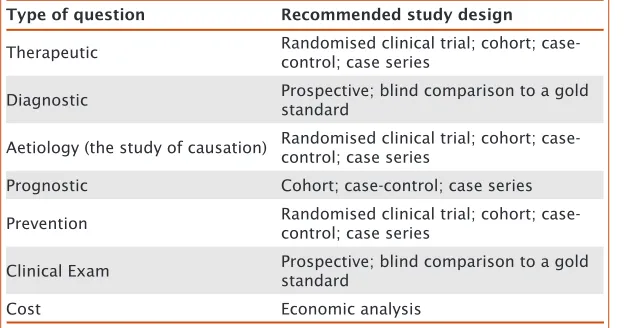
and affords the efficiency gain from a case-control design over a cohort design [Rothman, 2008], especially for those diseases with low incidence, in which very large numbers of individuals would need to be collected in order to have the same number of events with a cohort study compared to a case-control study. However, as researchers’ general understanding of the principles and limitations of case-control studies has evolved, their design and acceptance has also improved. Currently, case-control studies are commonly used to study factors associated with disease because cohort studies are very expensive and usually require long-term follow-up. A case-control study can be conceptualised as a more efficient version of a cohort study, while this advantage could be hampered by the potential for greater biases. Therefore, the choice of study design will depend on the type of question to be addressed (see Table 1), and on the resources available.
Type of question Recommended study design
Therapeutic Randomised clinical trial; cohort; case-control; case series
Diagnostic Prospective; blind comparison to a gold standard
Aetiology (the study of causation) Randomised clinical trial; cohort; case-control; case series
Prognostic Cohort; case-control; case series
Prevention Randomised clinical trial; cohort;
case-control; case series
Clinical Exam Prospective; blind comparison to a gold standard
Cost Economic analysis
Genetic epidemiology: Genetic factors as potential risk factors
[image:28.499.37.349.307.471.2]Many different types of factors can be evaluated as potential contributors to disease incidence, including environmental elements (pollution, water contaminants, etc.), sociodemographic characteristics (age, socioeconomic position, etc.), and physical or phenotypic characteristics (body weight, blood pressure levels, etc.). Classically, because of their big contribution on disease, the most widely studied factors have been both environmental and physical characteristics. However, there is a clear pattern
Table 1. Types of
study designs that can be used to address specific questions.
INTRODUCTION: General Introduction
Epidemiological Studies
of inheritance in some diseases since the incidence among siblings of patients with a disease have increased risk with respect to the general population. Therefore, we could also define genetics as a possible risk factor. In this sense, genetic epidemiology deals with the aetiology, distribution, transmission and management of disease among relative individuals, and with heritable factors that contribute to disease risk in populations [Morton, 1982].
As a result of classical epidemiological studies, in which various clinical forms of heart disease were found to occur more frequently in individuals with a family history of the disease (familial aggregation) [Thomas, 1955; White, 1957; Mayer, 2007], it has been known for several decades that cardiovascular diseases (CVD) have an important hereditary component; this has also been observed for many other diseases (e.g. cancer). More recent studies indicate that a family history of ischaemic heart disease in parents [Lloyd-Jones, 2004] or siblings [Marenberg, 1994; Murabito, 2005] is a risk factor for development of the disease, independent of traditional risk factors. This familial aggregation highlights the genetic component of cardiovascular disease risk, although this could also be related to environmental and behavioural factors, which are common and also display familial aggregation [Deutscher, 1966].
1.1.2. Brief introduction to genetics
Origins of the concept of genetics and Mendel’s laws
Beginning with the observations of Darwin and Wallace in the 19th century, the process of natural selection began
of the phenotypic characteristics studied in the pea plant. Mendel’s observations were of extreme importance in determining the pattern of inheritance observed in some diseases, and in understanding the way in which genetic information is transmitted between generations.
Discovery of Mendelian inheritance patterns in human disease
In 1902, Garrod observed that the disease alkaptonuria
followed the same patterns of inheritance that Mendel had described in the pea plant [Garrod, 1902; Dronamraju, 1992]. This meant that the inheritance pattern observed in some plants was not exclusive to that kingdom, and could be extrapolated to some human diseases, and these would later be denoted as Mendelian diseases (discussed in Griffiths et al. [2000]). To date, the genetic basis of more than 2.000 Mendelian diseases have been established, including familial hypercholesterolemia [Civeira, 2004], familial defective apolipoprotein B-100 [Innerarity, 1987] and Brugada Syndrome [Lehnart, 2007]. However, from the point of view of public health, these diseases generally affect few individuals and do not have a very significant impact on the health of the general population.
Exceptions to Mendel’s Law of Independent Assortment
In 1905 Bateson coined the word “genetics” for the study of heredity, and also demonstrated the general validity and importance of Mendelian inheritance (as reported by Harper et al. [2005] and Barahona et al. [2009]). In the same year, he observed, together with Saunders and Punnett, one of the earliest exceptions to normal Mendelian ratios. In their work with pea plants, these researchers noticed that not all of their crosses yielded results that reflected the principle of independent assortment. Specifically, some phenotypes appeared far more frequently than Mendelian genetics would predict [Bateson, 1909]. Based on these findings, the researchers proposed that certain alleles must somehow be coupled or linked to each another, although they weren’t sure how this linkage occurred. The answer to this question came in 1911, when Morgan demonstrated that linked genes must be real physical objects that are located in
Brief introduction to genetics
close proximity on the same chromosome [Morgan, 1911; Lobo, 2008]. Based on the observation that some traits are inherited together, Morgan and colleagues also defined the first genetic map of an organism (Drosophila melanogaster), and deduced that these traits must be located in a linear arrangement on the chromosomes.
Moreover, Morgan and his team discovered that some characteristics in the fruit fly were determined by the combined action of two or more genes, which is reminiscent of the type of inheritance observed in complex diseases as reported by Barahona et al. [2009]. In contrast to Mendelian diseases, complex diseases, which account for the majority of morbidity and mortality in industrialised countries, are caused by a combination of genetic as well as environmental and behavioural factors, and are the diseases with the greatest impact on general population health. The complex combination of various risk factors makes the identification of the genetic component of complex diseases more difficult than for Mendelian diseases.
DNA as a carrier of genetic information
In 1944, deoxyribonucleic acid (DNA) was identified by Avery and colleagues as the carrier of the genetic information [Avery, 1944], although some doubts remained about the assertion that genetic information was contained in DNA. At that time, the appearance of genetic effects was thought to be under the direct control of proteins. Therefore, the identification and characterisation of the DNA molecule was a crucial objective, not only in order to understand this molecule, but also to determine how and where the genetic information was stored. The idea of one gene-one enzyme
double-helix model of DNA structure and described a novel feature of this structure, which is the manner in which the two chains are held together [Watson, 1953]. This model focused attention, in particular, on the biological meaning of its physical structure [Khorana, 1968], but one of the most valuable characteristics of this discovery was the fact that DNA is composed of two mirror strands or chains; while genes are encoded on just one strand, the sequence of either strand can be established by determine the sequence of the other one. This is called complementary base pairing.
Cracking the Genome: the development of genotyping techniques
Regardless of the structural characteristics of DNA, the so-called “Cracking of the Genome” could not begin until the discoveries of Ochoa and Kornberg in the 1950s, who identified the enzyme PNPase (Polynucleotide Phosphorylase), and its ability to synthesize RNA in vitro. In his Nobel lecture, Ochoa commented that, “Since there are good indications that the genetic information stored in DNA is first transmitted to RNA, it is believed that DNA may function as a template for RNA replication” [Ochoa, 1959]. However, the enzymology of DNA began to develop rapidly with the work of Kornberg and co-workers [Nobelprize.org, 2006], who detailed molecular images of RNA polymerase (the molecule responsible for DNA translation) during various stages of the transcription process. The discovery of this enzyme clarified the manner in which information in DNA is transcribed into RNA, now known as messenger RNA (mRNA), and made possible the development of techniques that are still used for identification of genetic polymorphisms (for example the invention of the polymerase chain reaction (PCR) technique by Mullis in 1986 [Mullis, 1986]). For more than two decades, PCR (and its adaptations) has been the most widely used technique in research into the genetic
architecture of disease.
Describing the human genome: The Human Genome Project & The HapMap Project
The early 1990s saw the start of the Human Genome Project
(HGP; 1990-2003), whose main aim was to map and sequence
Brief introduction to genetics
the human genome [Watson, 1989; Pearson, 1991; Roberts, 2001; Venter, 2001] (genomics.energy.gov). In 2003, the goals of the HGP were achieved with the completion of the first human genome sequence (see Box 2).
That same year also saw the initiation of another project that has had a crucial role in the field of genetics,
The International HapMap Project (HapMap; 2002-2009).
HapMap was a multi-country effort designed to identify and catalogue human genetic variation [The International HapMap Consortium, 2003], and played an important role in providing better estimates of allele frequencies [Fellay, 2007], identifying additional variants for testing, and defining patterns of correlation between them (linkage
disequilibrium, LD) [Manolio, 2008]. LD patterns across
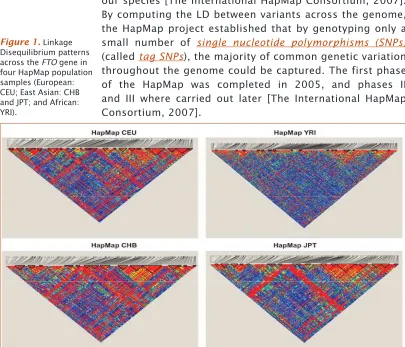
[image:33.499.57.462.313.660.2]the genome were found to have a block structure (see
Figure 1), which is the result of the molecular mechanism
of chromosomal recombination throughout the history of our species [The International HapMap Consortium, 2007]. By computing the LD between variants across the genome, the HapMap project established that by genotyping only a small number of single nucleotide polymorphisms (SNPs)
(called tag SNPs), the majority of common genetic variation throughout the genome could be captured. The first phase of the HapMap was completed in 2005, and phases II and III where carried out later [The International HapMap Consortium, 2007].
Figure 1. Linkage
From genetic variation to the discovery of the genetic basis of disease
Once the LD patterns across the genome had been clarified, researchers were able to use this information to locate genes involved in clinically important traits. Moreover, thanks to this researchers can now perform a more detailed exploration of specific association with disease of candidate genes, or even search on genome-wide scale for chromosomal regions that may be associated with a disease. These resources have driven disease gene discovery during the first generation of genome-wide association studies
(GWAS), in which having data for hundreds of thousands
of variants allow to test for association with disease for the vast majority of common variants in the genome (in this context, variants with a minor allele frequency of ≥5% are generally referred to as common) [The International HapMap Consortium, 2007].
Present and future of genotyping techniques
In recent decades, great improvements in the methodologies used to study the influence of genetic variation on diseases have been achieved through the use of information from collaborative projects such as the HGP and HapMap projects in combination with the advanced statistical methods that take advantage of the correlation between common variants in order to impute genotypes at additional variants not directly tested [Hirschhorn, 2011]. These technological developments and developments in high-throughput genotyping technologies have driven an order-of-magnitude expansion of genetic studies on a wide range of diseases in recent years [Visscher, 2009], from studying one or few genetic variants at a time to hundreds of thousands in a single experiment (GWAS) [Manolio, 2008], and more recently using complete sequences of the exome or the entire genome [Singleton, 2011]. Moreover, the rapid drop in cost and increase in scale of DNA sequencing has often been compared to the trend seen in the semiconductor industry in the second half of the twentieth century, which was described by Moore’s law (which described that the number of transistors that can be placed inexpensively on an integrated circuit doubles approximately every two year) [Muers, 2011]. This is true to the point where the rate-limiting
35
Brief introduction to genetics
step is not variant identification, but the management and interpretation of the resulting data [Cooper, 2011]. This technical expansion has been accompanied by the creation of multi-centre consortiums and broad data-sharing, which have supported the identification of many new genetic variants associated with complex diseases.
Ways to use this information
In order to define a variant as being associated with a specific disease, it must first be identified, and the association replicated in multiple independent samples. Several such studies can then be meta-analysed in order to increase statistical power to identify additional variants (see upper part of Figure 2). Once these genetic variants are identified, the question that arises is how they may affect disease risk. To answer this question, several types of studies can be performed, including functional studies in animal models, integration of different sources of data (e.g. gene expression), and others (see central part of Figure 2). Finally, studies to demonstrate the clinical and biological effects of the genetic variants on disease can also to be performed (Figure 2, lower part). Above all, one of the most important motivations for the investments made in GWAS technology was the expectation that this new information could be translated to clinical practice; this issue will be explored in more detail in the next section and is also the focus of Part II of this doctoral thesis.
progress in SNPs imputation22 has allowed combining
GWAS data sets from different array platforms, and perform-ing large-scale analyses became feasible (Figure 1).
For CAD, the Coronary ARtery DIsease Genome-Wide Replication Meta-Analysis (CARDIoGRAM) consortium meta-analyzed 14 GWASs.23,24 CARDIoGRAM included
22 233 cases and 64 762 controls. The pooled analysis of this large sample replicated almost all previously identified com-mon genetic variants and led to identification of 13 new loci with genome-wide significance (Table).24 Using a more
focused study design, 2 additional loci were identified by members of this consortium.19,25
In addition to CARDIoGRAM, the International Consor-tium for Coronary Artery Diseases (C4D)26is another
large-scale meta-analysis of GWASs for CAD that was not limited to populations of European descent. C4D identified 3 addi-tional new CAD/MI loci, which are listed in the Table. In the future, the pooling of samples from the 2 consortia and
ants,11–13,17–19,21,25,27,28a new locus identified by Wang et al29
in a Han Chinese population, and a variant in the DAB2IP gene identified by Gretarsdottir et al,3032 loci have now been
established as having genome-wide significance (Table). CAD/MI loci identified by GWASs are characterized by the following proprieties:
1. Only a minority cover previously known CAD candi-date genes. Rather, most loci harbor genes that have not been anticipated to be involved in the pathogenesis of atherosclerosis (Table). An example for a new kid on the block is ADAMTS7, which appears to be involved in vascular smooth muscle cell migration and neointima formation in balloon-injured rat arteries,31 vascular
remodeling,32and the pathogenesis of arthritis.33
2. Many loci are devoid of protein-coding genes. For some variants, the signal is even located in gene deserts. Herrington7suggests the existence of novel mechanisms
[image:35.499.159.462.450.675.2]for genotype-phenotype interactions that are still not yet Figure 1.Post– genome-wide association study (GWAS) strategies, and biological and clinical implications of GWAS findings. The fig-ure depicts the different ongoing post-GWAS strategies to understand the mechanisms underlying the associations identified by GWAS approach. The Manhattan plot showing the new coronary artery disease (CAD)/myocardial infarction (MI)–related loci that were identi-fied by CARDIoGRAM was previously used in Schunkert et al.24eQTL indicates expression quantitative trait locus; SNP, single-nucleo-tide polymorphism.
172 Arterioscler Thromb Vasc Biol February 2012
Figure 2. Post–
genome-wide association study (GWAS) strategies, and biological and clinical implications of GWAS findings.
Box 2. Genomes vary widely in size: the smallest known genome for a free-living organism (a bacterium) contains about 600,000 DNA base pairs, while human and mouse genomes have ~3 billion. Except for mature red blood cells, all human cells contain a complete genome.
Each chromosome (physically separate molecules that range in length from about 50 million to 250 million base pairs) contains many genes, the basic physical and functional units of heredity. Genes comprise only about 2% of the human genome (which is estimated to contain >30,000 genes); the remainder consists of non-coding regions, whose functions may include providing chromosomal structural integrity and regulating where, when, and in what quantity proteins are made.
Note that the numbers presented in this box have been extracted from the summary of the GenBank data provided by NCBI, based on genomic sequence information available on Oct 05, 2011.
There are several types of genetic variation, classified according the amount of
genetic material that is involved in that genetic variation:
Note that we have to consider that there are also genome modifications that do not involve a change in the nucleotide sequence (i.e. DNA methylation and histone modification), known as epigenetic variation.
By 2012 the public catalogue of variant sites (dbSNP135) contained approximately
41 million SNPs (www.ncbi.nlm.nih.gov/projects/SNP/snp_summary.cgi).
Box 2
1.1.3. Translation from genetics to clinics
Why and when is it necessary to translate genetics to clinical practice?
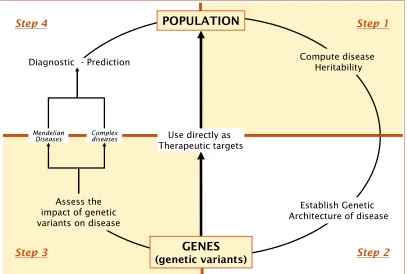
One of the primary motivations for investing in large GWAS studies was to translate this information to clinical practice, which can be achieved in two main ways (see Figure 3):
i) Determining new therapeutic targets. Until now, the selection of targets to be studied in genetics was mainly based on knowledge of physiology. Currently, the hypothesis-free nature of GWAS allows us identify new target regions in the genome, and may help identify new drug targets for the treatment or prevention of disease. A classic example is the gene encoding HMGCoA reductase, variation in which explains only a small fraction of the total variance in cholesterol levels, but is a target for powerful cholesterol-lowering drugs [Lander, 2011; Zuk, 2012].
ii) Improving diagnosis and prediction of disease. For some diseases, early detection, often before signs of the disease are visible, is crucial for the survival of the individual, and the identification of individuals that are at high risk of disease is of particular importance. Genetic information can serve as a diagnostic tool (mainly in the case of monogenic or Mendelian diseases such as Tay-Sachs Disease), or it can also be used to improve the predictive capacity of other tools (mainly for complex diseases).
Step 1: Determine whether the disease being studied has a genetic component
To quantify this genetic contribution, measures such as heritability may be used (see Box 3). This heritability can be defined as the proportion of phenotypic variation that can be attributed to genetic variation [Visscher, 2008]. In order to compute the heritability values, mainly family-based or twin studies are required. If the disease under evaluation has a genetic component, the next step will be designed to identify which are the specific genetic determinants of that disease.
Step 2: Establish the genetic architecture of the disease
[image:38.499.38.445.57.331.2]Second, the genetic variants that confer an excess in risk of the disease must be identified (Part I of the present doctoral thesis is designed to answer this specific question). The identification of these genetic variants has been widely successful for simple Mendelian diseases as they also usually express a highly penetrant phenotype and a very clear inheritance pattern. In the case of complex diseases,
Figure 3. Steps from
populations to genes, and from genes to populations.
INTRODUCTION: General Introduction
Translation from genetics to clinics
the approaches used for Mendelian diseases have not been very successful to identify genetic factors, because they generally make a smaller contribution to these diseases.
Step 3: Determine the impact of the genetic variability on disease risk
The third step that needs to be achieved is to determine the amount of variance in risk of the disease that can be explained by the genetic variants observed. For example, if the sole presence of a SNP was necessary and sufficient for a disease status, we would say that 100% of the risk variance was explained by that variant. For Mendelian diseases the variance explained by genetic variants is much higher than for complex diseases.
Step 4: Evaluate the utility of the genetic information in the diagnosis, prediction, prevention and treatment of the disease
Box 3. The Phenotypic variance (VP) observed within a population consists of a genetic component (VG) and/or an environmental component (VE), which can be computed as follows [Falconer, 1996; Lynch, 1998]:
E G
P V V
V = +
Note that in order to determine the values for both VG and VE, researchers must consider that both genetic and environmental sources of variation are a composite of different components.
- Environmental Variation: Environmental variation can be subdivided into various subcategories; including specific environmental variance (VEs: deviation from the population mean due to environmental conditions experienced by each individual, known as residual variance or error), general environmental variance (VEg: non-genetic sources of variation between individuals that are experienced by many individuals in a population), and genotype-environment interaction (VGxE: involves the unique or different responses of genetic lines to general environmental variation):
Eg GxE Es
E V V V
V = + +
- Genetic Variation: Genetic variation can also be divided into several subcategories, including additive variance (VA: deviation from the phenotypic mean due to inheritance of a particular allele and this allele's relative effect on phenotype), dominance variance (VD: involves deviation due to interactions between alternative alleles at a specific locus), and epistatic variance (VI: involves an interaction between alleles at different loci):
I D A
G V V V
V = + +
Schema of the quantitative contribution of the components of inclusive heritability, from Danchin et al. [2011].
Phenotypes that vary between individuals in a population do so because of both environmental factors and the genes that influence traits, as well as various interactions between genes and environmental factors. Therefore, we can measure the proportion of phenotypic variation in a population that is due to genetic variation between individuals, a measure known as heritability
Under this last definition, there are two types of heritability estimate:
- Broad-sense heritability: The proportion of phenotypic variation due to genetic variation, including effects due to dominance and epistasis.
P G 2
V V H =
- Narrow-sense heritability: Captures only that proportion of genetic variation that is due to additive genetic values.
P A 2
V V h =
Note that since heritability is a proportion, its numerical value will range from 0 (genetic variation does not contribute to individual phenotypic differences in any way) to 1 (genetic variation is responsible for all individual variation).
Example. Traditionally, heritability was estimated from simple, often balanced, designs, such as
the correlation between offspring and parental phenotypes, the correlation between full and half siblings, and the difference in correlation between monozygotic (MZ) and dizygotic (DZ) twin pairs. In artificial selection experiments, heritability can also be estimated from the ratio of the observed selection response (R) to the observed selection differential (S). This relationship is summarized in the "breeder's equation", R = h2S, where:
- R: is the “Response to Selection”, which is the difference between the mean of the parents before selection and the mean of the offspring.
- S: is the “Selection Differential”, which is the difference between the mean of the population and the mean of the individuals that reproduce.
Therefore, it is possible to estimate Narrow sense heritability simply from the regression of offspring phenotypic values on the average of parental phenotypic values. The following example [Wray, 2008] concerns traits with high (0.9) and low (0.1) heritability.
Note that to compute the proportions of the environmental and genetic contributions to disease risk, it is usually assumed that the resemblance between monozygotic and dizygotic twins due to shared environment is the same.
Note also that the Breeder’s equation is mainly used in selective breeding of plants and animals.
There are also more sophisticated ways of estimating heritability [Lee, 2011], although a specific description of the methods available is beyond the scope of this thesis.
Box 3. The Phenotypic variance (VP) observed within a population consists of a genetic component (VG) and/or an environmental component (VE), which can be computed as follows [Falconer, 1996; Lynch, 1998]:
E G
P V V
V = +
Note that in order to determine the values for both VG and VE, researchers must consider that both genetic and environmental sources of variation are a composite of different components.
- Environmental Variation: Environmental variation can be subdivided into various subcategories; including specific environmental variance (VEs: deviation from the population mean due to environmental conditions experienced by each individual, known as residual variance or error), general environmental variance (VEg: non-genetic sources of variation between individuals that are experienced by many individuals in a population), and genotype-environment interaction (VGxE: involves the unique or different responses of genetic lines to general environmental variation):
Eg GxE Es
E V V V
V = + +
- Genetic Variation:Genetic variation can also be divided into several subcategories, including additive variance (VA: deviation from the phenotypic mean due to inheritance of a particular allele and this allele's relative effect on phenotype), dominance variance (VD: involves deviation due to interactions between alternative alleles at a specific locus), and epistatic variance (VI: involves an interaction between alleles at different loci):
I D A
G V V V
V = + +
Schema of the quantitative contribution of the components of inclusive heritability, from Danchin et al. [2011].
Phenotypes that vary between individuals in a population do so because of both environmental factors and the genes that influence traits, as well as various interactions between genes and environmental factors. Therefore, we can measure the proportion of phenotypic variation in a population that is due to genetic variation between individuals, a measure known as heritability
1.1.4. Coronary heart disease: an example of
complex disease
Definition and stages of atherosclerosis
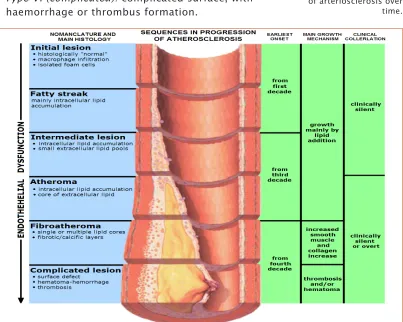
Atherosclerosis can be defined as a chronic, complex inflammatory disease that causes a narrowing of the small blood vessels that supply oxygen to the cells, due to the formation of atheroma plaques consisting of deposits of cholesterol and other lipids, which ultimately cause a chronic inflammatory response in the artery walls) [Ross, 1999]. The American Heart Association [Stary, 1995] identifies six stages of atherosclerosis progression (see Figure 4):
- Type I (initial): isolated macrophage foam cells. - Type II (fatty streak): primarily intracellular lipid
accumulation.
- Type III (intermediate): small extracellular lipid pools. - Type IV (atheroma): extracellular lipid core.
- Type V (fibroatheroma): Lipid core and fibrotic layer; formation of prominent new fibrous connective tissue. - Type VI (complicated): complicated surface, with
[image:42.499.40.443.337.659.2]haemorrhage or thrombus formation.
Figure 4. Graphical
representation of the stages of progression of arteriosclerosis over time.
INTRODUCTION: General Introduction
Coronary heart disease: an example of complex disease
Atherosclerotic plaques can also be separated into two broad categories: stable and unstable (also called vulnerable) [Ross, 1999]. Vulnerable plaques are rich in foam cells, lipids and inflammatory cells, and have a thin fibrous cap. These types of plaques are prone to rupture, which causes an acute thrombus that may occlude the arterial lumen, triggering an acute cardiovascular event. Stable plaques are rich in extracellular matrix and smooth muscle cells, making them more difficult to break, with the result that they are usually asymptomatic.
Definition and manifestations of coronary heart disease
Coronary heart disease (CHD) is one of the main
manifestations of atherosclerosis. It is a complex disease characterised by various clinical presentations, a complex aetiopathogenesis, and a strong environmental component (diet, smoking habit, physical activity). The two main clinical manifestations of CHD are acute coronary syndrome and stable angina. Two main types of acute coronary syndrome have been characterised: i) myocardial infarction (MI), which results from the interruption of blood supply to a part of the heart, causing heart cells to die (in order to determine an MI event it is required that evidence of myocardial necrosis exists by laboratory tests) [Thygesen, 2007]; and ii) unstable angina, which is a strong indicator of an impending MI, is caused by a reduction of coronary blood flow due to transient platelet aggregation on apparently normal endothelium, coronary artery spasms (temporary, sudden narrowing of one of the coronary arteries) or coronary thrombosis (formation of a clot in one of the arteries that conduct blood to the heart muscle) [Lenfant, 2010]. In stable angina, the blood flow and oxygen supply to the myocardium is compromised, causing oppressive chest discomfort/pain that occurs mainly when performing some physical activity and usually disappears with rest.
Global burden of disease
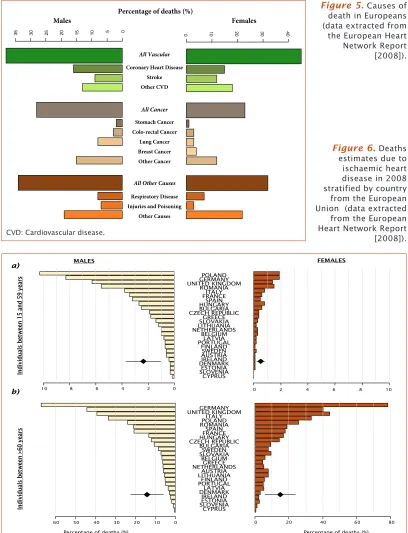
CHD accounts for nearly 20% of deaths worldwide [European Heart Network, 2008; World Health Organization, 2009 ] (see
Figure 5) and it mainly occurs from the fifth or sixth decade
(see Figure 6). Moreover, the incidence of CHD is expected to increase in the coming decades due to an increase in the prevalence of cardiovascular risk factors (CVRFs; described in more detail below).
Males Females
Percentage of deaths (%)
0 10 20 30 40
0 5 10 15 20 25 30 35 All Vascular
Coronary Heart Disease Stroke Other CVD Stomach Cancer Colo-rectal Cancer Lung Cancer Breast Cancer Other Cancer Respiratory Disease Injuries and Poisoning
Other Causes
All Cancer
All Other Causes
-10 -8 -6 -4 -2 0 0 2 4 6 8 10
-60 -50 -40 -30 -20 -10 0 0 20 40 60 80
[image:44.499.36.444.119.652.2]
Figure 5. Causes of
death in Europeans (data extracted from the European Heart Network Report [2008]).
Figure 6. Deaths
estimates due to ischaemic heart disease in 2008 stratified by country from the European Union (data extracted from the European Heart Network Report [2008]).
CVD: Cardiovascular disease.
INTRODUCTION: General Introduction
Coronary heart disease: an example of complex disease
Factors that increase risk of coronary heart disease
The first study performed to identify the causes or factors that modulate risk of CHD to be completely performed and that obtained the most remarkable results was the Framingham Heart Study (www.framinghamheartstudy.org) [Dawber, 1951]. The main objective of that project was to search for factors that influence the development of disease by performing a cohort study comparing individuals who had had a cardiovascular event to the group who did not suffer from any event at the end of the follow-up [Dawber, 1951]. After just 4 years of follow-up, the authors observed that certain attributes were strongly related to risk of developing CHD, such as elevated lipid levels and elevated blood pressure. Later, they also identified smoking, excess of body weight, lack of physical activity, low vital capacity (the maximum amount of air a person can expel from the lungs after a maximum inspiration), gout, and diabetes as relevant risk factors. Moreover, they also concluded that when more than one of these risk factors were present, there was a marked increase in susceptibility to CHD [Dawber, 1966]. These findings had important consequences for our understanding of the physiological aspects of the disease, as well as for primary prevention. Currently, the cardiovascular risk factors (CVRFs) that are considered to cause an increase in risk can be classified as modifiable or non-modifiable (see Table 2). Also, the importance of genetic factors in risk prediction has long been appreciated, and is exemplified in a simple form by the value of family history in increasing CVD risk [Jostins, 2011].
Non-modifiable Modifiable
Age Smoking
Sex Hypertension
Genetics Hypercholesterolemia
Family history Type II Diabetes
Body Mass Index
[image:45.499.158.461.477.592.2]Physical activity
Table 2.
1.1.5. Current state of the field of complex
disease genetics
Problems in genetic studies: Lack of robust findings
Using the candidate gene approach, a large number of genetic variants have been studied during the last 20 years, but robust, replicable evidence has been found for only a limited number, while the majority showed contradictory results between studies [Ioannidis, 2001]. This lack of robust findings for genetic studies in complex diseases may be due to different reasons. One of the possible explanations has been described as the “winner’s curse” effect, where the magnitude of the associations observed for the genetic variants is higher in early studies than in subsequent replication studies. This effect may represent either i) a spurious finding that is not validated by subsequent research, ii) an exaggerated finding that eventually finds its appropriate measure, or iii) an effect that is stronger in some subpopulations than in others [Ioannidis, 2001].
Some recommendations have been proposed to increase the reliability of the reported evidence, particularly the STREGA guidelines (STrengthening the REporting of Genetic Association studies) [Little, 2009], which suggest a series of steps that might be followed in order to enhance the transparency of the reporting of genetic association studies. Briefly, these guidelines are an extension of the STROBE (STrengthening the Reporting of OBservational studies in Epidemiology) [von Elm, 2007] statement that include recommendations on items that are specifically relevant to genetic studies, including laboratory methods for genotyping and allele-calling, genotyping accuracy,
haplotype modelling, population stratification, relatedness
between subjects, and statistical adjustments to allow for multiple hypothesis testing [Hudson, 2009]. STREGA also recommends that the stage involving identification of genetic variants be followed by a subsequent stage of validation of those findings in independent populations in order to verify or improve the estimate of the true effect [Hlatky, 2009] and minimise the publication of false positive results.
Problems in genetic studies: Correct selection of genes/loci
Another of the reasons of such lack of robust results in genetic association studies was the selection of appropriate


![Figure 8. Cumulative incidence of coronary events per 100,000 individuals aged 35-64yrs in the WHO MONICA study (1985-94) [Tunstall-Pedoe, 1999].](https://thumb-us.123doks.com/thumbv2/123dok_es/5319468.98665/56.499.117.460.517.671/figure-cumulative-incidence-coronary-events-individuals-monica-tunstall.webp)