ELUCIDATING THE GENETIC SUSCEPTIBILITY OF
HYPERTENSION ASSOCIATED MICROALBUMINURIA:
GENOME WIDE SCAN.
FERNANDO MARTÍNEZ GARCÍA
UNIVERSITAT DE VALÈNCIA
Servei de Publicacions
-
Dr. Rafael Carmena Rodriguez
-
Dr. Roland Schmieder
-
Dr. Jose Luis Rodicio Diaz
-
Dr. Juan Carlos Martín Escudero
-
Dr. Jose Tomas Real Collado
Va ser dirigida per:
Dr. Felipe Javier Chaves Martínez
Dr. Josep Redón Mas
©Copyright: Servei de Publicacions
Fernando Martínez García
Dipòsit legal: V-2096-2011
I.S.B.N.: 978-84-370-7809-0
Edita: Universitat de València
Servei de Publicacions
C/ Arts Gràfiques, 13 baix
46010 València
Spain
ELUCIDATING THE GENETIC SUSCEPTIBILITY OF
HYPERTENSION ASSOCIATED MICROALBUMINURIA:
GENOME WIDE SCAN
Doctoral Thesis presented by: Fernando Martínez García, In order to obtain the grade of Medical Doctor.
Director of the thesis:
Dr. F. Javier Chaves Martínez and Professor Josep Redón i Más.
Felipe Javier Chaves Martínez, doctor in biological sciences, degree in biology and specialist in genetics, and Josep Redón Mas, professor of medicine of the University of Valencia.
To Whom It May Concern:
The doctoral thesis, ELUCIDATING THE GENETIC SUSCEPTIBILITY OF HYPERTENSION ASSOCIATED MICROALBUMINURIA: WHOLE GENOME SCAN, presenting by Fernando Martínez García and being directed by doctors F. Javier Chaves Martínez and Josep Redón Mas, is an important contribution to the genetics of renal damage in essential hypertension and it is suitable to be presented and defended in front of the corresponding tribunal.
In Valencia, February of 2010.
... knowledge must continually be renewed by ceaseless effort, if it is not to be lost. It resembles a statue of marble which stands in the desert and is continually threatened with burial by the shifting sand. The hands of service must ever be at work, in order that the marble continue to lastingly shine in the sun. To these serving hands mine shall also belong.
Acknowledgements
This doctoral thesis has been done within the program “Contratos post-formación sanitaria
especializada” of the National Health Institute Carlos III.
I would like to acknowledge, first and foremost, to the doctors, Josep Redon and Javier Chaves
who have trusted on me to carry out this project.
Secondly, I want to acknowledge to those who helped me during my stay in the Glasgow
Cardiovascular Research Centre, in special: Dra. Chiara Taurino, Dra. María Moreno, Dra.
Samantha Madrazo, Dr Raul Alba and Dr. Ulf Nesius for their support; Dr Sandosh Padmanabhan
for introduce me in the genetic analysis and in the wonderful world of call rates, Q-Q plots and
cluster plots; Professor Anna Dominiczak, director of the GCRC, and Dr Christian Delles for
organize my stay in that important research centre; To Margaret Kinninmont for being so kind with
me and Jillian Blair for help me to find a place where to live in Glasgow.
To our colleagues Dr Jose María Pascual and Dr Francisco Perez of Sagunto`s hospital who were
in charge for the recruitment of patients in the hospital of Sagunto and helped me with the clinical
database.
To the Professor Richard Cooper who as a director of the epidemiology department of the Loyola
University in Chicago, helped me to interpret the results and put me in contact with Dr Bamidele
Tayo who has been very important in the downstream analysis; To Dr Ramon Durazo for help me
to understand the complex world of the statistic.
To the people of the microarray lab within the central research unit of the Medicine Faculty
(University of Valencia) who performed the genotyping procedure, especially to Eva Serna who
solved some of the technical questions related with the genotyping procedure.
To Dra.María Luisa Mansego who has been my support in the genetic lab during three years and
has helped me to organize the information.
To all the members of the Internal Medicine department, especially those who have heard my
complaints during those long hours that I spent in the office called "Estar de Malats". To all the
people who are involved in clinical research within the Hypertension Unit, in special: Elena, Oscar,
Miriam and Antonio Vicente for that shorts breaks.
Acronyms
(arrange by alphabetical order)ABPM, Ambulatory blood pressure monitoring.
ACE Angiotensin I converting enzyme.
ACEi, Angiotensin I converting enzyme inhibitors.
ACR, Albumin creatinine ratio.
ADAM23, A disintegrin and metalloprotease domain 23.
ADAM7, Disintegrin and metalloproteinase domain-containing protein 7 precursor gene.
ADD1, Alpha adducin gene.
ADIPOQ, Adiponectin precursor.
ADLR1, Aldose reductase gene.
ADRBR2, Beta adrenergic receptor type 2 gene.
AGE, Advanced glycation end products.
AGT, Angiotensinogen.
ANKAR, Ankyrin and armadillo repeat-containing protein gene.
ANP, Atrial natriuretic peptide.
Apo E, Apolipoprotein E.
apt, Affymetrix power tool.
AQP1 Aquaporin 1 gene.
ARBs, Angiotensin II receptor blockers.
ARBs, Angiotensin II receptor blockers.
ASNSD1, Asparagine synthetase domain-containing protein 1 gene.
AT1R, AGTR1 Angiotensin II type 1 receptor gene.
AUC, Area under curve.
Bcl-2, B-cell leukaemia/lymphoma 2 gene.
BMI, Body mass index.
BNC2, Basonuclin gene.
BONF, Bonferroni correction test..
BP, Blood pressure.
BRLMM, Bayesian robust linear model with Mahalanobis distance classifier.
BSA, Body surface area.
C12orf59, Chromosome 12 open reading frame 59 gene.
CC, Creatinine clearance.
CDH8, Cadherin-8 precursor.
CDH11, Cadherin 11 precursor gene.
CDKN2A, Cyclin-dependent kinase inhibitor 2A.
CDKN2B, Cyclin-dependent kinase inhibitor 2B
CETP, Cholesterol ester transfer protein precursor.
CG, Candidate genes.
Chr, Chromosome.
CKD, Chronic kidney disease
CNDP1, Carnosine dipeptidase 1 gene.
CNV, Copy number variation.
COL4A1 Collagen type 4 Alpha 1 gene.
CRF, Chronic renal failure.
CRP, C reactive protein.
CV, Cardiovascular.
CXCL12, Chemokine (C-X-C motif) ligand 12 gene.
CYP11B2, Aldosterone synthase gene.
DBP, Diastolic blood pressure.
DF, Degree freedom.
DM, Dynamic model.
DM2, Type 2 diabetes mellitus.
DN, Diabetic nephropathy.
DNA, Deoxyribonucleic acid.
DSP, Discordant sib-pairs.
EDTA, Ethylenediaminetetraacetic acid.
eGFR, Estimated GFR.
ELMO1, Engulfment and cell motility 1 gene.
ELMO3, Engulfment and cell motility protein 3.
EM, Expectation maximization algorithm.
eNOS, Endothelial nitric oxide synthase.
ENPP1, Ectonucleotide pyrophosphatase phosphodiesterase 1 gene.
EPDR1, Ependymin related protein 1 gene.
EPHA5, Ephrin-A5 precursor gene.
ESRD, End stage renal disease.
FBAT, Family based association test.
FDR, False discovery rate.
GCOS, GeneChip Operating Software.
GEE , Generalized estimating equations.
GFR, Glomerular filtrate rate.
GLEPP1, Glomerular epithelial protein 1.
GLM, Generalized linear model.
GRR, Genotypes relative risk.
GTYPE, GeneChip Genotyping Analysis Software.
GWAS, Genome wide association studies.
HDL, High density lipoprotein.
hNPY, Human neuropeptide Y.
HOMA, Homeostatic model assessment index.
HTN, Essential hypertension.
HWE, Hardy-Weinberg equilibrium.
I/D, Insertion-Deletion polymorphism.
IBD, Identity by descent.
IBS, Identity by state.
IFNA, Interferon alpha precursor.
IFNB1, Interferon beta precursor.
IFNW1, Interferon omega-1 precursor.
IFNγ, Interferon gamma
IGF1R, Insulin growth factor 1 receptor.
IGF2BP2, Insulin-like growth factor 2 mRNA-binding protein 2.
IL-1, Interleukin 1
IL-6, Interleukin 6.
IL-8, Interleukin 8.
IL-33, Interleukin 33.
IMPAD1, Inositol monophosphatase domain containing 1 gene.
IMT, Intima media thickness.
IP-10, Interferon-gamma-inducible protein.
KLRC2, NKG2-C type II integral membrane protein gene.
KLRC3, NKG2-E type II integral membrane protein gene.
KLRC4, NKG2-F type II integral membrane protein gene.
KLRD1, Natural killer cells antigen CD94 gene.
KLRK1, Killer cell lectin-like receptor subfamily K member 1 gene.
KSR2, Kinase suppressor of Ras 2.
LD, Linkage disequilibrium.
LDL, Low density lipoprotein.
LOD, Logarithmic of odds score.
LOX1, Oxidized low-density lipoprotein receptor 1.
LPL, Lipoprotein lipase.
LR, Logistic regression.
LVM, Left ventricular mass.
MAF, Minor allele frequency.
MALD, Mapping by admixture linkage disequilibrium.
MCF2L2, MCF2 cell line derived transforming sequence-like 2 gene.
MCTP2, Multiple C2 and transmembrane domain-containing protein 2 gene.
MCP-1, Monocyte chemoattractant protein-1.
MDRD, Modification of diet in renal disease.
MIP-1δ, Macrophage inflammatory protein-1delta.
MLS Maximum likelihood score.
MnSOD, Manganese superoxide dismutase.
MSR1, Macrophage acetylated LDL receptor I and II gene.
MTHFS, Methenyltetrahydrofolate synthetase.
MYH9, Non-muscle myosin heavy chain 9 gene.
NADPH, Nicotiamide-adenin dinucleotid phosphate.
NCALD, Neurocalcin D gene.
NRP1, Neuropilin 1 gene.
OGGT Oral glucose tolerance test.
OLR1, Oxidized low-density lipoprotein receptor 1 gene.
OR, Odds ratio.
ORMDL1, ORM1-like1.
OSA, Ordered subsets analysis.
OSGLPL1, O-sialoglycoprotein endopeptidase-like 1 gene.
PAI-I1 Plasminogen activator inhibitor type 1.
PCDH9, Protocadherin 9.
PCDH10, Protocadherin-10 precursor.
PCDH18, Protocadherin-18 precursor.
PK-C, Protein kinase C.
PLEKHH2, Pleckstrin homology domain containing, family H gene.
PON-1, Paraoxonase 1.
PTPRO, Protein tyrosine phosphatase receptor type O.
PVT1, Plasmocytoma variant translocation gene.
QC, Quality control
Q-Q, Quantile-Quantile.
QTL, Quantitative trait loci.
RAAS, Renin angiotensin aldosterone system.
RAGE, Receptor of the advanced glycation end products.
REEP1, Receptor Expression-Enhancing Protein 1.
RFC5, Replication factor C subunit 5.
RFLP, Restriction fragment length polymorphism.
RI, Renal insufficiency.
SBP, Systolic blood pressure.
SD, Standard deviation
SFRP4, Secreted frizzled-related protein 4 precursor gene.
SLC12A3, Solute carrier family 12, member 3 gene.
SLC40A1, Solute carrier family 40 member 1.
SLE, Systemic lupus erythemathosus.
SNP, Single nucleotide polymorphisms.
SNS, Sympathetic nervous system.
TAOK3, Serine/threonine-protein kinase TAO3.
TDT, Transmission disequilibrium test.
TGF-B, Transforming growth factor beta.
TGFBR1, TGF-B receptor type 1 gene
TGFBR2, TGF-B receptor type 2 gene.
TNF-α Tumor necrosis factor alpha.
TRPC1, Transient receptor potential cation channel subfamily C, member 1 gene.
TXNDC3, Thioredoxin domain-containing protein 3 gene.
U6, U6 spliceosomal RNA gene. U8, U8 small nucleolar RNA gene.
UAE, Urinary albumin excretion.
UTE, Urinary transferrin excretion.
VEGF, Vascular endothelial growth factor.
WSB2, WD repeat and SOCS box-containing protein 2.
Genetic glossary
Additive genetic model - In a disease association study, if the risk conferred by an allele is increased r -fold for heterozygotes and 2r -fold for homozygotes, this corresponds to additive model. These data are best analyzed using Armitage trend test for genotype frequencies or by logistic regression in which the genotypes are represented as ( -1), 0, (+1). This genotype -based association test does not require the locus to be in Hardy -Weinberg equilibrium. In the case of an association with heterozygosity, the additive model test may be statistically non -significant despite the presence of an association. Thus, a non -significant additive model test does not rule out an association. It has been pointed out that genes do not generally act in a simple additive manner but through complex networks involving gene gene and gene -environment interactions
Admixture mapping (mapping by admixturelinkage disequilibrium -MALD) - An association -based approach to localizing disease -causing variants thatdiffer in frequency between two historicallyseparated populations by a whole -genome scan. Fundamental to the use of admixture mapping is the knowledge that the disease of interest exhibits frequency differences across the two populations because of genetic differences.
Affected sibpair (ASP) method - A linkage study design that tests for excess sharing of marker alleles identical by descent in affected -affected sibpairs. This method is often described as a nonparametric and model -free alternative to the parametric LOD score method.
Allele - If the DNA sequence at a given locus (often a gene or a marker) varies between different chromosomes in the population, each different version is an allele. If there are two alleles at a given locus, the allele that is less common in the population is the minor allele.
Association - Comparison of the chance that people who have a particular genetic variation in their DNA have a particular characteristic (trait), symptom, or disease with the chance that people who do not have the particular genetic variation have the particular characteristic, symptom, or disease.
Candidate gene - . A gene known to be located in the region of interest whose product has biochemical or other properties suggesting that it may prove to be the disease gene being sought.
Case -control study: A design preferred over cohort studies for relatively rare diseases in which cases with a disease or exposure are compared with controls randomly selected from the same study base. This design yields odds ratio (as opposed to relative risk from cohort studies) as the measure of the strength of association.
Centimorgan - 1 centimorgan (cM) corresponds to a region within which a crossover is expected once every 100 meioses. This implies a 1% chance of a single crossover at a single meiosis, and because the probability of a double crossover is exceedingly small (about 0·01%), this also corresponds to a chance of roughly 1% of recombination at each meiosis.
Chromosome - One of the threadlike "packages" of genes and other DNA in the nucleus of a cell. Humans have 23 pairs of chromosomes, 46 in all: 44 autosomes (or non -sex chromosomes) and two sex chromosomes. Each parent contributes one chromosome to each pair, so children get half of their chromosomes from their mothers and half from their fathers.
Cohort study: A longitudinal follow -up study which begins with a group of people who do not have the trait of interest at the outset but a proportion of which will develop during the follow -up. The outcome is modeled for the explanatory variables to obtain the relative risk. Cohort studies may be historical or prospective.
Complex disease - The term complex trait/disease refers to any phenotype that does not exhibit classic Mendelian inheritance attributable to a single gene; although they may exhibit familial tendencies (familial clustering, concordance among relatives). The contrast between Mendelian diseases and complex diseases involves more than just a clear or unclear mode of inheritance. Other hallmarks of complex diseases include known or suspected environmental risk factors; seasonal, birth order, and cohort effects; late or variable age of onset; and variable disease progression.
Dominant allele - An allele that masks an alternative allele when both are present (in heterozygous form). Homozygous dominant and heterozygous genotypes contribute the same to the phenotype. Most common autosomal dominant diseases are due to mutations in transcription factor genes
Dominant model - A genetic association analysis mode that examines association with a dominant allele. The comparison groups are wild -type homozygous genotypes vs allele positivity (combining heterozygotes and homozygotes for the variant).
phenotype data when genotypes are not fully observable (this requires the assumption of HWE and calculation of expected genotypes from phenotype frequencies)
Exon - A segment of a gene that is represented in the mature RNA product. Individual exons typically include protein -coding sequences.
Gene - the functional and physical unit of heredity passed from parent to offspring. Genes are pieces of DNA, and many genes contain the information for making a specific protein.
Gene family - A group of genes having similar DNA sequence evolved from a single ancestral gene. These genes may or may not be located in the same region of a chromosome.
Genetic marker - a segment of DNA with a known physical location on a chromosome and a discernible inheritance pattern. A marker can be a gene, or it can be a section of DNA with no known function. DNA segments that lie near each other on a chromosome tend to be inherited together. Therefore, markers often are used as indirect ways of tracking the inheritance pattern of a gene that has not yet been identified, but whose approximate location is known.
Genetic variation(variant) - differences (or variants) in DNA sequences that are found by comparing the genomes of different individuals and can be used as genetic markers to track inheritance patterns in families.
Genome - all the DNA contained in an organism or a cell, which includes the chromosomes within the nucleus and the DNA in organelles called mitochondria.
Genomic control - One method to adjust for population stratification bias in case -control association studies is to use a 'genomic control markers' panel. The panel consists of 20 -50 polymorphic markers unlinked to the loci of interest. The information obtained from unlinked markers may be used in a variety of ways (genomic control, structured association, latent -class approach). The adjustments requires some statistical manipulation, which can be handled using a variety of statistical approaches.
Genotype - all or part of the genetic make -up of an individual or group, including variation at a particular genetic marker or gene.
influences the outcome in different ways depending on the genotype. This requires inclusion of a multiplicative interaction term into the statistical model.
Genotype relative risk (GRR) - The risk of disease for one genotype at a locus versus another. It is usually assessed as having one copy of the allele of interest (Aa) vs having none (AA), which is GRR1; and having two copies of the allele (aa) vs having none, which is GRR2. In simple statistical analysis this is achieved by using dummy variables for each genotype, selecting the genotype AA as referent and obtaining odds ratios for other genotypes Aa and aa. Most of the time, what is presented is actually genotype odds ratio.
Genotyping - the process whereby the genotype(s) of an individual or many individuals is (are) determined from a DNA sample(s) in the laboratory. Typically, DNA samples are obtained by drawing a small amount of blood or by collecting cheek cells.
GWAS (Genome -wide Association Studies) - research studies that involve scanning markers (genotypes) across the complete set of DNA, or genomes, of many people to find genetic variations associated with a particular disease.
Hardy -Weinberg equilibrium (HWE) - In an infinitely large population, gene and genotype frequencies remain stable as long as there is no selection, mutation, or migration. For a bi -allelic locus where the gene frequencies are p and q: p2+2pq+q2 = 1. HWE should be assessed in controls in a case -control study and any deviation from HWE should alert
for genotyping errors (Gomes, 1999; Lewis, 2002). Relying only on HWE tests to detect genotyping errors is not recommended as this is a low power test (Leal, 2005).
Haplotype - A series of alleles at linked loci along a single chromosome.
Haplotype blocks - A chromosomal region with high linkage disequilibrium and low haplotype diversity. Probably flanked by recombinational hotspots, haplotype blocks are shorter in African populations (average 11kb) than in other populations (average 22kb) (Gabriel, 2002). Haplotype block lengths correlate with recombinational rate (Greenwood, 2004) but most haplotype -block boundaries do not occur at hotspots (Wall, 2003). All pairs of polymorphisms within a block are expected to show high linkage disequilibrium. Haplotype blocks are useful in association studies and a representative set of haplotype tagging SNPs can be used instead of the whole set of polymorphisms within a block (Zhang, 2004). Haploview is the most popular software for haplotype block analysis.
Heritability - Fraction of the total phenotypic variation in a population that is caused by genetic differences between individuals: genetic variance / total variance. The genetic variance is the part of the total variance that is caused by allelic variations at whatever loci influence the trait. The total variance is the amount of variation in phenotype in a defined population. It only applies to a population on which observations are made and cannot be extended to other populations that have different allele frequencies or environments. Therefore, it cannot be used to explain differences between populations.
High -throughput genotyping - Simultaneous genotyping of large numbers of samples. Most machines can run 4x96 (384) samples simultaneously (SNP typing, real -time PCR, sequencing) with a queuing system that would allow automatic continuation of the typing. A number of companies perform SNP high -throughput genotyping
Identity by descent (IBD) - Alleles that trace back to a shared ancestor. For sibs, refers to inheritance of the same allele from a given parent.
Identical -by -state (IBS) - Two alleles (from the same or different individuals) are identical -by -state if they are of the same type.
Intron - Non -coding DNA that separates neighboring exons in a gene.
Linkage analysis - Strategy for gene mapping by testing for linkage between markers and phenotypes using families. In classic linkage analysis the transmission model is fixed (possibly with parameter values obtained from segregation analysis) and the likelihoods (LOD scores) of the disease and marker data are compared under the null hypothesis of no linkage and the alternative hypothesis of linkage. Non -parametric linkage analysis avoids fixing an explicit mode of inheritance of the disease.
Linkage disequilibrium - A condition in which alleles at two loci or genes are found together in a population at a greater frequency than that predicted simply by the product of their individual allele frequencies. Alleles at markers near disease causing genes tend to be in linkage disequilibrium in the affected individuals. This is particularly the case in isolated, homogeneous populations, in which it can be assumed that most affected individuals carry the same mutation.
Locus - A locus is a unique chromosomal location defining the position of an individual gene or DNA sequence. In genetic linkage studies, the term can also refer to a region involving one or more genes, perhaps including noncoding parts of the DNA.
the ratio of two probabilities: (1) the probability of the observed inheritance of a trait (usually a disease) and alleles at a marker in a pedigree if they were linked given a inheritance model for the trait and a recombination probability between marker and disease, and (2) the probability of the observed inheritance of a trait and marker in a pedigree under the assumption that they are not linked. A LOD score is the logarithm of the ratio of those two probabilities. LOD scores can be added across pedigrees, and are usually taken to indicate significant linkage if they are above three. The recombination fraction that gives the highest LOD score from a marker of known genomic location can be used to map a gene.
Microarray - A novel method of studying large numbers of genes simultaneously by automating and miniaturising a hybridisation detection system. The method uses a robot to precisely apply tiny droplets containing DNA to glass slides. The labelled probes are allowed to bind to complementary DNA strands on the slides. The slides are put into a scanning microscope that can measure the brightness of each fluorescente dot; brightness reveals how much of a specific DNA fragment is present.
Microsatellite - Microsatellites consist of multiple repeats of a short sequence (typically 2–8 bp) such as: CACACA . . . . The alleles of a microsatellite are differentiated by the number of repeats they involve (eg, CA12 would denote 12 CA repeats in a row).
Misclassification - Errors in the classification of individuals by phenotype, exposures or genotype that can lead to errors in results. The probability of misclassification can be the same across all groups in a study (nondifferential) or vary among groups (differential).
mRNA (messenger RNA) - RNA transcribed from genes undergoes posttranscriptional processing and the resultant mature mRNA is used as the template for the translation process that results in synthesis of a protein.
Multivariable analysis - As opposed to univariable analysis, statistical analysis performed in the presence of more than one explanatory variable to determine the relative contributions of each is (or should be) called multivariable analysis (in practice, however, it is called univariate and multivariate analysis more frequently). It is a method to simultaneously assess contributions of multiple variables or adjust for the effects of known confounders.
Permutation Test - A statistical approach to examine statistical significance of associations based on Monte Carlo methods that accounts for multiple comparisons issue
a paternally derived chromosome from a father with diplotype U1U3–V1V2 it either implies that the father was in phase (1) and no recombination has occurred, or he was in phase (2) and there has been recombination.
Phenotype - the observable traits or characteristics of an individual such as hair color, weight, or the presence or absence of a disease. Phenotypic traits are not necessarily genetic.
Polymerase Chain Reaction (PCR) - A procedure for obtaining a large number of copies of a particular segment of
DNA. The principle depends on the requirement by DNA polymerase of a primer with a 3’ end to which nucleotides can be added. Two such synthetic primers define a segment that is replicated in a thermal cycle of denaturation, reannealing (reformation of complementary primer - DNA structure), and replication. Each cycle, which takes two to three minutes, doubles the amount of DNA between the primer boundaries. Thirty cycles would yield 230 copies. PCR has made it possible to characterize extremely small amounts of DNA.
Polymorphism - Implies genetic variation at a designated locus. A locus that is polymorphic has at least two alternative alleles. Unfortunately, polymorphism has alternative, more specific definitions (none universally accepted), an important example being “the existence of two or more genetic variants (alleles, other sequence variants, chromosomal structure variants) at significant frequencies in the population.
Population stratification - Anexample of 'confounding by ethnicity' in which the co -existence of different disease rates and allele frequencies within population sub -sections leads to a spurious association at the population level. Differing allele frequencies in ethnically different strata in a single population may lead to a spurious association or 'mask' an association by artificially modifying allele frequencies in cases and controls when there is no real association (for this to happen, the subpopulations should differ not only in allele frequencies but also in baseline risk to the disease being studied) (Mark, 1996; Altshuler, 1998). Confounding, cryptic relatedness (which increases overdispersion of the test statistics and leads to inflation of significance levels overall) and selection bias are potential consequences of population stratification (Thomas, 2005). It is notable that the consequences of population structure on association outcomes increases with sample size, i.e., larger sample size is not a remedy for this issue and may make it worse (Marchini, 2004). Case -control association studies can still be conducted by using genomic controls (Devlin, 1999; Pritchard, 1999) even when population stratification is present.
Quantile -Quantile plot (Q -Q plot) - In a GWAS, the Q -Q plot is used to assess the number and magnitude of observed associations compared with the expectations under no association. The nature of deviations from the identity line provide clues whether the observed associations are true associations or may be due to population stratification or cryptic relatedness or something else.
Quantitative character - A character displaying a 'continuous' phenotypic range rather than discrete classes; characters measured rather than counted such as metabolic activity, height, length, width, arm span, body fat content, growth rate, milk production, blood pressure. The genetic variation underlying a continuous character distribution may be the result of segregation at a single genetic locus or more frequently, at numerous interacting loci which produce a cumulative effect on the phenotype (with contributions from the environment). A gene affecting a quantitative character is a quantitative trait locus, or QTL (should be seen as a continuous trait locus).
R project for statistical computing - R is a language and environment for statistical computing and graphics which can be seen as a different implementation of the S language. R and a comprehensive set of programs written for a variety of statistical analysis are all available as Free Software.
Recessive - A trait that is not expressed in heterozygotes (i.e., that can only be expressed in the homozygotes). Most common recessive disease genes are those encoding metabolic enzymes.
Recessive model - A genetic association analysis mode that examines association with a recessive allele. The comparison groups are variant homozygous genotypes vs the rest (combining heterozygotes for the variant and homozygotes for the wild -type allele).
Restriction Fragment Length Polymorphism (RFLP) - Genetic variation at the site where a restriction enzyme cuts a piece of DNA. Such variations affect the ability of the restriction enzyme to cut, and therefore, produce different fragment sizes. Most RFLPs are single base pair changes in the 4–6 bp target sequence of the restriction enzyme. Vice versa, many single nucleotide polymorphisms (SNPs) are RFLPs and can be detected with this technique.
Single nucleotide polymorphism (SNP) - A DNA variant that represents variation in a single base. A common SNP can be defined as a locus at which two SNP alleles are present, both at a frequency of 1% or more. Across the human genome there could be 10 million common SNPs.
Tag SNP - It is a representative single nucleotide polymorphism (SNP) in a region of the genome with high linkage disequilibrium (the non -random association of alleles at two or more loci). It is possible to identify genetic variation without genotyping every SNP in a chromosomal region. Tag SNPs are useful in whole -genome SNP association studies in which hundreds of thousands of SNPs across the entire genome are genotyped.
Trait - Some characteristic of, for instance, a human, that may or may not have a genetic component.
Index
1. BACKGROUNG... 3
2. CURRENT KNOWLEDGE ABOUT MICROALBUMINURIA ... 4
2.1. Definition and clinical relevance ...4 2.2. Physiopathology of microalbuminuria ...7 2.2.1. Hyperfiltration ...7 2.2.2. Glomerular basal membrane abnormalities...8 2.2.3. Endothelial dysfunction...8 2.2.4. Nephrosclerosis...8 2.3. Factors related to microalbuminuria ...10 2.3.1. Cross-sectional studies ...10 2.3.1.1. Blood pressure values...10 2.3.1.2. Insulin resistance and hyperinsulinemia...11 2.3.1.3. Salt-sensitivity ...11 2.3.1.4. Overactivity of the Renin-Angiotensin System ...12 2.3.1.5. Inflammation...12 2.3.2. Follow-up studies ...12 2.3.2.1. Blood pressure and glucose values ...12 2.3.2.2. Baseline urinary albumin excretion ...13 2.4. Natural history of microalbuminuria in hypertension...15 2.5. Effects of therapy in microalbuminuria...16 2.5.1. Short term effects ...16 2.5.2. Long term effects...17
3. GENETIC BASES OF MICROALBUMINURIA AND RELATED TRAITS. ... 20
3.1. Overview...20 3.2. Evidence supporting the influence of genetic factors for renal traits...21 3.3. Elucidating the genetic susceptibility of microalbuminuria and renal traits ...22 3.4. Genetic bases of microalbuminuria and related traits in essential hypertension and
3.4.1. Candidate gene studies...24 3.4.1.1. RAAS genes...24 3.4.1.2. Natriuretic peptides and alpha-adducin genes ...25 3.4.1.3. Adrenergic system and adrenomedulin genes ...26 3.4.1.4. Oxidative stress...27 3.4.1.5. Kallikreins...27 3.4.1.6. Other genes ...27 3.4.2. Linkage studies ...32 3.4.3. Whole genome association studies and combined strategies ...36 3.4.4. Summary of genetics of microalbuminuria in HTN and general population...38 3.5. Genetic bases of microalbuminuria and related traits in type 1 and type 2 diabetes...40 3.5.1. Overview ...40 3.5.2. Candidate gene studies...41 3.5.2.1. RAAS genes...41 3.5.2.2. Fibrinolysis ...41 3.5.2.3. Oxidative stress...42 3.5.2.4. Lipid metabolism ...42 3.5.2.5. Growth factors...43 3.5.2.6. Glucose metabolism...43 3.5.3. Linkage studies ...49 3.5.4. Whole genome association studies and combined strategies ...57 3.5.5. Summary of genetics of microalbuminuria in diabetes mellitus ...62
4. HYPOTHESIS AND OBJECTIVES... 65
4.1. Hypothesis...67 4.2. Objectives...68 4.2.1. Primary ...68 4.2.2. Secondary ...68
5. MATERIALS AND METHODS... 69
5.4.1. Blood pressure measurements (BP) ...75 5.4.2. General analytics...75 5.4.3. Urinary albumin excretion (UAE) ...75 5.5. Genotyping procedure. ...76 5.5.1. Reagent preparation and storage...77 5.5.2. Restriction enzyme digestion...77 5.5.3. Ligation...78 5.5.4. PCR...80 5.5.5. PCR product purification and elution ...83 5.5.6. Quantitation and normalization...85 5.5.7. Fragmentation ...87 5.5.8. Labelling ...88 5.5.9. Target Hybridization ...89 5.5.10. Washing, staining, and scanning Arrays ...91 5.6. Management of the genotyping microarray data...98 5.7. Resume of the genotyping procedure...99 5.8. Statistical analysis...101 5.8.1. General statistics...101 5.8.2. Genetic statistics ...101
5.8.2.1. Individual SNPs association with microalbuminuria and albuminuria
(qualitative traits) ...101 5.8.2.2. Individual SNPs association with UAE (quantitative trait) ...102 5.8.2.3. Individual SNPs association with albuminuria, microalbuminuria and
UAE (qualitative and quantitative traits) including significant co-variables ...103 5.8.2.4. Multiple comparison ...103 5.8.2.5. Haplotype analysis ...104 5.8.2.6. Haplotype-based association tests with generalized linear models (GLM) ...104 5.8.2.7. Genetic statistical power ...104 5.8.2.8. Quantile-Quantile plots...106
6. RESULTS... 107
6.3.4 Association analysis for quantitative traits (Unadjusted) ...147 6.3.4.1 Association analysis for UAE ...147 6.3.4.1.1 Individual SNPs analysis ...147 6.3.4.1.2 Haplotype and LD analysis...149 6.3.4.2 Association analysis for UAE after excluding patients with macroalbuminuria..154 6.3.4.2.1 Individual SNPs analysis ...155 6.3.4.2.2 Haplotype and LD analysis...155 6.3.5 Association analysis for quantitative traits adjusted for clinical co-variables. ...159 6.3.5.1 Association analysis for UAE ...159 6.3.5.1.1 Models with number of drugs as co-variable ...159 6.3.5.1.1.1 Individual SNPs analysis ...159 6.3.5.1.1.2 Haplotype and LD analysis...161 6.3.5.1.2 Models without number of drugs as co-variable ...165 6.3.5.1.2.1 Individual SNPs analysis ...165 6.3.5.1.2.2 Haplotype and LD analysis...166 6.3.5.2 Association analysis for UAE after excluding patients with macroalbuminuria..168 6.3.5.2.1 Models with number of drugs as co-variable ...168 6.3.5.2.1.1 Individual SNPs analysis ...168 6.3.5.2.1.2 Haplotype and LD analysis...169 6.3.5.2.2 Models without number of drugs as co-variable ...169 6.3.5.2.2.1 Individual SNPs analysis ...169 6.3.6 Tables of the main results. ...170 6.3.6.1 Table 6.46. Main associated SNPs sorted by chromosome...171 6.3.6.2 Table 6.47. Main associated haplotypes sorted by chromosome...172
7. DISCUSSION ... 173
7.1 Method...176 7.1.1 Subjects ...176 7.1.2 Genotyping ...177 7.1.3 Statistical analysis ...178 7.2 Results...181 7.3 Conclusions ...189 7.4 Future prospects...190
[image:34.595.78.515.70.744.2]Index of tables
2.CURRENT KNOWLEDGE ABOUT MICROALBUMINURIA... 4
Table 2. 1. Criteria to define microalbuminuria according to urine samples...6
Table 2. 2. Factors associated to the prevalence or the incidence of microalbuminuria
In essential hypertension... ...14
3.GENETIC BASES OF MICROALBUMINURIA AND RELATED TRAITS... 20
Table 3. 1. Resume of candidate gene studies in HTN (I)...29
Table 3. 1. Resume of candidate gene studies in HTN (II)...30
Table 3. 1. Resume of candidate gene studies in HTN (III)...31
Table 3. 2. Resume of linkage studies in HTN (I)...34
Table 3. 2. Resume of linkage studies in HTN (II)...35
Table 3. 3. Resume of genome wide association studies in HTN ...37
Table 3. 4. Resume of candidate gene studies in DN (I)...45
Table 3. 4. Resume of candidate gene studies in DN (II)...46
Table 3. 4. Resume of candidate gene studies in DN (III)...47
Table 3. 4. Resume of candidate gene studies in DN (IV) ...48
Table 3. 5. Resume of linkage studies in DN (I) ...51
Table 3. 5. Resume of linkage studies in DN (II) ...52
Table 3. 5. Resume of linkage studies in DN (III) ...53
Table 3. 5. Resume of linkage studies in DN (IV)...54
Table 3. 5. Resume of linkage studies in DN (V)...55
Table 3. 5. Resume of linkage studies in DN (VI)...56
Table 3. 6. Resume of a great scale candidate gene study for DN (I)) ...59
Table 3. 6. Resume of genome wide association studies in DN (II). ...60
Table 3. 6. Resume of genome wide association studies in DN (III). ...61
5.MATERIALS AND METHODS ... 69
Table 5. 1. Non stringent and stringent wash buffer...91
Table 5. 2. Anti-streptavidin antibody ...91
Table 5. 3. MES stock buffer and array holding buffer ...92
Table 5. 4. Diagram of the comparison between different genetic models...102
Table 5. 5 Linear regression parameters...103
6.RESULTS... 107
Table 6.1. Main characteristics of the study population...109
Table 6.2. Result of the logistic regression for albuminuria...111
Table 6.3. Result of the linear regression analysis for UAE ...111
Table 6.4. Result of the linear regression analysis for UAE excluding macroalbuminurics...112
Table 6.5. Association with the main marker on chromosome 8 under different genotypic models...117
Table 6.6. Association with the main marker on chromosome 10 under different genotypic models...118
Table 6.7. Association with the main marker on chromosome 12 under different genotypic models...118
Table 6.8. Characteristics of the main associated SNPs with albuminuria...119
Table 6.9. Fisher test for the main associated SNPs. ...119
Table 6.10. Haplotype association analysis for markers in region 8p22 ...119
Table 6.11. Main characteristics of the other two markers which form the haplotype with the most associated
marker...120
Table 6.12. Haplotype association analysis for markers in region 10q11.2 ...121
Table 6.13. Haplotype association analysis for markers in region 12q24.23 ...122
Table 6.14. Association with the main marker on chromosome 8 under different genotypic models...124
Table 6.15. Association with the main marker on chromosome 10 under different genotypic models...124
Table 6.16. Association with the main marker on chromosome 12 under different genotypic models...124
Table 6.17. Haplotype association analysis for the markers on chromosome region 8p22 ...125
Table 6.18. Haplotype association analysis for the markers on chromosome region 10q11.2 ...126
Table 6.19. Haplotype association analysis for the markers on chromosome region 12q24.23 ...126
Table 6.20. Haplotype association analysis for the markers on chromosome region 2q32.2 ...128
Table 6.21. Haplotype association analysis for the markers on chromosome region 11p22 ...130
Table 6.22. Haplotype association analysis for the markers on chromosome region 16q23.1 ...131
Table 6.23. Haplotype association analysis for the markers on chromosome region 8p21.2 ...133
Table 6.24. Haplotype association analysis for the markers on chromosome region 5q23.2 ...134
Table 6.25. Haplotype association analysis for the markers on chromosome region 7p14.1 ...135
Table 6.26. Haplotype association analysis for microalbuminuria and markers on chromosome region 11p12
including age, sex, BMI, SBP, glucose, eGFR (MDRD) and number of drugs as clinical co-variables. ...140
Table 6.27. Haplotype association analysis for microalbuminuria and markers on chromosome region 5q23.2
including age, sex, BMI, SBP, glucose, eGFR (MDRD) and number of drugs as clinical co-variables. ...140
Table 6.28. Haplotype association analysis for microalbuminuria and markers on chromosome region 2q32.2
including age, sex, BMI, SBP, glucose, eGFR (MDRD) and number of drugs as clinical co-variables. ...141
Table 6.29. Haplotype association analysis for microalbuminuria and markers on chromosome region 5q23.2
including age, sex, BMI, SBP, glucose and eGFR (MDRD) as clinical co-variables. ...143
Table 6.30. Haplotype association analysis for microalbuminuria and markers on chromosome region 7p14.1
including age, sex, BMI, SBP, glucose and eGFR (MDRD) as clinical co-variables. ...144
Table 6.31. Haplotype association analysis for microalbuminuria and markers on chromosome region 7p14.2
Table 6.32. Haplotype association analysis for microalbuminuria and markers on chromosome region 8p21.2
including age, sex, BMI, SBP, glucose and eGFR (MDRD) as clinical co-variables. ...146
Table 6.33. Characteristics of the main associated SNPs with UAE...149
Table 6.34. Linear regression for the main associated SNPs with UAE...149
Table 6.35. Haplotype association analysis for the markers on chromosome region 8q12.1 and UAE ...149
Table 6.36. Haplotype association analysis for the markers on chromosome region 2p11.2 and UAE ...151
Table 6.37. Haplotype association analysis for the markers on chromosome region 9p22.2 and UAE ...153
Table 6.38. Haplotype association analysis for the markers on chromosome region 8q12.1 and UAE after
excluding patients with UAE≥300mg/day. ...156
Table 6.39. Haplotype association analysis for the markers on chromosome region 3q27.1 and UAE after
excluding patients with UAE≥300mg/day. ...157
Table 6.40. Association between one haplotype which include the most associated marker on chromosome
region 18q23 with UAE including age, sex, BMI, SBP, glucose, eGFR by MDRD and number of drugs as
co-variables...162
Table 6.41. Association between one haplotype which include the significantly associated marker on
chromosome region 9p22.2 with UAE including age, sex, BMI, SBP, glucose, eGFR by MDRD and treatment
as co-variables...163
Table 6.42. Association between one haplotype which include the associated marker on chromosome region
12p13.2 with UAE including age, sex, BMI, SBP, glucose, eGFR (MDRD) and number of drugs as
co-variables...165
Table 6.43. Association between the haplotype which include the most associated marker on chromosome
region 8q12.1 with UAE including age, sex, BMI, SBP, glucose and eGFR (MDRD) as clinical
co-variables...167
Table 6.44. Association between the haplotype which include the most associated marker on chromosome
region 2p11.2 with UAE including age, sex, BMI, SBP, glucose and eGFR (MDRD) as clinical
co-variables...167
Table 6.45. Haplotype for the markers on chromosome region 4q28.3 and UAE after excluding subjects
with macroalbuminuria (UAE≥300mg/day) adjusted for age, sex, BMI, SBP, glucose, eGFR (MDRD) and
NºDrugs as co-variables. ...169
Table 6.46. Main associated haplotypes sorted by chromosome...171
Index of figures
2.CURRENT KNOWLEDGE ABOUT MICROALBUMINURIA... 4
Figure 2. 1. Natural history of microalbuminuria in hypertension. ...15
5.MATERIALS AND METHODS ... 69
Figure 5. 1. Outline of the assay steps for the mapping assay Nsp-I...76
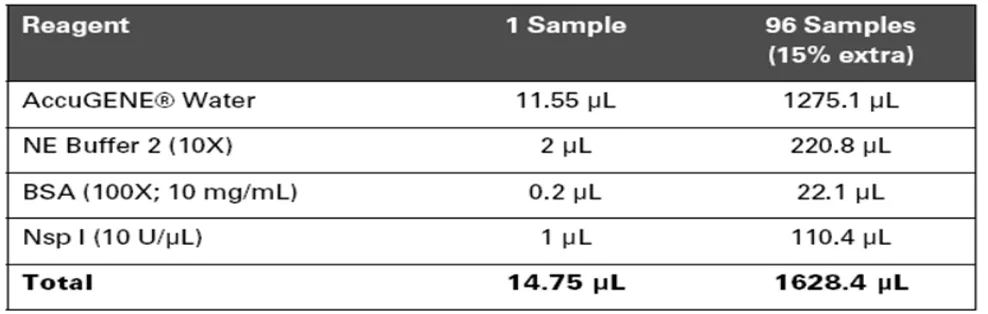
Figure 5. 2. Nsp I digestion master mix...77
Figure 5. 3. Total volume for each well ...78
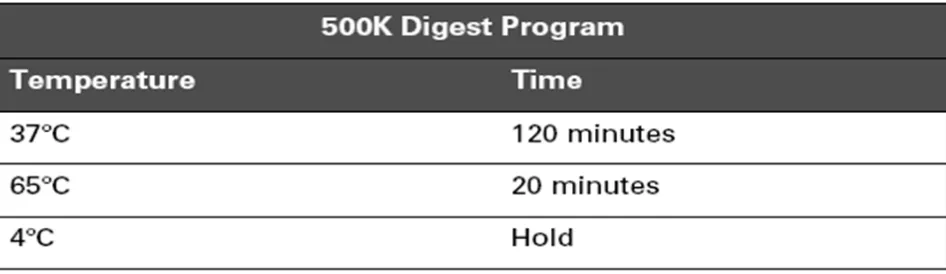
Figure 5. 4. 500K digest program...78
Figure 5. 5 Nsp I ligation master mix...79
Figure 5. 6. Resume of the volumes ...79
Figure 5.7. 500K ligate program...80
Figure 5.8. Resume of the volumes. ...80
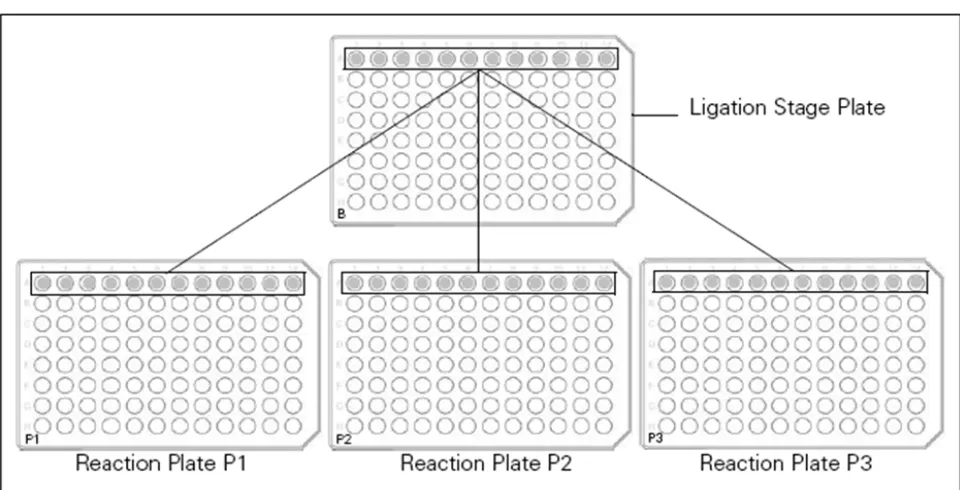
Figure 5.9. Transferring equal aliquots of diluted, ligated samples to three reaction plates...81
Figure 5.10. PCR master mix...82
Figure 5.11. 500K PCR thermal cycler program for the GeneAmp® PCR System 9700...82
Figure 5.12. Example of PCR products runs on 2% TBE agarose gel at 120V for 1 hour...83
Figure 5.13. Pooling PCR products onto the Clean-Up Plate ...84
Figure 5.14. Loading optical plates with purified sample...86
Figure 5.15. Dilution recipes for fragmentation reagent concentrations of 2 and 3 U/µL ...87
Figure 5.16. 500K fragment program. ...88
Figure 5.17.Typical example of fragmented PCR products runs on 4% TBE agarose gel at 120V. ...88
Figure 5.18. Labelling master mix ...89
Figure 5.19. 500K label program...89
Figure 5.20. Hybridization master mix...90
Figure 5.21. 500K Hyb program...90
Figure 5.22. Applying Tough-Spots® to the array cartridge...91
Figure 5.23. Stain buffer...92
Figure 5.24. SAPE solution mix ...93
Figure 5.25. Antibody solution mix ...93
Figure 5.26. Array holding buffer...93
Figure 5.27. FS-450 fluidics protocol - Antibody amplification for mapping targets ...94
Figure 5.28. Data analysis workflow for GeneChip® Human Mapping 250K arrays...95
Figure 5.29. Dynamic model mapping algorithm report metrics...96
Figure 5.30. GeneChip® Mapping 500K assay overview ...97
[image:40.595.104.509.174.760.2]Figure 5.31. HapMap Phase II coverage of the Mapping 500K array Set...99
Figure 5.32. Power for the test of genotypic association as a function of sample size at different genotype
Figure 5.33. Power for genotypic and allelic tests...105
6.RESULTS... 107
Figure 6.1. Scatter plot for the relationship between pairs of variables...110
Figure 6.2. Bars diagram of the SNP call rate for each chromosome...114
Figure 6.3. Multidimensional scaling plot for the IBS pairwise distances adjusted for the case-control status. 115
Figure 6.4. Q-Q Plot for the observed and expected p-values. a) Unadjusted and b) Adjusted for genomic
control ...116
Figure 6.5. Manhattan plot for the main association analysis with albuminuria and cluster plots of the main
associated markers...118
Figure 6.6. Cluster plots for the other two markers which form the haplotype with the most associated
marker...120
Figure 6.7. LD map with haploblocks for the region ± 200kb of the hit on chromosome 8 (LD is shown as
D'/LOD with the D' values) ...120
Figure 6.8. LD of the associated region on chromosome 10 ...122
Figure 6.9. LD of the associated region on chromosome 12 cytoband q24.23...123
Figure 6.10. Q-Q plot for the observed and expected p-values (unadjusted) for the association with
microalbuminuria...123
Figure 6.11. Manhattan plot for the association analysis with microalbuminuria ...125
Figure 6.12. Manhattan plot for the association analysis with albuminuria including age, sex, BMI, SBP,
glucose, eGFR (MDRD) and number of drugs as co-variables ...128
Figure 6.13. LD of the associated region on chromosome 2 ...129
Figure 6.14. LD of the associated region on chromosome 11 ...130
Figure 6.15. LD of the associated region on chromosome 16 ...131
Figure 6.16. Manhattan plot for the association analysis with albuminuria including age, sex, BMI, SBP,
glucose, and eGFR (MDRD) as co-variables...132
Figure 6.17. LD of the associated region on chromosome 8 ...134
Figure 6.18. LD of the associated region on chromosome 5 ...135
Figure 6.19. LD of the associated region on chromosome 7 ...136
Figure 6.20. Manhattan plot for the association analysis with microalbuminuria including age, sex, BMI,
SBP, glucose, eGFR (MDRD) and number of drugs as clinical co-variables ...137
Figure 6.21. LD of the associated region on chromosome 8 ...138
Figure 6.22. LD of the associated region on chromosome 2 ...139
Figure 6.23. Manhattan plot for the association analysis with microalbuminuria including age, sex, BMI,
SBP, glucose, and eGFR (MDRD) as clinical co-variables...142
Figure 6.24. LD of the associated region on chromosome 7 ...145
Figure 6.25. Q-Q plot for the observed and expected p-values (adjusted for GC) for the association analysis
with UAE ...147
Figure 6.26. Manhattan plot for the association analysis with UAE ...148
Figure 6.28 LD of the associated region on chromosome 2 ...152
Figure 6.29. Q-Q plot for the association analysis with UAE excluding patients with macroalbuminuria
(UAE≥300mg/day).. ...154
Figure 6.30. Manhattan plot for the association analysis with UAE excluding subjects with macroalbuminuria
(UAE≥300mg/day) ...155
Figure 6.31. LD of the associated region on chromosome 3 ...157
Figure 6.32. LD of the associated region on chromosome 12 ...158
Figure 6.33. LD of the associated region on chromosome 4 ...159
Figure 6.34. Manhattan plot for the association analysis for UAE adjusted for age, sex, BMI, SBP, glucose,
eGFR (MDRD) and number of drugs. ...160
Figure 6.35. LD of the associated region on chromosome 18 ...161
Figure 6.36. LD of the associated region on chromosome 9 ...163
Figure 6.37. LD of the associated region on chromosome 12 ...164
Figure 6.38. Manhattan plot for the association analysis with UAE including age, sex, BMI, SBP, glucose and
eGFR (MDRD) as co-variables.. ...166
Figure 6.39. Manhattan plot for the association analysis with UAE excluding subjects with macroalbuminuria
(UAE≥300 mg/day) adjusted for age, sex, BMI, SBP, glucose, eGFR (MDRD) and NDRUGS.. ...168
Figure 6.40. Manhattan plot for the association analysis with UAE excluding subjects with macroalbuminuria
1.
BACKGROUND
Cardiovascular diseases and essential hypertension are the leading causes of mortality and
morbidity in developed countries including Spain (http://www.isciii.es/htdocs/centros/epidemiologia/
epi_enfcardiovasculares.jsp).
Lifestyle modifications continue being the main strategy in order to prevent them. However it is
important to know more about the complex physiopathology of this kind of diseases for both, the
development of new effective drugs and the identification of those subjects prone to manifest the
disease or related traits who would need a more aggressive treatment. Undoubtedly, genetic
factors play an important role in their origin. From the initial studies in candidate gene we have
gone to the study of functional pathways in order to have a wide vision of the complex
physiopathology of the cardiovascular diseases. Subtle modifications in several genes,
environmental factors and the interaction between all of them may be the responsible for the
development of complex diseases1 . Therefore the study of genetic polymorphisms is an important
tool to try to unravel the genetic susceptibility of the cardiovascular diseases with complex
heritability patterns2. Nowadays the development of new microarrays, which are able to interrogate
hundreds of thousands of single nucleotide polymorphisms (SNPs), and powerful tools for the
analysis of the huge amount of data obtained with them, have given us the possibility of study the
2.
CURRENT KNOWLEDGE ABOUT MICROALBUMINURIA
2.1.
Definition and clinical relevance
There are large amount of information for microalbuminuria as a prognostic marker for
cardiovascular and/or renal risk in diabetic and non-diabetic subjects3-13. Although determinants
of subtle increases in urinary albumin excretion (UAE) and its progression remain poorly
understood, microalbuminuria assessment is now recommended in a risk stratification strategy
for hypertension management14, 15. Moreover, the potential of microalbuminuria as an
intermediate endpoint during antihypertensive treatment is still unclear.
Microalbuminuria is defined as UAE from 30-300 mg/24 hour or equivalent amounts using
timed-overnight or spot urine samples. The definition comes from studies which have established its
value as a marker of risk to develop nephropathy in diabetic subjects. When the potential
prognostic value of microalbuminuria on cardiovascular disease was being assessed in both
diabetic and non-diabetic populations, the threshold value pointing to an increment of risk was
largely below the UAE value of 30 mg/24 hour regardless of the population studied16 . Dammsgard5
in an elderly population demonstrated that subjects with timed-overnight UAE >7.5 mg/min had a
higher mortality rate than those with lower values. Borch-Johnsen8 in a population-based cohort of
2,085 consecutive subjects, the relative risk of ischemic heart disease associated with an spot
urine albumin/creatinine ratio of only >0.65 mg/mmol, was 2.3 when adjusted for other risk factors,
Likewise, Jager in the Hoorn study9 , a population-based cohort aged 50 to 75 years followed
prospectively for 5 years, albumin/creatinine ratio >2.0 mg/mmol in a spot urine was associated
with a 4-fold increase in cardiovascular mortality and about an 2-fold increase in all-cause
mortality. Furthermore, in a cohort of postmenopausal women living in Utrech10 , the cardiovascular
age-adjusted mortality rate for hypertensive women who were in the highest quintile of UAE was
4.3 times greater than that observed in women without detectable UAE. The highest quintile
corresponded to an albumin/creatinine ratio >2.41 mg/mmol. Finally, in the cohort of subjects
included in the HOPE study11 , compared with the lowest quartile of albumin/creatinine ratio the
relative risk of the primary end point in the fourth quartile, defined as albumin/creatinine ratio >1.62
mg/mmol, was 1.97.
Klausen et a17 have delved deeply at this point, not only in looking for a threshold for risk, but also
in calculating risk along a wide range of UAE. They have observed that hypertensives with a
timed-overnight UAE above 5 mg/min have an increased risk for total mortality and coronary heart
disease. The risk of coronary heart disease and mortality significantly increases 70% and 50%
respectively when the UAE is between 5 to 10 mg/min, and 100% for both when the UAE is higher
influence the presence of microalbuminuria: age, blood pressure levels, smoking, body mass
index, diabetes, creatinine clearance or total or HDL-cholesterol. Even though UAE was only
measured once, it was done in timed overnight samples which are among the most reproducible.
Two recently published studies have also shed light on our knowledge of microalbuminuria in
hypertension populations and how it can be managed18 . In one study by our group, subjects with
an initial UAE level in the high normal range, from 15-29 mg/24hour, have an increased risk of
progressing towards microalbuminuria. The development of microalbuminuria is linked to
insufficient BP control and to a progressive increment of glucose values. Thus, appropriate
intervention may reduce the progressive increment of UAE. Ibsen et al19 in the LIFE study find that
baseline and in-treatment levels of albuminuria are powerful predictors for subsequent
cardiovascularmorbidity and mortality. Reduction in albuminuria during treatmenttranslates into a
reduction in cardiovascular events. Although the units by which UAE have been expressed differ
among the three studies, the 5 mg/min from Klausen17 is close to the 15 mg/24 hour from our study
in which there was an increased risk for UAE to increase over time, and to the 1 mg/mmol of
creatinine in a morning urine spot corresponding to the second strata of risk in the Ibsen study19.
Until studies specifically designed to answer whether or not UAE may be used as an intermediate
endpoint to monitor the success of a reduction in cardiovascular and renal risk are available such
in diabetes20 , how can this new information influence daily clinical practice?. The three studies
pointed to monitoring of albuminuria asan integrated part of the management of hypertension.
In both diabetic and non-diabetic subjects, the continuous relationship between UAE and
cardiovascular (CV) risk raises the question of the value of UAE where there is a substantial
increment of risk and, consequently, where intervention is justified. Furthermore, what should be
the UAE goal during intervention?. Defining the risk of microalbuminuria at an early stage, such as
at the threshold established in the Klausen study, would be adequate for guiding therapies aimed
to preventing progression of UAE. If albuminuria is not decreased by a patient’s current
antihypertensiveand/or other treatment, further intervention directed toward bloodpressure control
and other modifiable risks should be considered.
Finally, Klausen et al propose in the title of their article “a new definition of microalbuminuria in hypertensive subjects”. The use of the term microalbuminuria as defined by different values
according to the disease considered, eg, diabetes or hypertension, diseases which are closely
linked to each other may be misleading. The use of UAE, avoiding categorization with a given
threshold, should be encouraged.
The assessment of subtle increases in UAE is a powerful way to identify those at risk for multiple
cardiovascular risk factor intervention. Changes in UAE seem to run in parallel to cardiovascular
protection against hypertension-induced morbidity and mortality. Although some pieces of
information remain to be found, UAE has come of age in the arena of hypertension.
The next table summarizes the current criteria to define microalbuminuria according to urine
samples.
Table 2. 1. Criteria to define microalbuminuria according to urine samples.
Urine Sample
Units
Spot
Timed-overnight
24 hour
mg/24 hour
30-299
mg/min
20-199
mg/mmol Cr
3-29
2.2.
Physiopathology of microalbuminuria
Whether UAE in hypertension is mainly from glomerular or tubular origin has been studied by
searching simultaneous urinary excretion of albumin and enzymes present in tubular cells, mainly
beta-2-microglobulin and n-acetyl-glucosaminidase, which move to urine when tubular dysfunction
is present. As suggested by the finding of normal urinary excretion of beta-2-microglobulin in
normoalbuminurics and microalbuminurics with essential hypertension21 , microalbuminuria in
essential hypertensive patients is probably the consequence of an increased transglomerular
passage of albumin rather than the result of a decrease in the proximal tubule reabsorption of
albumin.
Increased transglomerular passage of albumin, derived from the glomerular structures in essential
hypertensive patients, may result from hemodynamic-mediated mechanisms and/or functional or
structural impairment of the glomerular barrier.
2.2.1.
Hyperfiltration
Hyperfiltration and an increased filtration fraction have been regarded as the forerunners of haemodynamic abnormalities that may lead to the development of renal damage in primary
hypertension. The presence of hyperfiltration has been considered an early sign of organ damage,
and an association between an increased glomerular filtration rate (GFR) and microalbuminuria
has been reported by several authors22, 23 . There have been conflicting results, however, on the
possible role of hyperfiltration and reports of either, increased24 , unchanged25, or decreased26
creatinine clearance (CC) have been reported in microalbuminuric hypertensives. Minram did not
find differences in basal GFR, effective plasma flow and filtration fraction between essential
hypertensive patients with or without microalbuminuria25 . Furthermore, this author observed that in
a group of normal-weight, essential hypertensive subjects with hyperfiltration, urinary albumin
excretion was similar to that observed in a group with normofiltration27 . Probably the discrepancies
found in these studies have reflected the unpredictable mix of functional and structural alterations
leading to microalbuminuria in hypertensive patients.
Hyperfiltration, which increases glomerular pressure, is probably mediated by progressive loss of
functioning nephrons and/or from abnormal transmission of systemic hypertension to the
glomerulus through a disturbance in glomerular auto-regulation. Systemic blood pressure
elevations are usually accompanied by increases in pre-glomerular vascular resistance preventing
the increased systemic blood pressure from being transmitted to the glomeruli. The increased
glomerular pressure would contribute to increase UAE, glomerular injury and progression of
afferent arterioles are present in subsets of hypertensive subjects, such as blacks, CRF, diabetics
and the elderly. The prevalence of microalbuminuria in these subgroups, that have the highest risk
of developing renal insufficiency, was higher than that observed in essential hypertensives. Thus,
glomerular hypertension contributes to the appearance of microalbuminuria and could be a marker
of risk for developing renal insufficiency among patients with essential hypertension.
2.2.2.
Glomerular basal membrane abnormalities
Presence of glomerular basal membrane abnormalities as the main mechanism underlying the presence of microalbuminuria in hypertension has been suggested by several authors. Other
studies, however, did not support this point of view. Urinary transferrin excretion (UTE), a more
anionic and higher size molecule than the albumin molecule, was studied simultaneously to the
UAE in hypertension. In contrast to observations in diabetic subjects, in which a correlation
between UTE and UAE was present28 , no relationship between UTE and UAE was observed in
hypertensives, and the impact of blood pressure changes in UTE was negligible29 .
2.2.3.
Endothelial dysfunction
Microalbuminuria reflect the kidney expression of a more generalized state of endothelial
dysfunction30 . Higher levels of circulating von Willebrand factor antigen, a glycoprotein released in
greater concentrations when endothelial cells are damaged, were found in microalbuminuric
compared to well-matched normoalbuminuric patients with essential hypertension. A direct
correlation between von Willebrand factor antigen and albumin excretion rate was described,
supporting the hypothesis that albuminuria reflects systemic dysfunction of the vascular
endothelium26.
2.2.4.
Nephrosclerosis
Nephrosclerosis needs to be mentioned when abnormal UAE in essential hypertension is the
issue. Glomerular and vascular structural alterations coexist with altered functional mechanisms
particularly in the more severe cases and in those with long-standing disease, but in most patients
with primary hypertension and microalbuminuria no specific pathologic kidney changes can be
found31 . Studies of the natural history of nephrosclerosis in essential hypertension are lacking, due
to the limitation of carrying out renal biopsies on these patients. Data from experimental rat
models, such as streptozotocin-induced diabetes and 5/6 renal ablation, induces albuminuria early