Essays on the Economics of
Development, Education and
Violence
María Paula Gerardino Gutiérrez
TESI DOCTORAL UPF / ANY 2014
DIRECTOR DE LA TESI
Acknowledgements
First, I want to thank my advisor Libertad González for her support, guidance
and encouragement during my PhD. Her patience, counsel and knowledge have
been truly invaluable. I also owe a lot to Alessandro Tarozzi, Giacomo De Giorgi
and Stephan Litschig. They have been great mentors during different stages of
my PhD. Without their support, things would have been a lot more difficult. I
admire all of them not only as economists but also as human beings. I would like
tothankAdriana Camacho for being a great co-author and friend. I am indebted
to Paula Bustos, Gabrielle Fack, Marta Reynal-Querol, Antonio Ciccone,
Gianmarco León, Maia Güell, Larbi Alaoui and Christian Fons-Rosen for their
help and suggestions during the realization of this thesis. Special thanks go to
Marta Araque and Laura Agusti, who have always helped me with everything
and have made things easierduring these years. Thanks for having a place for me
inyour office.
ThanksenormouslytoMona,Ignasi,Lina,PetriandPontiforbeingmyfamilyin
Barcelona.PompeugavemenotjustaPhDdegreebutalsothreebrothers.Thanksto
Oriol,KizandCrisforallyourhelpandsupportandforthegoodtimeswehadinthe
office20.143.Michaelyouarealways inmythoughts.ThankstoTomand Felipefor
always beingthere. Thanks loadsto Paulafor beinga wonderfulfriend. During this
time, I have been fortunate to meet several people who have also become friends:
Gene, Felipe, Miguel, Jose, Ciccio, Fer, Pablo, Flo, Bruno, Ambro, Giulia, Laura,
Tanya,Elisa, Marc,Emma,AndreaT,Thomaz, Ferayand Diego.Thank youallfor
thegoodandbadtimeswehadtogetherinsideandoutsideUPF.Ialsowanttothank
allmyfellowPhDstudentsatUPF.
Last but not least, I want to thank my family. Thanks Mom, Dad, Libar, Fati,
Marti, Mati and Nani fortheirunconditionallove.ForthemandbecauseofthemIam
able to present this work. Mom and Dad, thanks for being such as great example.
Finally, the greatest thanks go to my husband, Da. Tesoro, no words can describe
Abstract
This thesis investigates various aspects of economic development. In the first chap-ter, I study the impact of violence on human capital investments, focusing mainly on the relationship between male-biased violence and the educational gender gap in Colombia. I find that boys are less likely to be enrolled at secondary school age relative to girls when male-biased violence is high. In the second chapter, I explore the impact of violence on fertility choices. In particular, I study how gender-biased violence in Colombia affects the number and the gender of actual and desired chil-dren demanded by women. I find that women living in areas that experience faster increases in male-biased violence have and want fewer children. Furthermore, they show a lower preference for boys. Finally, in the third chapter I explore the im-pact of public procurement audits on compliance with procurement regulation, cost and performance in Chile. The results show that the audits affect the public enti-ties’ subsequent procurement practices by a temporary shift toward less transparent modalities of procurement.
Resum
Foreword
My doctoral thesis is a collection of three essays that study various aspects of
eco-nomic development, with a special emphasis on Latin America. The first two
chap-ters analyze some of the determinants of human capital investments and other family
decisions in developing countries. In the first chapter, I study the impact of violence
on the educational gender gap. In the last few decades, Latin America has
experienced a substantial increase in violence related to gang/organized crime, fueled
by the expansion of narcotraffic. This paper analyzes the impact of this type of
violence on human capital investment decisions. I focus on the relationship between
the male versus female homicide rate differential and the gender gap in education.
Using data from Colombia and exploiting the temporal and spatial variation in
violence between 1985 and 2005, I find that boys are less likely to be enrolled at
secondary school age relative to girls when male-biased violence is high. An increase
of one standard deviation in violence leads to a 1.1 percentage point enlargement of
the gender gap in enrolment, in disfavor of boys. This effect is important since the
gender gap in enrolment in secondary school in Colombia is estimated to be 8
percentage points, in favor of girls. I find a similar effect on years of school completed.
Estimates are larger in families with lower levels of education and robust to the
inclusion of municipality-year fixed effects and household fixed effects. In addition,
results are not driven by migration or coca production. The evidence in this paper
suggests that violence has an impact on investments in education through two main
chan-nels: changes in the opportunity cost of schooling, and changes in life
expectancy and perceived safety.
for boys.
Table of Contents
List of Figures ... xiv
List of Tables ... xvi
1 The Effect of Violence on the Educational Gender Gap ... 1
1.1 Introduction ... 1
1.2 Historical and Institutional Context ... 6
1.2.1 Violence in Colombia ... 6
1.2.2 Education in Colombia ... 8
1.3 Description of the Data ... 9
1.3.1 Individual Data ... 9
1.3.2 Homicide Data ... 10
1.3.3 Coca Production and Household Member Characteristic ... 11
1.4 Conceptual Framework ... 11
1.5 Empirical Strategy and Main Results ... 12
1.5.1 Baseline Specification ... 13
1.5.2 Baseline Results ... 16
1.6 Robustness Checks ... 19
1.6.1 Year–Municipality Fixed Effects ... 19
1.6.2 Intra-Household Estimations ... 21
1.6.3 Coca Production ... 23
1.6.4 Male/Female Survival Ratio ... 24
1.6.5 Migration ... 26
1.7 Additional Specifications ... 27
1.7.1 Heterogeneous Effects of Violence ... 28
1.7.2 Employment Outcomes ... 29
1.7.3 Differences in Mortality Unrelated to Homicides ... 30
1.7.4 Other Educational Outcomes: Years of School Completed ... 31
1.8 Conclusions ... 34
References ... 36
Appendix A1 ... 59
Appendix B1 ... 69
B1.1 A simple model : The Returns to Education versus the Returns to Violence ... 69
B1.2 Differences across Genders ... 71
2 The Effect of Violence on Fertility Decisions and the Sex Composition
Preference of the Offspring ... 73
2.1 Introduction ... 73
2.2 Historical Context ... 77
2.2.1 Violence in Colombia ... 77
2.3 Data ... 79
2.3.1 Individual and Household Data ... 79
2.3.2 Violence Data ... 80
2.4 Empirical Strategy ... 82
2.4.1 Baseline Specification: Number of children and desired number of children ... 82
2.5 Baseline Results ... 85
2.6 Gender Preferences for Children ... 87
2.7 Conclusions and Future Work ... 89
References ... 90
3 Monitoring Public Procurement ... 113
3.1 Introduction ... 113
3.2 Institutional Background, Procurement Modalities, and Audit Selection Process ... 117
3.2.1 Public Procurement in Chile ... 117
3.2.2 Procurement Modalities ... 117
3.2.3 Audit Selection Process ... 119
3.3 Data ... 120
3.3.1 Auctions ... 120
3.3.2 Purchase Orders ... 120
3.3.3 Audits ... 121
3.3.4 Timing of Audits ... 121
3.4 Empirical Strategy ... 122
3.4.1 Identification ... 122
3.4.2 Estimation Approach ... 124
3.5 Estimation Results ... 125
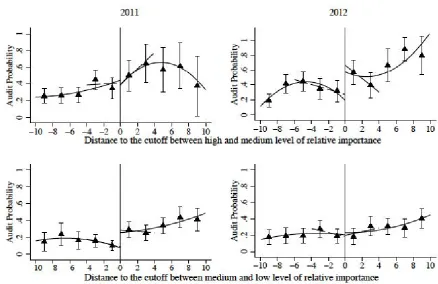
3.5.1 First Stage Results ... 125
3.5.2 Internal Validity Checks ... 126
3.5.3 Results on Impacts of the Audits ... 126
3.6 Conclusions ... 129
References ... 130
List of Figures
1.1 Average Annual Violent Death Rates per 100,000 (2004–2009) ... 40
1.2 Homicide Rate per 100,000 Inhabitants in Colombia ... 41
1.3 Coca Leaf Production in Colombia ... 42
1.4 Variation in the Male versus Female Homicide Rate Differential Across Colombia ... 43
A1.1 Enrolment Rates in Secondary School and Homicide Rates in Colombia .... 59
A1.2 Ratio Male/Female Homicides ... 60
2.1 Sex Ratios Comparison by country ... 94
2.2 Sex Ratios Comparison in 1993 by level of violence ... 95
2.3 Homicide Rate per 100,000 Inhabitants in Colombia ... 96
3.1 First stage estimates for 2011 and 2012 ... 132
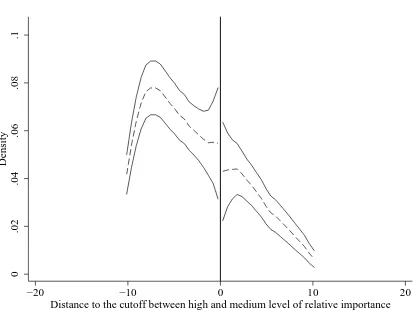
3.2 Density test, Estimation sample ... 133
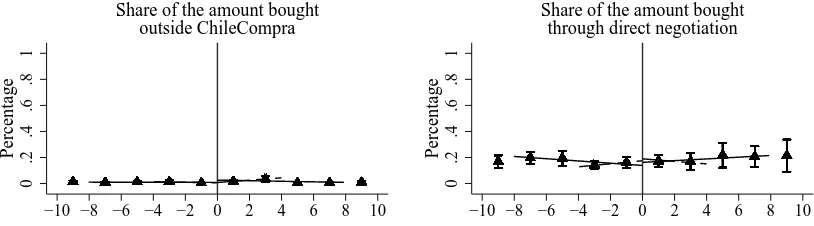
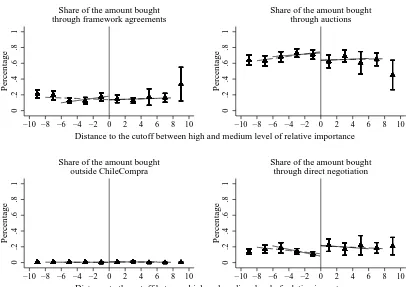
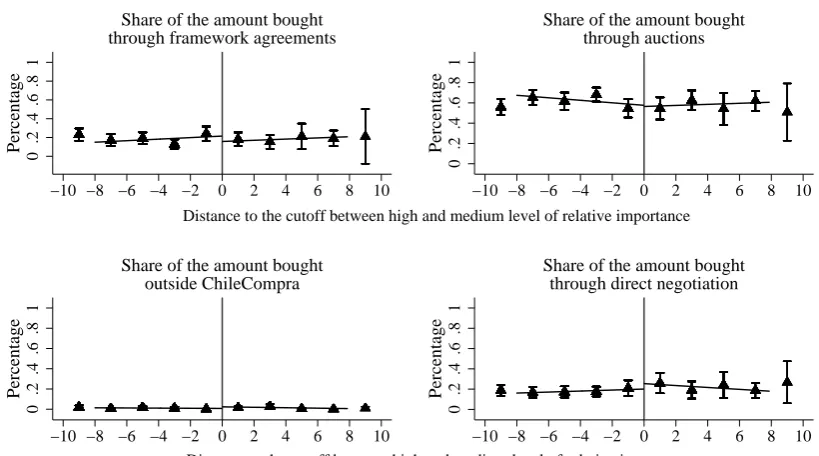
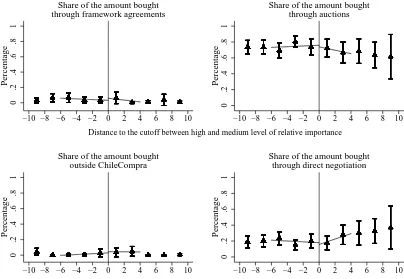
3.3 Impact on the share of the amount by modality of purchase in 2010 and 2011 ... 134
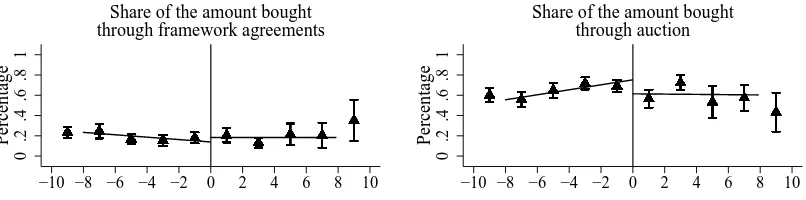
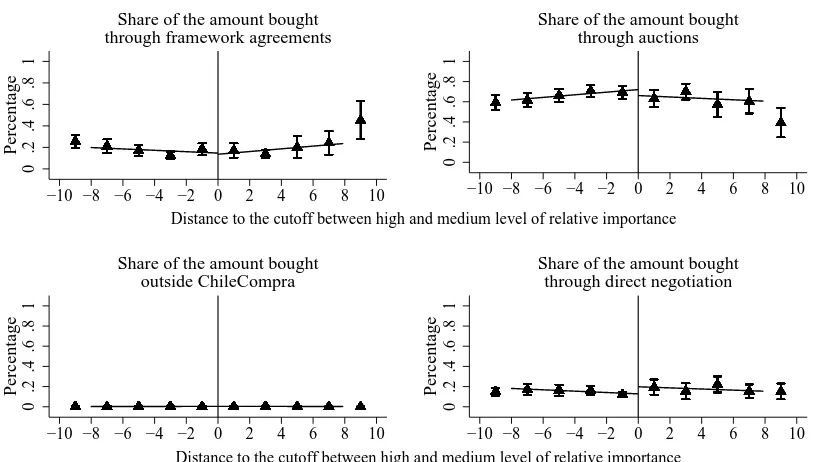
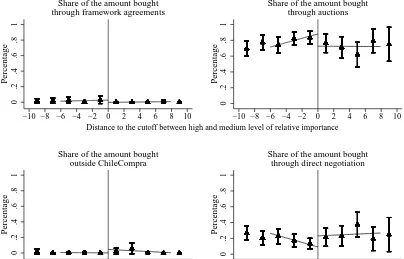
3.4 Impact on the share of the amount by modality of purchase in 2012 ... 135
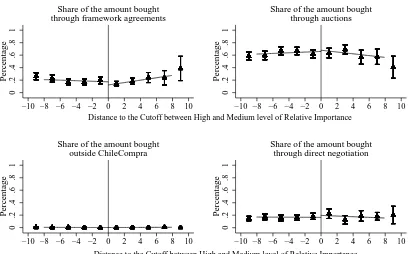
3.5 Impact on the share of the amount by modality of purchase in 2012, Pre-audit period ... 136
3.6 Impact on the share of the amount by modality of purchase in 2012, During-audit period ... 137
3.7 Impact on the share of the amount by modality of purchase in 2012, Post-audit period ... 138
3.8 Impact on the share of the amount by modality of purchase in 2013 ... 139
3.9 Impact on the share of the amount spent on construction by modality of purchase in 2010 and 2011 ... 140
3.10 Impact on the share of the amount spent on construction by modality of purchase in 2012 ... 141
3.11 Impact on the share of the amount by type of direct negotiation in 2010 and 2011 ... 142
3.12 Impact on the share of the amount by type of direct negotiation in 2012 ... 143
A3.1 Density test, Full sample ... 156
A3.2 Total amount of purchases and number of transactions by month in 2011 . 157 A3.3 Total amount of purchases and number of transactions by month in 2012 . 158 A3.4 Share of the amount by modality and month in 2011 ... 159
A3.5 Share of the amount by modality and month in 2012 ... 160
A3.7 Impact on the share of the amount by modality of purchase in
2011 (using 2011 sample) ... 162 A3.8 Impact on the share of the amount by modality of purchase in
List of Tables
1.1 Education Levels in Colombia ... 44
1.2 Descriptive Statistics ... 45
1.3 Descriptive Statistics (Enrolment by school age and gender) ... 46
1.4 Homicide Victim Characteristics ... 47
1.5 Enrolment by School Age (Total Sample 1985–2005) ... 48
1.6 Municipality Year Fixed-Effects (Sample 1985–2005) ... 49
1.7 Family Fixed-Effects by Education Level ... 50
1.8 Municipalities with Coca Production ... 51
1.9 Survival Ratio ... 52
1.10 Probability of Migration ... 53
1.11 Initial Sample versus Non-Migrant Sample ... 54
1.12 Heterogeneous Effects of Violence by Level of Education of the Head of the Household ... 55
1.13 Probability of Employment ... 56
1.14 Mortality Unrelated to Homicides ... 57
1.15 Years of School Completed ... 58
A1.1 School Enrolment of Children of Secondary School Age ... 61
A1.2 Municipality-Year Fixed Effects ... 63
A1.3 Municipality-Gender Fixed Effects ... 65
A1.4 Number of Children per Family ... 65
A1.5 Families with Two Children ... 66
A1.6 Municipalities with No Coca Production ... 67
A1.7 Selective Migration of Boys ... 67
A1.8 Heterogeneous Effect of Violence by Level of Education of the Mother ... 68
2.1 Summary statistics ... 97
2.2 Summary statistics: Fertility Characteristics ... 98
2.3 Homicide victim characteristics ... 99
2.4 Effect of violence on the number of children born ... 100
2.5 Effect of violence on the number of children born by age. Full sample ... 101
2.6 Effect of violence on the number of children born by age. Non-migrant sample ... 102
2.7 Effect of violence on the ideal number of children ... 103
2.8 Effect of violence on the ideal difference boys-girls ... 104
2.10 Multinomial logit estimates of the effect of violence on the gender
preferences for children (Marginal effects) ... 106 2.11 Multinomial logit estimates of the effect of violence on the gender
preferences for children (Marginal effects). Non-migrant sample ... 107 2.12 Effect of violence on the probability of being indifferent between the
gender of the children ... 108 2.13 Effect of violence on the difference between the number of boys and
girls born ... 109 A2.1 Effect of violence on the ideal number of children by age. Full Sample .... 110 A2.2 Effect of violence on the ideal number of children by age. Non-Migrant Sample ... 111
3.1 Summary statistics, Estimation sample ... 144 3.2 First stage estimates for 2011 and 2012 ... 145
3.3 Impact on the share of the amount by modality of purchase in 2010
and 2011 ... 146
3.4 Impact on the share of the amount by modality of purchase in 2012 ... 147
3.5 Impact on the share of the amount by modality of purchase in 2012,
Pre-audit period ... 148
3.6 Impact on the share of the amount by modality of purchase in 2012,
During-audit period ... 149
3.7 Impact on the share of the amount by modality of purchase in 2012,
Post-audit period ... 150
3.8 Impact on the share of the amount by modality of purchase in 2013 ... 151
3.9 Impact on the distribution of the share of the amount spent on
construction by modality of purchase in 2010 and 2011 ... 152 3.10 Impact on the distribution of the share of the amount spent on
construction by modality of purchase in 2012 ... 153 3.11 Impact on the percentage of the amount spent by type of direct
negotiation in 2010-2011 ... 154 3.12 Impact on the percentage of the amount spent by type of direct
negotiation in 2012 ... 155 A3.1 Summary statistics, Full sample ... 164 A3.2 Impact on the share of the amount by modality of purchase in 2009-2010
(using 2011 sample) ... 165 A3.3 Impact on the share of the amount by modality of purchase in 2011
(using 2011 sample) ... 166 A3.4 Impact on the share of the amount by modality of purchase in 2012
Chapter 1
The Effect of Violence on the
Educational Gender Gap
1.1 Introduction
Human capital investments have been shown to promote economic growth and de-velopment (Galor and Moav, 2004). On the other hand, there is a consensus among economists and policymakers that violence and crime negatively affect the quality of life of individuals (Heinemann and Verner, 2006; United Nations, 2011). As a result, studying how violence affects investments in education has compelling policy relevance. In this paper, I investigate the impact of violence on education, focus-ing on the relationship between the gender bias of violence and the education gap between boys and girls.
Violence and crime are a major concern in both developed and developing coun-tries. In particular, Latin America has the highest homicide rate in the world for ages 15–24 (United Nations, 2011), four times higher than the world average. The homicide rate for Latin American youth ages 10–29 is 36.4 per 100,000 inhabitants, compared to 17.6 in Africa, 11.0 in the United States, and 0.9 in the high-income countries of Europe. Moreover, the gender structure of violence is very unbalanced. Male homicides account for 90 percent of all homicide victims, compared to 81 per-cent in Africa and 73 perper-cent in Europe. This large share of male homicide victims has been linked to narcotraffic, organized crime and the proliferation of violent youth gangs (United Nations, 2011).
girls continue to lag behind those of boys, most Latin American countries have a “reverse” gender gap in education. Women are achieving nowadays higher average years of schooling than men (Duryea et al., 2007). To the best of my knowledge, this is the first paper to look at the extent to which male-biased violence has contributed to this gap. I consider a period of intense violence in Colombia that caused a large increase in the male versus female homicide rate differential, and analyze its
consequences on schooling.1 Using data on violence at the municipality level between
1983 and 2005, I find that municipalities that faced faster increases in violence experienced an enlargement of the gender gap in school enrolment, in disfavor of
boys. This is particularly the case for children of secondary school age.2
Research has found that the direct and indirect costs associated with investments in schooling might be exacerbated in a violent context. For example, in areas with high levels of violence, disruption of access routes and, more importantly, destruction of schools will increase the time and cost of going to school (Akbulut-Yuksel, 2009). Violence and crime may also affect the opportunity cost of going to school and the returns to education. Following Becker (1968), crime may be considered as an occupational choice or an investment opportunity. Individuals compare the payoffs and costs of crime versus the returns to investments in education and work (see
Lochner, 2004).3 In addition, recent research has shown that unexpected shocks to
life expectancy have a negative impact on an individual’s educational attainment by reducing expected returns to school (Jayachandran and Lleras-Muney, 2009; Oster et al., 2013). Looking at changes in life expectancy and in job opportunities, Evan et al. (2012) argue that some of the enlargement of the white/black gap in education in the United States is due to the decrease in the returns to schooling of black males after the arrival of crack markets and the subsequent large increase in murder rates. In this paper, I focus on the heterogenous effects of violence on education between boys and girls. Although there are different mechanisms through which violence can affect investments in education, such as school availability and school quality, many of these factors are likely to affect boys and girls similarly. I argue that male-biased
1During the 1990s, Colombia experienced a severe increase in homicides, with rates rising 159
percent between 1985 and 1994, from 36.7 to 95 per 100,000 inhabitants on average (Krug et al., 2002).
2In the empirical analysis, I mainly focus on children aged 11–17 (secondary school age). In
Colombia, primary school enrolment rates are very high and most of the school investment variation and changes in the opportunity cost of schooling happens at the secondary school age.
3Most of the literature on crime and education studies the effects of education on adult crime (
violence might affect enrolment decisions of boys relative to girls through two main channels. First, it increases the opportunity cost of attending school, since there is a higher demand for (male) workers in the violence sector. Second, it reduces the returns of attending school as life expectancy and perceived safety fall. I combine these two channels in a simple conceptual framework (based on Becker, 1962 and Ben-Porath, 1967) in which agents compare their expected returns to schooling with the direct and indirect costs associated with its acquisition. A family makes the decision of whether to enrol its child in school taking into consideration the returns to violence and schooling, and discounting the expected returns by the child’s life expectancy/perceived safety. As a result, families may decide to educate only some of their children (Behrman et al, 1982, 1990; Dahan and Gaviria, 2003). In this framework, when more men are targeted by violence (relative to women), fewer boys are predicted to go to school (relative to girls).
To empirically identify the effect of gender-biased violence on the gender gap in education, I use multiple years of census data with information on school en-rolment and family characteristics. I match this dataset with data on exposure to male-biased violence, proxied by the difference between male and female homicide rates in the municipality of residence. I exploit the time-municipality variation of male-biased violence. To address the potential endogeneity of violence arising from municipality and time characteristics, I include a full set of municipality fixed effects (that are allowed to vary by gender), time fixed effects, along with region-specific time trends. Furthermore, I control for time-varying municipality characteristics that may also affect enrolment decisions such as the population density, the income tax per capita, and the unemployment rate. To account for additional time-varying omitted variables across municipalities and unobserved heterogeneity across fami-lies in dimensions such as job opportunities, income and preferences for education, I evaluate the robustness of the results to the inclusion of municipality-year fixed effects and household fixed effects. To this end, I compare changes in the school-ing gender gap within municipalities and also within families that are affected by different levels of violence over time.
secondary school.4 This impact is larger in families with lower levels of education. I find that the negative effect of violence on the enrolment gender gap is roughly 1.5 times larger in families in which either the head of household or the mother has less than a primary school education. The differential effect of violence on education is significant not only for enrolment decisions but also for years of school completed. This implies that male-biased violence also has a long-term effect. Furthermore, the impact of violence on the gender gap is driven by the changes in the difference between male and female homicides and not by changes in other causes of mortality. When I use a measure of male-biased mortality that includes all causes of death other than homicides, the estimates suggest that differential mortality between genders by itself does not have an impact on schooling decisions conditional on gender.
Since violence may induce migration, positive or negative selection into migration could bias the results. To account for this possibility, I first compare migrant and non-migrant children. Second, I consider the potential migration of boys, which in turn may affect the proportion of boys versus girls in a municipality. I look at the effect of violence on the ratio of boys relative to girls in school age. In both cases, I find that selective migration is not biasing my estimates.
My dataset includes the two periods within the last four decades when the rate of homicides in Colombia increased the most. The first is associated with the con-solidation of the drug cartels due to the growth of the cocaine trade in the late 1980s and early 1990s. The second coincides with the consolidation of the guerrilla groups in the late 1990s. I also consider the potential effect of the increase in coca cultivation in Colombia during the late 1990s. Coca harvesting played an important role not only in fueling violent conflict, but also in bringing new job opportunities to the municipalities where coca is produced (Angrist and Kugler, 2008). I find that although coca production is associated with higher violence in Colombia, it is not a determinant of the broadening of the educational gender gap in violent regions.
This paper primarily relates to three strands of the literature: research looking at the determinants of human capital investments (since Becker, 1962; Berhrman et al., 1982, 1990), the effects of crime on education (see Hjalmarsson and Lochner, 2012; Evan et al., 2012), and the impact of civil war on schooling decisions. Al-though civil war has been identified as a deterrent for growth and development, more research is needed before conclusions can be drawn about the specific effects of war on individual and family welfare (Blattman and Miguel, 2010). Empirical
4The gender gap in enrolment in secondary school in Colombia is 8 percentage points, in disfavor
evidence at the micro-level suggests that violence has a negative impact on edu-cational attainment (Justino, 2011). For example, in Zimbabwe, children affected by civil war completed fewer years of school than children that were not affected (Alderman, Hoddinott and Kinsey, 2006). Similar results are found by Swee (2009) for Bosnia and Herzegovina and by León (2012) for Perú. Rodríguez and Sánchez (2012) find that armed attacks in Colombia made children more likely to drop out of school. These papers, however, do not consider the differential role played by boys and girls as victims and actors in violent conflicts.
Recent empirical research on the heterogeneous effects of conflict suggests that the effects of war-related destruction and civil war depend on gender and on the particular characteristics of each conflict. Shemyakina (2011), and Chamarbagwala and Moran (2011) examine the impact of the civil war on education in Tajikistan and in Guatemala, respectively. These papers use as a measure of civil conflict household damage dwelling reports in Tajikistan and the number of human rights violations in Guatemala. In contrast to the results I find in my paper, the authors find that girls are more adversely affected by conflict. They argue that parents may keep their girls at home in order to protect them from sexual assaults or harassment on their way to school. Furthermore, if the conflict causes a negative income shock and the returns to education for boys are larger than for girls, families that are income constrained may invest just in their boys’ education. In contrast, Valente (2013) finds that in Nepal, an increase in the intensity of Maoist activity is associated with an increase in the school attainment of girls. This impact is mainly attributed to the strong Maoist ideological agenda of reducing inequality. Looking at children as participants in conflict, two studies explore the effect of random abductions of children in Uganda on educational outcomes and find that boys are the ones affected (Blattman and Annan (2010) and Annan et al. (2009)). This finding coincides with Akresh and De Walque’s (2008) study on Rwanda, in which they show that boys from non-poor families were negatively affected by the conflict. They attribute this finding to wealthy families being targeted during the genocide and to the low enrolment of girls and poor children prior the conflict.
years, I am able to consider changes in the intensity of violence without worrying about the bias if particular unobserved individual characteristics lead to different levels of reporting. Furthermore, I use the measure of male-biased violence as a proxy for gender-specific changes in the opportunity costs and in the returns of going to school. This allows me to pin down the potential mechanisms that explain the heterogeneous effects of violence on education.
The rest of the paper is organized as follows. Section 1.2 provides an overview of the educational system and chronicles the history of crime and violence in Colom-bia. Section 1.3 describes the data. In Section 1.4, I present the conceptual frame-work. Section 1.5 specifies the empirical methodology and presents the main results. Section 1.6 and Section 1.7 report robustness checks and additional specifications, respectively. Finally, Section 1.8 concludes.
1.2 Historical and Institutional Context
1.2.1 Violence in Colombia
Over the past two decades, Colombia’s evolution of violent crimes has been unique. In the early 1970s national homicide rates were not very different from its neigh-boring countries. Beginning in the late 1970s, however, homicide rates increased dramatically, growing more than three-fold by 1991 (Gaviria, 2000). With a homi-cide rate three times higher than those of other violent countries such as Mexico and Brazil, and 36 times greater than Canada, the magnitude of violent crimes in Colombia is overwhelming (see Figure 1.1). These numbers are astonishing when considering that Colombia has had a s democratic government for nearly 50 years and has sustained improvements in social and economic indicators during the past several decades (Moser and Mcllwaine, 2000). The increase and expansion of vio-lence and crime in Colombia in the last two decades has been attributed mainly to the emergence of drug cartels and the economy of illicit drugs, the increase in coca production, and the consolidation of guerrilla groups.
af-fected crime and violence during this period. For example, the enforcement of the extradition laws in regard to drug lords and the increase in antinarcotics aid desta-bilized the Colombian drug market, causing more violence between organized drug cartels trying to gain control over local areas. This contributed to the increase in the number of homicides during the late 1980s and the early 1990s. Homicides peaked in 1991, when nearly one in every 1,000 Colombians was murdered (see Figure 1.2). This surge in violence disproportionately affected young males due to the prolifera-tion of youth gangs related to drug trafficking. During this period, Colombian men between the ages of 15 and 35 were 15 times more likely to be homicide victims than women in the same cohort (Heinemann and Verner, 2006).
Before 1993, Peru and Bolivia were the main countries responsible for harvesting coca leaf, and the Colombia drug cartels produced and trafficked the cocaine around the world. In the early 1990s, the drug industry had to adapt to changes in United States antinarcotics policies, which made transportation between countries that har-vest coca and those that produce and traffic cocaine costly and dangerous (Serafino, 2002). Coca cultivation shifted to Colombia, going from 20,000 cultivated hectares in 1990 to 160,000 in 2000 (United Nations, 2001). These changes also prompted the development of linkages between the illegal drug industry and the most impor-tant guerrilla groups (FARC and ELN) and illegal self-defense groups (AUC). These groups derive substantial income by taxing coca production and recruiting people in the lower ranks of the drug business (Rabasa and Chalk, 2001).
as the United Self-Defense of Colombia (AUC). They were small groups sponsored and financed by land owners to fight guerrillas and protect them. In the 1990s, these groups also grew exponentially, reaching 10,000 people. Just like guerrilla groups, they also received financing from drug cartels. Between 1988 and 2005, Colombian guerrillas killed 1,200 civilians in about 200 massacres, and more than 6,100 died in just under 1,000 massacres perpetrated by right-wing militias (Vargas, 2009).
This paper looks at the period between 1983 and 2005, which includes the 1991 and 2002 peaks in violence. The first period (1983–1993) corresponds to the time when coca exports were rapidly expanding and drug cartels were fighting for control of the drug markets (Pecaut and González, 1997). The second period (1993–2005) covers the increase in the cultivation of coca across the Colombian territory (see Appendix 1) and the strengthening of the guerrilla and paramilitary groups (Rabasa and Chalk, 2001).
1.2.2 Education in Colombia
The education system is one of the largest components of the public sector in Colom-bia, both in terms of size and share of public expenditures. In addition, public school teachers and educational staff comprise the largest share of public sector employees within the economy. From the early 1960s, the Colombian government began to improve public access to education. Government funding for education increased five-fold between 1966 and 1986, causing primary school enrolment to more than double by 1987 (Hanratty and Meditz, 1988). Literacy rates similarly rose from 54 percent in 1973 to 88 percent by 1987. Since the 1970s, the gender gap in schooling has closed, but it not was until the late 1980s that this gap reversed. As a result, more girls are now enrolled in high school than boys. It is notable that the education gap between girls and boys got wider around the same time that Colombia started experiencing high levels of violence (Appendix A1- Figure A1.1). The reversal of the gender gap in education is not specific to Colombia; research has shown than in most Latin American and Caribbean countries, women achieve higher levels of education than their male counterparts (Duryea et al., 2007).
only families in the lowest income groups do not pay for secondary school.5
1.3 Description of the Data
My data are derived from two main sources. First, children’s school outcomes and household and family characteristics come from a 10-percent sample of the Colom-bian Population Census (CPC) for 1985, 1993, and 2005. Second, the data on homicides by municipality are from the Departamento Administrativo Nacional de Estadística (DANE) for the periods 1983–1984, 1991–1992, and 2003–2004.
1.3.1 Individual Data
The CPC microdata sample, consisting of individual records, is acquired from the
In-tegrated Public Use Microdata Series (IPUMS)-International.6 The CPC records are
compiled through direct dwelling questionnaires in which the head of the household provides information about the dwelling and household, and any children below the age of 10. Residents 10 years and older individually provide personal information. This study’s main sample only includes information on basic school-age children. The sample contains all CPC respondents who were between 6 and 17 years of age in the year of the census. Colombia consists of 33 regions and 1,123 municipalities
that the CPC has grouped into 533 units.7 I use only 515 of these units due to
data availability and comparability of the municipalities across years. I exclude 17 units because several of the municipalities that form these groups were created after 1985. The sample thus comprises information on 2,428,282 school-age children and their families. Table 1.2 presents descriptive statistics. Around 51 percent of the sample is male, and 64 percent of the children live in urban areas. Children that had migrated in the previous five years account for 10 percent of the sample. In terms of family characteristics, around 78 percent of children live in a household headed by a man, and in 73 percent, the head of the household is employed. Furthermore, in 88 percent of the cases, the mother is present in the house and in 72 percent the father. In 83 percent of cases, the head of the household is the child’s parent, but 11 percent are grandparents and 1 percent are another type of relative. Moreover, 68 percent of the children live in a family-owned house, whereas 21 percent and 11 percent live
5http://www.cna.gov.co/1741/article-187279.html
6The data set is formed by taking a systematic sample of every 10th private dwelling, excluding
group quarters and the indigenous population.
in a rented dwelling or free of charge, respectively. Finally, around 84 percent of the dwellings have electricity, 71 percent have a flush toilet, and 20 percent do not have a toilet in the dwelling.
Table 1.3 provides additional descriptive statistics on school enrolment of children
by level of school, gender, and census year. 8Although enrolment rates for girls are
higher than for boys in each year, in general the rates are increasing for all levels of school. I calculate the difference between the average enrolment rates of girls minus boys. In the case of primary education, the difference in means between genders is statistically significant and is around 2.2 percent in 1985, 2.1 percent in 1993, and 1.2 percent in 2005. In contrast, the gender gap in education grows in secondary school from 4.0 percent in 1985 to 5.2 percent in 1993 and 4.3 percent 2005. The mean upper-secondary school enrolment for girls varies from 62 percent in 1985 to 68 percent in 1993 to 76 percent in 2005. For boys, the enrolment rate changes from 57 percent to 59 percent and then to almost 70 percent, respectively. The difference in the average enrolment rate of girls versus boys at the upper-secondary school level is larger than for the other levels, ranging from 4.5 percent in 1985, to its peak in 1993 (8.4 percent), and decreasing to 6.2 percent in 2005.
1.3.2 Homicide Data
The Departamento Administrativo Nacional de Estadística (DANE) collects the number of homicides in each municipality using Vital Statistics Records, which include listings of individual deaths and basic demographic information on the de-ceased (gender, educational level, and marital status). The information on deaths comes from the forensics offices, hospitals, and police reports in each municipality and is available annually from 1979 to 2011. For this study, I aggregate by munic-ipality and year all the deaths caused by homicide and guerrilla or governmental actions. Table 1.4 summarizes the descriptive statistics of homicides by year. The number of homicides increases over time: 10,256 in 1984, 30,573 in 1992, and 25,120 in 2004. Most of the victims were male (around 92 percent in 1984 and 1992 drop-ping to 90.7 percent in 2004) between the ages of 18 to 35 (more than 60 percent). Not every death record is complete, but among the subsample with full information, 32–59 percent of victims were single, depending on the year considered. Data on the education level of the victims are only available for the year 2004. Around 25
8I organize school levels into three different groups: Primary school (age 6–10 ), secondary
percent of the victims had at most a preschool education; 43 percent had at least a primary school education (either incomplete or complete, 16 and 27 percent, re-spectively); and 23 percent had attended secondary school. Around 8 percent of the victims went to university.
To generate the main variable of interest—the difference between the male homi-cide rate minus the female homihomi-cide rate by municipality—I match the number of male homicides with the intercensal estimates and projections of population for each
municipality each year.9 Small municipalities are grouped together in the CPC
sam-ple, so I compute the weighted average of the number of male and female homicides by population size for each group and assign these values to all individuals in the municipality unit.
1.3.3 Coca Production and Household Member Characteristic
The increase of coca production in Colombia played an important role not just in fueling violent conflict but also in creating new job opportunities in the municipal-ities that cultivate this crop. I use data from the United Nations Office on Drugs and Crime (UNDOC) to account for coca harvesting. Coca cultivation figures are collected through the Illicit Crop Monitoring System (SIMCI-Sistema Integrado de Monitoreo de Cultivos Ilicitos) and are available at the municipality level from 1999 through 2008. I also use the SIMCI census data to examine the economic and de-mographic situation of farmers in areas where coca is cultivated. In this census, farmers (coca and non-coca growers) were asked about the social structure and the characteristics of their households.
1.4 Conceptual Framework
I next present a simple conceptual framework, based on Becker (1962) and Ben-Porath (1967), that attempts to shed light on the effects of violence on enrolment decisions in secondary education for boys versus girls. In this framework a family makes the decision whether to send the child to school taking into account the relative returns to education. These returns are affected by changes in the local level of violence, since these affect the returns that children can get from engaging in violence-related activities and may also impact life expectancy as well as perceived
9Censuses in Colombia were conducted in 1973, 1985, 1993, and 2005. These also comes from
safety of children.
In my model, there are two periods. In the first period, taking into consideration the returns to violence, the returns to school and discounting expected returns by the child’s life expectancy/perceived safety, the family makes the decision whether to enrol the child in school. The returns to education are acquired in the second period whereas the returns to violence are obtained in the first and second period. In this framework, I focus on the effects of violence that are potentially different for girls and boys: returns to education, returns to violence, and life expectancy (and the perception of safety). I make three key assumptions: 1) Payoffs of violence are different for boys and girls; 2) life expectancy and perceived safety is different across genders; and 3) violence levels are exogenous. Gender differences are key for the results of my model. I therefore abstract from all the effects of violence on education which are not gender-specific. For example, in areas with high levels of violence, disruption of access routes and, more importantly, destruction of schools will increase the time and cost of going to school (Akbulut-Yuksel, 2009). In principle, these type of effects should not have different impacts between boys and girls.
Because the type of violence I consider primarily affects males, the enrolment decisions of boys and girls are affected differently. Male-biased violence creates more opportunities for boys to earn money in violence-related activities. As a result, the returns to violence are larger for boys than for girls. Also, when male-biased violence increases, the life expectancy and the perception of safety is likely to be lower for boys relative to girls.
1.5 Empirical Strategy and Main Results
Before discussing the empirical strategy and results of the paper, I describe the ba-sic notation that I use throughout the remainder of the paper. First, the variable HRm,t−1 =((
N umber of M ale Homicidesm,t−1
M aleP opulationm,t−1 )∗100)-((
N umber of F emale Homicidesm,t−1
F emaleP opulationm,t−1 )∗100)
denotes the difference between the average number of male homicides and female
homicides in years t −1 and t − 2, divided by the male and female population,
respectively, in each municipality. I take the number of male and female homicides in the year prior to each census because enrolment decisions are made at the begin-ning of the year. I average the number of homicides in each municipality over the
previous two years to account for the persistence of violence.10 M ale
i,m,t is equal
to 1 if the child is a boy and 0 otherwise. Finally, the main variable of interest —HRm,t−1∗M alei,m,t— is the interaction between M alei,m,t and HRm,t−1. I
esti-mate all regressions using ordinary least squares (OLS), clustering standard errors
at the municipality level.11
1.5.1 Baseline Specification
The empirical strategy exploits the time-municipality variation in male versus female homicides in Colombia in order to identify the effect of male-biased violence on male
versus female education decisions.12 I empirically test the relationship between the
male homicide rate in a municipality and school enrolment, conditional on the gender of the child. For this purpose, I specify the following model:
Enroli,m,t =β0+β1HRm,t−1+β2M alei,m,t+β3(HRi,m,t−1∗M alei,m,t)
+γχi,m,t+δZm,t+µm+λt+ϕr(t) +εi,m,t (1.1)
whereEnroli,m,t is a binary variable that takes a value of 1 if individualiis enrolled
in school in municipalitymin yeart, and 0 otherwise. χi,m,t includes several control
variables.13 First, it encompasses individual controls: age and a dummy indicating
10When I use different homicide lags up to the fourth lag, I find that homicides in the yearst-1
andt-2 have a larger and significant impact on enrolment.
11I also use a probit model because the dependent variable is dichotomic. The marginal effects
are very similar to the OLS estimates. I use the OLS results because of their easier interpretation.
12See Figure 1.4 for the variation of male minus female homicides across time and municipalities
in Colombia.
if the child has been living in the municipality for the past five years. Second, I include family characteristics because they are important determinants of schooling choices. I include dummy variables for father present, mother present, gender of the head of household (HoH), employment status of the HoH, level of education of the HoH, level of education of the mother, and the relationship of the child with
the HoH.14 Additionally, dummy variables are included to control for children with
missing characteristics. Third, I control for household characteristics. A household’s income may influence a family’s ability to invest in their children’s education. Al-though the main data set does not record household income and savings, Burger et al. (2006) suggest that ownership of a number of non financial assets can proxy for accumulated wealth holdings. Therefore, I use three different proxies for income: a dummy indicating if the house is owned by the family, the type of toilet available in
the dwelling, and a dummy for whether the dwelling has electricity.15 In addition,
I include a dummy variable that indicates if the child lives in an urban area. This variable controls for the possibility that individuals residing in rural regions have access to fewer schools and may face higher opportunity costs due to child labor
needs at home or agricultural job opportunities. zm,t controls for other
municipal-ity characteristics that vary over time and could influence enrolment rates due to changes in economic development of the local areas. For this purpose, I construct
three variables: population density16, municipal income tax per capita17, and the
unemployment rate. Moreover, a dummy variable is added for the municipalities
for which I do not have information on income. The term µm corresponds to
mu-nicipality fixed effects, which control for all time invariant characteristics varying at
the municipality level, and λt is year fixed effects, which account for any national
time trends. Furthermore, to control for potential long-run differences in regional
development, I include a region-specific linear time trend, ϕr(t).18
To identify children’s exposure to violence, I consider boys and girls of school age, and I match their municipality of residence with the data on male minus female homicides by municipality. I compare the enrolment decisions of children within municipalities with varying levels of violence. Additionally, I compare the differen-tial enrolment of boys and girls for different levels of violence. Because I control
14Five categories are included: child, grandchild, child-in-law, sibling, or other relative.
15Quality of the toilet is divided into three categories: flush toilet, non-flush toilet, and no toilet.
16See Cornwell and Trumbull (1994).
17Municipal income tax is used as a proxy for the wealth of the municipality. This measure
comes from Departamento de Planacion Nacional (DNP).
for municipality fixed effects, year fixed effects, and regional trends, I use changes in school enrollments of boys versus girls over time within municipalities (beyond those predicted by national trends) to identify the gender differential effect of male minus female homicides. As a result, estimates will measure the average effect of male-biased violence on school enrolment conditional on gender with reference to municipality averages and year averages.
The main objective of this paper is to determine if changes in violence have an impact on the education gender gap. Given that young males are the main victims of homicide in Colombia as well as the main participants in narcotraffic and gang activities, based on the conceptual framework I expect to find a differential effect between enrolment rates of girls versus boys. According to equation (1.1), the main variable of interest is the interaction term between the male homicide rate minus
the female homicide rate and the male dummy (β3). I denote the expected change
in the gender gap in school enrolment due to an increase in the homicide rate ofδ as
(β3 ∗δ). Consequently, the expected change in enrolment for girls and boys would
be captured by(β1∗δ) and (β1+β3)∗δ), respectively.
In light of the nature of violence in Colombia, parents may regard this violence as a proxy for factors such as new job opportunities, changes in life expectancy, and changes in perceived safety, which in turn will affect the expected returns to education. Since homicide victims are mostly male, more girls relative to boys are likely to be enrolled in school in violent areas, producing a negative coefficient for
β3. Thus, I expect the gender gap in education to be wider in municipalities where
violence increases. β1 can be either positive or negative for girls because enrolment
in school could be affected positively or negatively in municipalities where violence increases. For example, if families face negative income shocks due to changes in male-biased violence, girls and boys may be affected negatively if financial resources are constrained and families cannot invest in the education of their children. In contrast, if families are receiving extra income because of the money boys are earning from getting involved in violent activities, these additional resources may be invested
on girls’ education and positively affect their enrolment. For boys (β1 +β3), an
increase in violence is expected to have a negative effect on school enrolment. That is, the more male-biased violence there is in a municipality, the lower the probability that boys will go to school.
enrol-ment for girls versus boys. There are two main threats to this identification. First, there could be other unobserved characteristics that affect education in places where violence is high. If this is the case, there may be time-varying omitted variables that will bias the estimates. For example, if municipalities with higher levels of vio-lence also experience changes in job opportunities not related to viovio-lence, I may be wrongly attributing the negative effect on education to violence. By the same token, if the state presence in a municipality also changes over time affecting violence and investments in the education sector and this in turn is positively (negatively) cor-related with enrolment decisions, the estimates of violence will be biased downward (upward). The second potential threat is the relationship between education and violence. The identifying assumption would be violated if municipalities affected by violence are also those with lower educational levels and this in turn is driving the changes in violence. I tackle the main potential threats to identification in Section 1.6.
1.5.2 Baseline Results
Table 1.5 shows the results of equation (1.1) and includes the three years of the census (1985, 1993, and 2005). I consider three different age groups based on levels of schooling: primary school age (columns 1–4), secondary school age (columns 5–8),
and upper-secondary school age (columns 9–12).19 Each column corresponds to a
different set of control variables. In all specifications, I control for year fixed effects, municipality fixed effects, and a linear regional trend. Columns 1, 5, and 9 display the results with no additional controls. In columns 2, 6, and 10, I include a first set of individual controls: age, education level of the head of household, ownership of the dwelling, type of toilet in the household, and electricity. Some family and municipality characteristics may affect enrolment decisions and may also be, in turn, affected by violence. I include a second set of individual controls that incorporates some of these variables as a robustness check. In columns 3, 7, and 11, I control for migration status, the education level of the mother, the child’s relationship with the head of household, father present, mother present, the employment status of the head of household, a dummy for urban location, and a dummy for whether the child lives in a metropolitan area. Similarly, to control for changing municipality characteristics, columns 4, 8, and 12 include population density, municipality income
19These specifications are also estimated based on the total number of homicides per municipality.
tax per capita, and the unemployment rate.
In general, for all ages, the estimates of the main variable of interest (β3)—the
interaction term between the male minus female homicide rate and the dummy for
male (HR∗M ale)—are very stable to the inclusion of all the controls. The size of
the coefficient increases when I add the first set of individual controls (columns 2, 6, and 10), suggesting that selection on observables attenuates the estimated effect of
male homicide on the gender gap in education.20 The inclusion of the second set of
individual controls (columns 3, 7, and 11) and the municipality characteristics (4, 8, and 12) that are potentially endogenous because they are affected by violence, do not change the estimates.
I do not find a statistically significant effect at the primary school level. This result is not surprising since primary education in Colombia is mandatory and free. Furthermore, the increase in the opportunity cost of school due to violence is ex-pected to be more important for older children since at these ages they can engaged in violence-related activities. The effect of violence changes considerably for en-rolment of children of secondary school age and even more if we look at those of upper-secondary school age. The coefficient becomes negative and strongly signif-icant. Male-biased violence more negatively affects the school enrolment of boys relative to girls. There is a negative impact of violence on the enrolment in school of boys compared to girls. I focus mainly on the impact of violence on children aged 15–17 because this is the age group at which violence has a larger differential effect between genders. For these ages, an increase of one standard deviation in male-biased violence entails an increase in the gender gap in enrolment of 1.1 percentage
points (columns 9–12).21 This effect is quite large considering that the gender gap in
enrolment in upper-secondary school in Colombia favors girls by around 8 percentage points (Hausmann et al., 2012).
The positive coefficient of HR (β1) indicates that male-biased violence is
pos-itively associated with school enrolment of girls. For all ages, the estimates get smaller when I include the two sets of individual controls. The size of the coefficient for HR decreases, suggesting that observable characteristics of families play an im-portant role in education decisions. At the secondary-school age level, the estimate is no longer statistically significant after the inclusion of municipality characteristics that vary over time (column 8), suggesting that omitted variables bias upwards the
20In particular, estimates suggest that the inclusion of the level of education of the head of
household is very important. I conduct a further analysis in the robustness checks section.
21The standard deviations of male minus female homicide rate and enrolment in upper-secondary
effect of the violence (HR). The coefficient of the male dummy (β2) is statistically
significant and negative for all specifications. On average and for all age groups, fewer boys than girls go to school (around 2 to 4 percent). This difference gets larger with years of age. Furthermore, when looking at the total impact for boys,
(β1+β3) is either negative or zero for all school ages. Estimates suggest that the
differential effect of violence is more pronounced at the upper–secondary school age (columns 10–12). The sample used in this analysis does not include children who died or that are members of guerrilla and paramilitary forces because I only have information on children living in their family house. Since most of these children are boys, the effect of male-biased violence on the gender gap and on boys may be underestimated.
Not finding an effect at the primary school age and finding a negative one that increases with age at the secondary school level helps to shed light on the importance of the channels through which male-biased violence is affecting the gender gap in ed-ucation. Although both mechanisms seem to play a role in investments in education, changes in the opportunity cost of schooling for boys due to new violence-related activities appears to be the most important one. Homicide can be considered as a proxy for gang activity/delinquency and therefore new job opportunities for older
children. In Colombia, the use of young men as hired killers is a reality.22 On the
other hand, the male population between the ages of 18 and 35 face a higher risk of homicide. Hence, reduction in life expectancy and in perceived safety are also important to consider when making educational investment decisions because these factors reduce the returns to school. I find that male-biased violence has a nega-tive effect on the gender gap in education that increases with age, suggesting that although changes in life expectancy and perceived safety are important, their effect is triggered by changes in the violence-related job opportunities.
Over the last two decades, Colombia has experienced two turning points in the history of its violence: the consolidation of the drug cartels due to the growth of the cocaine trade during the late 1980s, and the solidification of the guerrilla groups after the mid–1990s. I divide the sample into two subsamples, 1985–1993 and 1993–2005, to explore whether changes taking place in Colombia during these two periods affected school enrolment. Because evidence shows that the main im-pact of male-biased violence coalesces during secondary school age, Table A1.1 in Appendix A1 shows the results for these ages. Estimates on the effect of male-biased
22For example, Medellin during the 1990s had 400 gangs with approximatley 10,000 child
violence on the gender gap in education are very similar for the two periods, sug-gesting that male violence has a negative effect on the education of boys relative to girls, irrespective of the source of violence. In comparison, the positive estimate
of (β1) in the first period is reversed, meaning that higher levels of male violence
are associated with a negative or not statistically significant effect on the enrolment of girls at the secondary and upper-secondary school age. According to a United Nations Refugee Unit report (2002), a quarter or more of the Colombian guerrillas are women. Although the male/female homicide ratio remains high throughout the study period, women began to take a more active role in the conflict, which could explain the change in the coefficient for girls.
1.6 Robustness Checks
This section presents several robustness checks in order to account for the potential endogeneity of violence. First, I control for the potential presence of omitted variable biases at the municipality and household levels by introducing municipality–year fixed effects or municipality–gender fixed effects, and family fixed effect (Section 1.6.1 and 1.6.2, respectively). Second, I control for coca production as an additional source of bias in Section 1.6.3. Third, as an alternative measure of gender-biased violence, I explore the effect of relative changes in the homicide rate of women relative to men in Section 1.6.4. Fourth, I look at the effect of migration in Section 1.6.5.
1.6.1 Year–Municipality Fixed Effects
Enroli,m,t =β0+β1M alei,m,t+β2(HRm,t−1∗M ale)i,m,t−1+γχi+λm,t+εi,m,t, (1.2)
whereλm,tis the municipality-year fixed effects. In this estimation, the main variable
of interest is β2, which captures the effect of violence on the educational gender
gap. One would expect that the larger the changes in male-biased violence in a municipality, the larger the negative effect on the gender gap in disfavor of men will be. One important consideration is that using all the sets of fixed effects, may be taking away some important variation in the male violence variable. Consequently, the estimation of the gender gap in school should be interpreted as conservative.
Table 1.6 shows the estimates for equation (1.2) for three age groups: primary school age (columns 1–3), secondary school age (columns 4–6), and upper-secondary
school age (columns 7–9).23 Estimates of the dummy for male (Male) and its
in-teraction with the net male homicide rate (HR) are stable to the inclusion of the
two sets of individual control variables. The male dummy (β1) is negative. The
coefficient goes from 2 to 5 percentage points, depending on the level of school. The interaction term—Male*HR—indicates a negative and statistically
signif-icant impact of violence on the gender gap. The coefficient (β2) is not
statisti-cally significant for primary school age (column 3), similar to the estimate in Table 1.5 (column 3), but it is significant at secondary and upper-secondary school age (columns 4 and 9, respectively). At these levels, violence has a larger, negative, and strongly significant effect on the gender gap in education. As in Table 1.5, at the upper-secondary school age, one standard deviation in violence leads to a 1.1 percentage point increase in the enrolment gap. Thus, in regions with high rates of violence, the gap in enrolment is even wider than in other parts of Colombia. This gap grows even more during the last three years of secondary school. Estimates of the effect of violence on the gender gap in education are consistent and stable after controlling for potential unobserved heterogeneity at the municipality-year level that
could bias the results.24 Furthermore, estimates of the violence-induced gender gap
23Each column corresponds to a different set of control variables, as in Table 1.5. The only
control variables that are not included are population density, municipality income tax per capita, and unemployment rate.
24The main narcotraffic cartels were located in Medellin and Cali. As a robustness check, I
is persistent when dividing the sample by time period (1985–1993 and 1993–2005).25 Although the methodology does not allow me to estimate the correlation between the male versus female homicide rate in a certain municipality and the probability
of being enrolled in school (HRm,t−1), by exploiting the variation given by the
inter-action term, I am able to consistently estimate the differential impact that violence has on the gender gap in enrolment among certain age groups.
An additional potential concern is that there are persistent differences in out-comes across genders and municipalities that could bias the results. To control for this, I include municipality fixed effects, which I allow to vary over gender. Results are very similar to those presented in Table 1.5, although the point estimates are smaller (see Table A1.3 in Appendix A1). In general, at the secondary and upper-secondary school age, there is a negative effect of male-biased violence on the gender gap in education in disfavor of boys. Furthermore, it seems that this measure of violence is positively associated with girls’ education.
1.6.2 Intra-Household Estimations
Families compare their children’s expected returns to school with the direct and indirect costs associated with its acquisition. I consider violence to be an addi-tional cost that may alter investment decisions in education. Families may reduce investments in education when confronted with violence because income decreases and the return to education may shrink due to outside job opportunities or/ and reductions in life expectancy and perceived safety. I use a family fixed effects model to estimate the differential effect of violence on boys and girls, thereby differenc-ing out any family-specific or municipality characteristics that affect children within families. This fixed effect model looks at the enrolment differences within families residing in violent regions that have both a boy and a girl. The family fixed effects approach translates into the following specification:
Enroli,m,j =β0+β1M alei,m,j+β2(HRm,t−1∗M alei,m,j)+γχi+λj+εi,m,j. (1.3)
χi controls for age, and λj is family-fixed effects. The parameter of interest is
β2, which captures the effect of violence on the enrolment of boys that have a
sister. Based on the theoretical framework, I expect β2 to be negative. Boys are
more affected by crime in terms of life expectancy and job opportunities; therefore, families will adjust their investment decisions by favoring the education of the girls in the household.
I restrict the sample to families with just two school-age children. Table 1.7 displays the results of equation (1.3). Column 1, which looks at primary school age,
shows no differential effect between genders due to violence is found(HR*Male). The
estimate is negative and small but not statistically significant. The coefficient for the male dummy is negative and statistically significant, even though it is very small (0.009 percent). Columns 2 and 3 show the impact of the male-biased homicide rate
(HR)on secondary and upper-secondary school age. The estimate of the interaction
term between the male dummy and HR increases in size and becomes statistically
significant. The differential effect of violence by gender on school enrolment, (β2),
shows that as children get older a larger differential effect between boys and girls occurs in families that face higher levels of violence. At the upper-secondary school age, the size of the coefficient is double that of the secondary school age (going from 5 percent to 10 percent), suggesting that older boys are the most affected by violence. The size of the effect is very robust across estimations from equations (1.1), (1.2), and (1.3). At the secondary and upper-secondary school age, the male dummy remains negative and the size of the coefficient increases with age (columns 2 and 3). These results are consistent with the previous findings in Tables 1.5 and 1.6. The results indicate that families and children consider violence and crime opportunities
when making their investment decisions in education.26
This methodology has some limitations. First, if parents have gender-based edu-cational preferences unrelated to violence, their choices will be incorrectly attributed
to the effect of violence andβ2 could be overestimated. Second, the restricted
sam-ple includes only children with one sibling, which is around 30 percent of the total
sample and could limit representativeness.27
Finally, to make the results more comparable to the initial findings, I also es-timate equation (1.1) with the current sample, including the same set of control variables as in the baseline estimation. Table A1.5 in Appendix A1 provides the re-sults for families with two children grouped by the number of sons in the household.
26This sample only considers children who live in a household headed by a parent. The same
model is estimated including children who live in a household headed by a relative who is not necessarily their parent. As an additional robustness check, I estimates equation (1.3) using the different samples (1985–2005, 1985–1993, and 1993–2005), and the results are consistent with previous estimates.
Violence increases the probability of being enrolled in school for girls when there is a boy in the household, especially at the secondary and upper-secondary school
age. Additionally, the effect on the gender gap (HR*Males) is always negative and
statistically significant. The negative effect for boys increases with age. No signif-icant effect is found in families with only girls or only boys, but the signs of the coefficients are as expected: negative for boys and positive for girls.
1.6.3 Coca Production
Coca leaf cultivation rose from 20,000 hectares in 1990 to 160,000 in 2000. Angrist and Kugler (2008) consider violence in urban versus rural regions that grow coca and find that violence increases more in the rural parts of the coca-growing regions that have experience prior conflict. Furthermore, male-biased job opportunities, such as harvesting coca, could affect school enrolment decisions. Thus, one concern is that the reduction in enrolment rates of boys is due to this new job opportunity (coca cultivation) but not to violence-related activities. Furthermore, coca production may also increase job opportunities for girls. Both women and men cultivate and harvest coca. Hence, women will also have a new labour outlet, which could increase their opportunity cost of going to school.
I take two additional approaches to account for the effect of coca production on schooling decisions. First, I create a dummy variable indicating if the municipality has ever produced coca, and I interact it with the homicide rate to measure the impact of male-biased violence and coca production on education. The following model aims at separating the possible effects of cultivating coca and residing in a violent area:
Enroli,m,t =β0+β1HRm,t−1+β2M alei,m,t+β3(HRm,t−1∗M alei,m,t)+β4(Cocam∗HRm,t−1)
+β5(Cocam∗HRm,t−1 ∗M alei,m,t)+γχi,m,t+δZm,t+µm+λt+ϕp(t)+εi,m,t, (1.4)
where Cocam∗HRm,t−1 is the interaction between a dummy variable that takes a
value of 1 if the municipality has ever had coca cultivation and the average rate
of male minus female homicides in years t−1 and t−2 in the same municipality.
Additionally, (Cocam∗HRm,t−1∗M alei,m,t) is the previous interaction term times