Essays in Financial History
Stefan Gissler
TESI DOCTORAL UPF / ANY 2014
DIRECTOR DE LA TESI
Acknowledgements
Although the cover only shows one name, I am indebted to many people. With-out the support of friends, professors, and my family a lot of these pages still would be blank.
Daily life at university was influenced by my office mates and other stu-dents. I thank all of them for good discussions while solving problem sets and good company during coffee breaks. I especially thank Philipp Ager and Fab-rizio Spargoli, which shared an office with me for several years.
Feedback is an important part of the learning process. I therefore thank the participants of the International Lunch Seminar. A special thanks goes to Fer-nando Broner, Alberto Martin, Ander Perez, and Jaume Ventura.
To stay focused and motivated, life outside the university matters. I thank the members of the Barcelona Road Cycling Group and the people from Pave Culture Cicliste for sharing several (sometimes cruel) hours on the bike with me. These rides not only provided challenges and great conversations, but led also to a fresh mind.
A very special thank you goes to my advisor Joachim Voth. He provided invaluable advice and guidance throughout my PhD. He spotted flaws, saw fea-tures of my work I did not realize, and if necessary also provided advice on decisions not related to academia. During the stressful time of my job-search, his assistance and preparation was second to none.
Abstract
Do market frictions influence asset prices? The first part examines whether finan-cial intermediaries’ balance sheet capacity, their funding liquidity, can influence market liquidity, volatility, and price patterns. Using a historical case study this part suggests that when a liquidity provider is balance sheet constrained, markets become illiquid and prices move. The second part looks at Germany’s 1927 stock market crash. It sheds light on the relationship between leverage and asset price behavior. The results indicate that a bank’s credit policy influenced asset prices – an expansive policy dampened volatility and increased returns. A sharp cut in margin credit led to larger price fluctuations. The third part looks at the con-nection between the financial side and the real side of the economy. Testing the theory of rational bubbles, it suggests that in 18th century England government debt increased consumers’ welfare by giving them a safe store of value.
Resum
Preface
“History is a good place to look for answers” – The Economist introduced an Essay on financial crises with these words.1 The aim was to come to grips with the current crisis by learning lessons from the past. This thesis takes such an approach. In each of its chapters, it asks a specific question relevant for todays financial system: Does financial intermediaries’ balance sheet capacity matter for asset prices? Does a sudden shock to leverage lead to price dislocations and volatility? Can consumers gain from government debt in an underdeveloped fi-nancial system?
A main benefit of turning to history in the search for answers to current ques-tions is the decrease in complexity. Empirical studies face several difficulties in modern financial markets. Assets are traded at multiple venues; examining one market place in isolation can post problems. Fair value accounting forces finan-cial intermediaries and traders to change the value of their balance sheets daily – feedback effects from asset prices to balance sheets may occur. The first two parts of this thesis deal with these concerns. They take a look at the German Stock Exchange in interwar Germany. A small set of players dominated the market, trading took place at a single venue, and balance sheets of traders did not change during the period of observation. But history does not only provide guidelines for todays highly developed financial markets. Questions concern-ing developconcern-ing markets often struggle with data problems. For less developed economies financial data are hardly available. The third part turns to 18th cen-tury England. Reliable data on England are abundant and allows us to examine a financial system in its infancy.
The first part looks at a particular explanation for short run price patterns. A V-shaped price pattern is often observed in financial markets – in response to a negative shock, prices fall “too far” before reversing course. This part looks at one channel of such patterns: the link between a liquidity provider’s balance sheet and asset prices. I examine a well-identified historical case study where a large exogenous shock to a liquidity provider’s balance sheet resulted in se-vere capital constraints. Using evidence from German universal banks, who acted as market makers for selected stocks in the interwar period, I show in a difference-in-differences framework that binding capital constraints made stocks 15–20 percent more likely to be illiquid if they were connected to the distressed
1
liquidity provider. This resulted in V-shaped price patterns during times of illiq-uidity, where prices declined on average 2.5 percent and reversed over the next one to three days. Investing in these particular stocks would have yielded sub-stantial gains. These findings can be rationalized by a model that incorporates imperfect competition and asymmetric information. Under this model, banks’ market–making reduces price volatility (and uninformed traders’ reactions to price movements) in normal times whereas in distressed times, the price im-pact of noise trading is high and leads to sharp price declines that are unrelated to fundamentals.
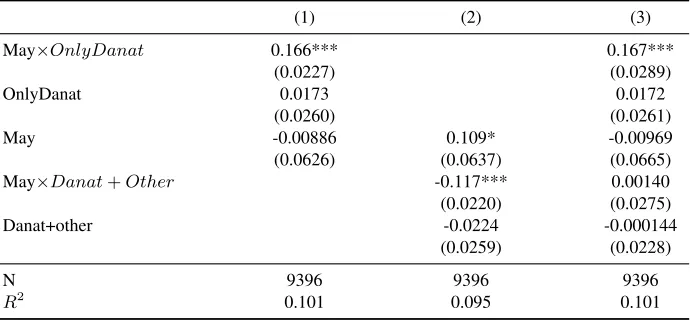
The second part turns to the relationship between margin credit and asset prices. Leverage is often seen as villain in financial crisis. Sudden deleverag-ing may lead to fire sales and price pressure when asset demand is downward-sloping. This chapter looks at the effects of changes in leverage on asset prices. It provides a historical case study where a large, well-identified shock to margin credit disrupted the German stock market. In May 1927, the German central bank forced banks to cut margin lending to their clients. However, this shock affected banks differentially; the magnitude of credit change differed across banks. Using the strong connections between banks and firms in interwar Germany, I show in a difference-in-differences framework that stocks affiliated with affected banks decreased over 12 percent during 4 weeks. Volatility of these stocks doubled. Relating directly bank balance sheet information to asset prices, I find that a one standard deviation decrease in lending to investors increased an affected stock’s volatility by 0.22 standard deviations. These results are robust to the problem that banks’ lending decisions may be influenced by asset prices. The Reichs-bank threatened Reichs-banks to cut their short-run funding. Using the differences in exposure towards this threat, an instrumental variable strategy provides further evidence that a sharp decrease in leverage may lead to stock price fluctuations.
Contents
Index of figures xiii
Index of tables xvi
1 SLOW CAPITAL, FAST PRICES: FUNDING LIQUIDITY SHOCKS
AND STOCK PRICE REVERSALS 1
1.1 Introduction . . . 1
1.2 Historical background: The Berlin Stock Exchange and the ”big banks” . . . 9
1.3 Data description . . . 17
1.4 A funding liquidity shock and market illiquidity . . . 19
1.4.1 Frequency of illiquidity . . . 19
1.4.2 Order imbalances and market illiquidity: Baseline results 20 1.4.3 Order imbalances and illiquidity: Extensions . . . 22
1.5 Funding liquidity and price reversals . . . 27
1.5.1 Prices and volatility . . . 28
1.5.2 Co-movement of returns and the flight to quality . . . . 29
1.5.3 Return reversals and V-shaped price patterns . . . 29
1.5.4 Investing in illiquidity: A contrarian trading strategy . . 31
1.6 A theory of noise trader risk and banks as liquidity providers . . 33
1.6.1 Setup . . . 34
1.6.2 Expectations and equilibrium . . . 36
1.6.3 Price volatility and price impact . . . 39
1.7 Conclusion . . . 40
1.8 Tables and Figures . . . 43
1.10 Appendix B: Excess returns . . . 66
2 A MARGIN CALL GONE WRONG: CREDIT, STOCK PRICES,AND GERMANY’S BLACK FRIDAY 1927 69 2.1 Introduction . . . 69
2.2 Related Literature . . . 72
2.3 Historical background: The Black Friday of 1927 and the stock market in the interwar period . . . 74
2.3.1 The economic situation of interwar Germany . . . 75
2.3.2 The Berlin banks . . . 76
2.3.3 The Reichsbank and the shock to margin credit . . . 77
2.3.4 Germany before WW II: Bank-firm connections and the stock market . . . 79
2.4 Data and descriptive statistics . . . 81
2.5 Margin credit and asset price behavior . . . 82
2.5.1 Deleveraging and stock price movements: Summary statis-tics . . . 82
2.5.2 Baseline results . . . 83
2.5.3 Returns and volatility: Further differences across stocks 84 2.6 Balance sheets and asset price behavior . . . 88
2.6.1 Margin credit, returns, and volatility . . . 88
2.6.2 Credit and order book imbalances . . . 89
2.6.3 IV strategy . . . 90
2.7 Conclusion . . . 92
2.8 Tables and Figures . . . 94
3 CONSUMING WITHOUT CAPITAL: THE BLESSINGS OF GOV-ERNMENT DEBT IN 18TH CENTURY ENGLAND 111 3.1 Introduction . . . 111
3.2 Eighteenth-century England: Two tales of one country . . . 114
3.2.1 The economic situation . . . 114
3.2.2 A “Nation of Shoppers” . . . 116
3.3 The Missing Link: The Financial Revolution . . . 120
3.4 Putting the pieces together: National debt and the Consumer Revolution . . . 121
[image:10.499.87.439.99.599.2]List of Figures
1.1 Returns after days of illiquidity . . . 5
1.2 Order imbalances: Deutsche Bank vs. Danatbank firms . . . 54
1.3 Order imbalances: Placebo test . . . 55
1.4 News about Danatbank-firms . . . 56
1.5 Banks’ stock prices . . . 57
1.6 Price indices . . . 58
1.7 Volatility . . . 59
1.8 Expected returns after order imbalances: General case . . . 60
1.9 Expected returns after order imbalances: Danatbank firms and other firms . . . 61
1.10 Investing in illiquid stocks: Daily returns . . . 62
1.11 Investing in illiquid stocks: Cumulative returns . . . 63
1.12 Returns after order imbalances . . . 64
1.13 Price variance and price impact . . . 65
2.1 Returns and volatility . . . 105
2.2 Stock market credit and the overall stock market. . . 106
2.3 The Reichsbank’s promissory notes portfolio . . . 107
2.4 The Reichsbank’s foreign exchange . . . 108
2.5 Differences by size . . . 109
2.6 Differences by number of underwriters . . . 110
List of Tables
1.1 A dealer’s order book . . . 43
1.2 Sample balancedness . . . 44
1.3 Number of bank-firm connections . . . 45
1.4 Price tags about order imbalances . . . 45
1.5 Market illiquidity: Frequency of order book imbalances . . . 46
1.6 Baseline results . . . 47
1.7 Logit results . . . 48
1.8 Danat-firms: Single underwriter vs. additional underwriters . . . 49
1.9 Danat-firms: Imbalances and initial price level . . . 50
1.10 Return co-movement . . . 51
1.11 Imbalances across variance quartiles . . . 52
1.12 Return predictions . . . 53
2.1 Balance sheets: Berlin banks and other banks . . . 94
2.2 Banks’ balance sheets . . . 95
2.3 Descriptive statistics . . . 96
2.4 Descriptive statistics (Single underwriter sample) . . . 96
2.5 Summary statistics before and after margin call . . . 97
2.6 Baseline regression:Variance and returns . . . 98
2.7 Baseline regression: Order book imbalances . . . 99
2.8 Firm size and number of underwriters . . . 100
2.9 Bank-specific regressions: Returns and volatility . . . 101
2.10 Credit and stock prices . . . 102
2.11 Order book imbalances . . . 102
2.12 Credit and order book imbalances . . . 103
3.1 Frequencies of ownership of selected household goods . . . 118
3.2 Tea imports for home consumption . . . 119
3.3 Consumption of selected goods . . . 120
3.4 British National Debt . . . 122
Chapter 1
SLOW CAPITAL, FAST
PRICES: FUNDING
LIQUIDITY SHOCKS AND
STOCK PRICE REVERSALS
1.1
Introduction
constraints.1 If capital constraints bind, asset prices start to move and diverge from fundamentals.
There is growing empirical support for the slow-capital interpretation of price overshooting. For example, when typical buyers and arbitrageurs are both con-strained, prices and fundamentals may diverge for an extended period (Mitchell et al. 2007). The inventory positions of specialists on the New York Stock Ex-change (NYSE) have predictive power for a stock’s liquidity (Comerton-Forde et al. 2010) and are negatively correlated with contemporaneous returns (Hendershott and Seasholes 2007). Also, changes in dealers’ repo positions can predict future asset price movements (Adrian and Shin 2010). Despite this evidence, it has proved difficult to establish a causal link between a liquidity provider’s balance sheet and asset prices. In today’s markets, the role of liquidity provider is often amorphous and can change over time. Furthermore, to establish a causal relation between funding liquidity and asset prices, the balance sheet shock has to be large and exogenous. For all these reasons, there is currently no compelling evi-dence establishing a causal link between capital–constrained liquidity providers and price overshooting in asset markets.
In this chapter of the thesis, I examine a well-identified historical case study where an exogenous shock to a market maker’s balance sheet resulted in serious capital constraints. I use evidence from German universal banks during the inter-war period, which acted as market makers for selected stocks. A difference-in-differences framework shows that binding capital constraints made stocks 15 to 20 percent more likely to be illiquid if they were connected to the distressed liq-uidity provider. In these periods of illiqliq-uidity, V-shaped price patterns emerged and prices fell by an average of 2.5 percent, before reversing over the next one to three days. These return reversals led to a large increase in the short-run volatility of stocks. Returns of other stocks associated with the constrained liq-uidity provider began to exhibit strong co-movement. An investment strategy that bought these stocks during supply order imbalances returned 50 percent in a single month.2 These findings can be rationalized in a model based on Kyle (1989) that features both asymmetric information and imperfect competition. This model allows me to show that banks’ market–making reduced price volatil-ity, but increased the effect of noise trading. When a better–informed trader can provide liquidity to noise traders, overall noise becomes insignificant. However,
1
One obvious alternative interpretation is predatory trading (Brunnermeier and Pedersen 2005).
2
if a market maker is unable to counteract noise trading then prices decline sharply in response to asset supply shocks.
Before World War II, large universal banks based in Berlin dominated Ger-man stock markets, especially the Berlin Stock Exchange. Banks supplied com-mercial banking services to firms and other customers and were the main cred-itors for firms. At the same time, bank managers often sat on the supervisory boards of their clients. These customs established strong connections between banks and firms. Fohlin (1991) describes this situation in detail. On the stock market, a firm typically expected a bank to prevent large fluctuations of the firm’s stock price (Wermert 1907, Prion 1929, Lehmann 2011). Banks used their capi-tal and stock inventory to make markets. During periods of high demand, banks would sell stock; when pressure to sell was high, they would buy. Adolf Weber’s 1915 manual about the German stock market describes this situation:
...The current demand and supply of a stock is responsible for the current market price...only a few shares, if they come to the mar-ket at the wrong time, can lead to an unreasonable price increase or decrease. It is the role of the banks to...establish an orderly price set-ting by buying the shares brought to the market or by adding shares to the existing supply. The underwriting bank will be able to do this better, since it is mostly better informed...because it constantly stays in touch with the firm’s leaders.3
The strong connections between banks and firms provide cross-sectional varia-tion in a difference-in-differences framework. Each bank supplied liquidity to a different set of stocks, those of their associated firms. A sample of firms listed on the Berlin Stock Exchange is sorted into bank–specific portfolios so that each portfolio consist of stocks having a common liquidity provider. I then identify a large exogenous shock to the balance sheet of one of these liquidity providers and examine the behavior of its connected stocks during this time of distress.
German history reveals an exogenous shock to a liquidity provider’s balance sheet. On 11 May 1931, one of the big banks, the Danatbank, discovered that its biggest creditor, the Norddeutsche Wollkaemmerei (Nordwolle), had for several years been forging its balance sheets; in fact, Nordwolle was close to bankruptcy.
3
Instead of releasing this information to the public, the Danatbank decided to keep it a secret (Born 1967, Feldman 1995). The bank committed itself to providing Nordwolle with additional funds. Undetected from other market participants, it began purchasing its own stock. These decisions severly constrained Danat-bank’s balance sheet. During May 1931, the Danat-bank’s trading arm was less able to provide liquidity to shares of its other connected firms.
During the period when Danatbank kept its troubles secret, stocks of affili-ated firms continued to experience normal, occasional spells of selling pressure. Now, however, Danatbank was not able to smooth out the peaks. The empirical section provides evidence of an increase in illiquidity and strong price reversals during times of low funding liquidity. I use daily stock market data for 87 firms from November 1930 through June 1931. Bank–firm connections are identified through the underwriter prospectuses and firm–specific annual reports held at the German Federal Archives in Berlin. When Danatbank was unable to provide liq-uidity, the probability of supply order imbalances increased for connected stocks by 15–18 percent. During May 1931, the returns of Danatbank–connected firms became predictable after supply imbalances. In these cases, prices deviated sub-stantially and more than in the case of other banks. The increasing illiquidity of stocks associated with Danatbank is not uniform across the sample and more volatile stocks show stronger reactions.
Figure 1.1:Returns after days of illiquidity. These graphs plot the average cumulative returns for firms associated with two different liquidity providers, the Commerzbank and the Danatbank. Cumulative returns are plotted after days of illiquidity as indicated by the existence of supply order imbalances. Averages are taken across firms and within two periods: before May (1 November 1930–10 May 1931) and during May (11 May 1931–4 June 1931). -. 0 3 -. 0 2 -. 0 1 0 .01 C u m. re tu rn s
-1 0 1 2
Days after illiquidity
Commerzbank firms before May
-. 0 3 -. 0 2 -. 0 1 0 .01 C u m. re tu rn s
-1 0 1 2
Days after illiquidity
Commerzbank firms during May
-. 0 3 -. 0 2 -. 0 1 0 .01 C u m. re tu rn s
-1 0 1 2
Days after illiquidity
Danatbank firms before May
-. 0 3 -. 0 2 -. 0 1 0 .01 C u m. re tu rn s
-1 0 1 2
Days after illiquidity
Danatbank firms during May
month. These high returns reflect the strength of “V-shaped” price patterns in the days after order imbalances.
noise to the total demand, although this added noise is negatively correlated with noise trader demand. For reasonable parameter values, the model indicates that the negative correlation between the bank’s market–making demand and noise trading results in less volatile prices. Yet this reduced volatility renders the bank less able to trade on its private information and thereby restricts its specula-tive demand. Under these conditions, uninformed traders will also react less to changes in prices and the price impact of noise increases. In normal times this noise is small, so the bank can successfully reduce price volatility. But if the bank is unable to act as a market maker, then prices react strongly to fluctuations in noise trader demand and so sharp price declines away from fundamentals can occur.
This study relates to several strands in the literature. It is closely connected with the literature on traders’ funding conditions and asset markets. These pa-pers are part of the research agenda on slow–moving capital that seeks to explain several asset pricing “puzzles”.
Several empirical studies find a correlation between traders’ balance sheets and asset price movements. Adrian and Shin (2009) and Adrian and Shin (2010) show that changes in dealers’ balance sheet positions have predictive power for changes in market volatility. Coughenour and Saad (2004) examine the move-ments in market liquidity of stocks traded by a given market maker at the NYSE and find that market liquidity changes after mergers of market maker firms. These authors argue that such changes result from larger firms having a greater balance sheet capacity. Coughenour and DeLi (2002) find that liquidity provision changes with the organizational form of the firm; Comerton-Forde et al. (2010) use inventory positions of NYSE specialist firms as a proxy for a market maker’s funding liquidity. During times of distressed funding liquidity, illiquidity and asset volatility are positively correlated. Furthermore, specialists’ inventory po-sitions are negatively correlated with contemporaneous returns (Hendershott and Seasholes 2007). The price pressure (and reversals) are greater for smaller firms (Hendershott and Menkveld 2013). Andrade et al. (2010) show that trading im-balances on the Tokyo Stock Exchange lead to price declines and reversals.
outflows. Edmans et al. (2012) use a related measure and confirm that after large selling pressure from mutual funds stock prices decline and revert fully within two years.
Several theoretical models establish a causal relationship between funding and market liquidity. In Gromb and Vayanos (2002), market makers are margin constrained and asset valuations affect the wealth and the margin requirements of a market maker. Falling prices can thus constrain the market maker’s ability to provide liquidity; Gromb and Vayanos (2010) offer a dynamic version of this model. Brunnermeier and Pedersen (2009) extend this line of research by intro-ducing financiers with a value-at-risk constraint, which yields the micro foun-dations for fluctuations in the margin requirement. In their model, a feedback effect arises from changes in margins and wealth that alter asset prices—margin and wealth spirals drive asset prices downward. Gˆarleanu and Pedersen (2007) also link changes in liquidity to risk management practices.
moving capital is rational inattention (Biais et al. 2011).
This chapter is also related to the literature on commonality in liquidity. Chordia et al. (2000) show that asset-specific measures of liquidity co-move with measures of marketwide liquidity. That co-movement extends to such measures of funding liquidity as the T-bill–eurodollar (TED) spread (Brennan et al. 2009). Moreover, co-movement is stronger when illiquidity originates on the sell side.
The investment strategy proposed here is related to return predictability and the literature on contrarian trading strategies. Nagel (2012) argues that a “return– reversal” investment strategy resembles the trading motives of a liquidity provider.4 This strategy delivers high returns during times of illiquid markets—for exam-ple, after the collapse of Lehmann Brothers in 2008. Rinne and Suominen (2010) arrive at similar conclusions.
The theoretical section is related to the issue of intervention in financial mar-kets. Ever since Bagehot (1873), there has been an ongoing debate over whether or not monetary authorities should intervene in financial markets. DeLong and Becht (1992) connect this controversy to the literature on noise traders. Noise trading leads to price fluctuations, and DeLong and Becht (1992) suggest that an informed institution could increase welfare by smoothing such fluctuations.
From a historical perspective, this chapter relates to the literature on interwar Germany and the German financial system. James (1986) describes in detail the turbulent times of hyperinflation, high unemployment, rapidly changing govern-ments, and the crisis of 1931.5 Fohlin (1991) reviews the role of German banks before World War II. Several papers examine the German stock market, but most deal with the pre-WW I period (see, e.g., Burhop (2011) or Lehmann (2011) on IPO underpricing). Comparing the German stock market with the US stock mar-ket, DeLong and Becht (1992) find that the German market was different in the first half of the twentieth century: unlike the United States, Germany did not ex-perience excess volatility. These authors speculate that market–making activities of banks smoothed price fluctuations. Voth (2003) is one of the few studies on the German stock market in the interwar period. This work explores the pricking of a seeming “bubble” by the Reichsbank in 1927.
Relative to the existing literature I make the following contributions:
Illiq-4
Return reversal strategies are also developed in Lo and MacKinlay (1990) and Lehmann (1990).
5
uidity and price reversals can stem from many sources, one of which may be a liquidity provider’s balance sheet. In this chapter I supply clear evidence that funding liquidity affected market liquidity during a particular historical period. This historical case allows us to observe an exogenous shock to intermediation capital and also enables us to test for stock market illiquidity. Reduced funding liquidity did lead to less market liquidity, as predicted by the theoretical litera-ture. During periods of illiquidity, asset prices moved as expected and exhibited a V-shaped pattern. By documenting illiquidity and return reversals I contribute to the empirical literature on return predictability. Further, this study is com-plementary to the literature on price behavior after supply pressure. In contrast to these papers that focus on sudden increases in asset supply, this study looks on the effects of a sudden decrease in asset demand. While in the literature on mutual funds’ outflows prices decline and take a long time to rebound, this study shows large effects on short-run volatility when the demand side is constrained. The empirical part also adds to the historical literature and tests the hypothesis of DeLong and Becht (1992) that banks actually reduced the volatility of Ger-man markets. The theoretical discussion suggests that the banks’ intervention in markets came at the cost of greater price impact. In normal times, banks’ market–making demand can reduce volatility, although price impact increases. In times of constrained liquidity provision, this greater reaction of prices to noise induces large price fluctuations.
Section 1.2 details the historical background and the shock to funding liq-uidity. The data is described in Section 1.3. Section 1.4 shows how the funding liquidity shock affected market liquidity and Section 1.5 examines the behav-ior of asset prices during these periods of illiquidity. The empirical findings are rationalized by the model presented in Section 1.6. Section 1.7 concludes.
1.2
Historical background: The Berlin Stock Exchange
and the ”big banks”
This section places the study in its historical context. It describes the tasks of German banks, how the Berlin Stock Exchange worked, and the exogenous shock to funding liquidity.
The Economistof 21 October 1911 noted that:
German banks have a much wider sphere of action than our En-glish deposit banks...they are stock, bill, and exchange brokers and dealers, banker-merchants, trust, financial, and promoting compa-nies, etc...Not only have the banks promoted most of the industrial joint-stock companies, and retain part of their share capital, but their managing directors remain members of the board of these compa-nies for their services in that capacity.6
Until WW I firms could choose from a wide variety of banks (Reisser 1910). This choice narrowed during the 1920’s, when Germany experienced a major consolidation of the banking industry. By the 1930s, the financial system was dominated by just a handful of big banks. Five in particular towered over all oth-ers: The Berliner Handels-Gesellschaft (BHG), the Commerzbank, the Deutsche Bank und Diskonto-Gesellschaft, the Darmstaedter und Nationalbank (Danat-bank), and the Dresdner Bank. These “big Berlin banks” had connections to an extensive portfolio of firms ranging from small family businesses to large manu-facturers such as Siemens.7A bank’s CEO typically sat on the supervisory board of a firm; when the latter went public, a connected bank was the natural choice for underwriter (Lehmann 2011).8 In a typical equity offering, the bank bought the shares at a fixed price and placed them in the market, serving its own clients first. However, banks did not sell all shares and kept some stocks in their portfo-lios. This custom was meant to align the incentives of a firm and its bank, as it emphasized the connection and dedication of the bank to its client. Even with-out a large credit with-outstanding, the firm’s risk was still part of the bank’s balance sheet. Yet this balance sheet position was not static because banks were active on the exchange in making markets for stocks of connected firms. In a country that just had experienced times of financial turmoil, investors sought security and stability. Firms seeking to accommodate this need preferred their stock prices to
6
Although these remarks were made prior to WWI, they remained valid in 1931. According to theWall Street Journalof 5 May 1931: “Bank heads hold directorships in scores of companies, and the banks themselves retain holdings in shares they have issues”.
7These banks were referred to as “big Berlin banks” because each of these banks had their
headquarter in Berlin
8
exhibit low volatility. Prices should not fluctuate solely because of market illiq-uidity and firms believed that a specific trader would keep markets liquid and establish a smoothly functioning price environment. Firms expected their con-nected bank to provide this service and to act as a market maker in their stocks. Better insights into current affairs and into the long-run outlook of connected firms gave banks an advantage in estimating a given firm’s fundamental value, enabled them to establish an appropriate price level. Banks used their capital and their inventory to smooth stock price fluctuations during periods of order imbalances at the Berlin stock exchange (Fohlin 1997). This “important role that banks play in the daily trading” (Prion 1929) was an accepted fact at German stock markets and acknowledged by newspapers, books, and stock market man-uals.9 For example, Prion (1929) describes the typical bank trading behavior as follows:
At the Berlin Stock Exchange it is impossible that supply and de-mand match daily. Fluctuations from one day to the other that are based on these imbalances and do not represent the fundamental value can be prevented through the intervention of the connected banker...Through this a constant possibility to sell is assured: the banker takes on excess supply to sell it over time again.
However, providing this “service of immediacy” (Grossman and Miller 1988) to connected firms had its limitations. Market–making required bankers to have deep pockets as well as immediately available capital.10 Note also that, unlike specialists at the NYSE, banks were never officially appointed as market mak-ers. They could refrain from providing liquidity or withdraw liquidity altogether without stating a reason for doing so. Their behavior could perhaps best be de-scribed as akin to that of traders following a contrarian investment strategy.
A closer look at the Berlin Stock Exchange’s microstructure helps explain exactly how banks made markets in stocks of connected firms. After the found-ing of the German Reich in 1871 the Berlin Stock Exchange became one of the world’s major exchanges and during the 1920s it was the only stock exchange
9
The elimination of large fluctuations may have hindered prices to fully reveal all information. But Dang et al. (2013) show that banking is inherently opaque and that this opaqueness can be welfare enhancing. See also Gorton (2013), who describes opaqueness in the US banking system.
10
in Germany with notable volume.11 Only the Berlin Stock Exchange drew the attention of politicians, the Reichsbank, the banks, and the media.
Each trading day, the exchange held a single call auction. A single stock had two official market makers orKursmakler, which were located at a designated post inside the stock exchange. Similar to specialists at the NYSE, these official market makers could trade on their own account to ensure price continuity, but this procedure was seldom used.12For one and a half hours, orders could be sub-mitted to the official market maker either as limit orders or as market orders. Af-terward, the process of price setting began. The market makers brought together their order books, and a public discussion about the unique market-clearing price followed. Meanwhile, traders were still able to submit bids and offers until a sin-gle price was set that maximized trading volume. As a minimum requirement, all market orders had to be filled.13 The last step was acceptance of the price by a committee, which was mainly concerned about large price swings. Sometimes prices were rejected in order to keep volatility within certain bounds.14 All pos-sible trades were settled at the established price.
If markets did not clear at the settled price then the market was left with sup-ply or demand order imbalances. In extreme cases, order book imbalances were too great to enable trades and so it was not possible to establish a price quote. The official share price list reported the existence of order book imbalances. A lowercase letter appended to the price quote figure informed traders about any imbalances and also their direction. Table 1.1 gives an example of the price set-ting and shows a stylized order book. In this example, matching all sell orders without limit requires the auctioneer to go deep into the order book. The price drops, and there remains unmatched supply at the established price.
Often in cases of such imbalance, the connected bank intervened to prevent prices from fluctuating too widely. The bank placed an employee at the post of each market maker for its associated firms; that employee followed the
price-11
See Davis et al. (2003)
12Trading on their own account was risky for official market makers. Stock exchange officials
constantly checked the order books; if a market maker held a stock inventory for more than one day, he was suspected of insider trading and had to pay a large fine.
13
The price set by the auctioneer is described by Prion (1930) as “the price, which reflects demand and supply...the price, which, given the limits on the orders, maximizes the number of trades.”
14
setting process, ready to step in whenever order imbalances arose. In normal times he had the means to satisfy all orders without limits and to keep price fluc-tuations low. Trading then proceeded without major price effects and the market remained liquid.15
Traders were well aware of this special role, which banks fulfilled most of the time. Yet situations occurred where banks did not immediately provide liquidity. There are many reasons why a bank might decide against doing so. In most cases the bank merely required assurance that no major fundamental event was driving the order book imbalances. Until the bank was satisfied on that score, traders had to decide whether to follow its lead and thus, perhaps, miss an investment opportunity.16
Despite the overall goal to keep prices from fluctuating, order imbalances were not symmetric. Few stocks were listed as having excess supply, but excess demand was commonplace because “bankers do not like an excess supply quo-tation” (Wermert 1907: 636). Wermert (1907) also notes that a bank’s objective was to achieve a “high quotation or the quotation of excess demand that at least the stock appears as demanded in the stock price list.” In normal times, a bank would more than satisfy the supply side while taking the risk of unexpected large supply shocks.
The notion of supply order imbalances is my main measure of market illiq-uidity. When such imbalances existed, some traders were unable to sell at current market prices. If the imbalances were large enough, liquidity could even evapo-rate and leave traders unable to sell at any price. A connected bank could prevent such situations, but doing so required capital. In Section 1.4 I test whether this measure of a stock’s liquidity deteriorated for firms associated with Danatbank after that bank experienced a large exogenous balance sheet shock that strongly affected the bank’s intermediation capital. On 11 May 1931, Danatbank discov-ered that its biggest creditor was on the verge of bankruptcy. The bank did not disclose this information, but its balance sheet capacity and trading ability were thereby severely constrained.
15
If banks were to maximize trading gains, a low price would be optimal. But as Lehmann (2011) shows, underwriter switching was not unusual and can be explained by a stock’s post-IPO performance. If it maximized trading gains, the bank risked losing its connected firm and the future revenues from it equity offerings.
16
The Danatbank had grown in importance after its merger with the National-bank in 1920. It was now the main lender for several German municipalities and an active underwriter. Its CEO, Jacob Goldschmidt, sat on more than a hundred supervisory boards. He enjoyed the public spotlight, and he made the trading business a top priority when he took over as CEO. Newspaper comments on the Danatbank’s active role in the stock market were frequent, and Goldschmidt himself commented on stock market issues in the bank’s annual reports. On the corporate business side, the Danatbank’s main client was the textile company Norddeutsche Wollkaemmerei und Kammgarnspinnerei, known as Nordwolle. This company was a family firm that had financed its expansion during the inter-war period with huge credits from Danatbank. In 1931, Nordwolle had credit of 48 million Reichsmark (RM) outstanding with the bank, a sum that amounted to 80 percent of Danatbank’s equity.17
During April 1931, Goldschmidt was alerted to the gradual withdrawal of money from German banks by foreign creditors (Ferguson and Temin 2001). If foreign withdrawals were to increase, then the liquidity of Nordwolle’s credit would be crucial for Danatbank.18 Bank employee Max Droehner therefore looked deeper into the books of Nordwolle. What was supposed to be a routine check brought disastrous news for Danatbank. Nordwolle had been falsifying its books since 1925. Most recently it had speculated on the rise of wool prices by purchasing a year’s supply, after which wool prices fell. Nordwolle did not dis-close the losses and it was on the edge of bankruptcy. Goldschmidt received this devastating news on 11 May 1931. A letter from Droehner confirms that Gold-schmidt immediately saw the consequences of Nordwolle’s likely bankruptcy: “Nordwolle goes down! Danat goes down! I go down!” That verbal response was the next day followed by a physical action. When the CEO of Nordwolle came to Danatbank’s headquarters Goldschmidt threw a chair at him.19
Although angry and fearful, Goldschmidt hesitated to reveal his discovery.20
17
For a more detailed description of the German banking crisis in 1931, see Born (1967).
18
This suspicion turned out to be true. After the bankruptcy of Nordwolle in June 1931, Danat-bank closed its offices at 12 July; that closing set in motion a run on other Danat-banks.
19
A detailed description of these events is given in a letter from Droehner to Georg Solmssen, in 1931 a member of the board of directors of the Deutsche Bank and Disontgesellschaft; that letter is held at the Historical Archive Deutsche Bank, file “Georg Solmssen”.
20
In his account of the events, Droehner stresses that Goldschmidt knew imme-diately the possible consequences if the bad Nordwolle news were to become public. Danatbank owned a huge package of Nordwolle stock and was also ex-tremely susceptible to creditor withdrawals. To save Nordwolle and his own bank, “during the ensuing weeks, Goldschmidt sought desperately to find means of supporting Nordwolle and refused to inform either the Dresdner Bank or the Reichsbank of the situation” (Feldman 1995). The Danatbank committed its financial resources to saving Nordwolle (Feldman 1995); in particular, a large offer of seasoned equity (some 30 million RM) was planned, with Danatbank as a major buyer of the new stock.21 If the information about Nordwolle were to become public, Goldschmidt wanted to maintain control of his bank’s stock price and prevent it from dropping. The stock price was the predominant indicator of a bank’s health and that of its creditors; a precipitous decline relative to other bank stocks would have led to rumors and possibly to revelation of the bank’s and Nordwolle’s problems. Goldschmidt was afraid to send any kind of negative signal to the market. After informing the managerial staff Danatbank’s about the Nordwolle fraud, he immediately went to the Berlin Stock Exchange. Gold-schmidt’s intention was to assure that any panic sales by his colleagues would not be noticed. As an institution, Danatbank accumulated large sums of its own stock over the course of May and June. At the time of its bankruptcy, it owned more than half of its total stock.
This strong commitment of funds to one firm put severe constraints on Danat-bank’s trading ability. After 11 May 1931, the bank was unable to provide liquid-ity to stocks of all the other firms of which it was connected. Hence this episode provides a setting in which a major trader suffers a large and exogenous shock to its liquidity-providing capacity.
No direct evidence has survived that Danatbank restricted funds to its trading business after it found out about Nordwolle’s problems. Even so the Danatbank reactions just described offer indirect evidence that the news about Nordwolle af-fected the bank’s balance sheet and limited its market-making abilities. Further-more, investment banking was a significant part of any large bank’s business— but it was also the most liquid part and so, if money was urgently needed, then
newspapers, published during this time, in which no news can be found (during May) regarding possible losses at Nordwolle.
21
this was the business section to supply it.22 Other ways to finance the Danat-bank’s role as a liquidity provider can be ruled out. Today banks can finance their trading operations through an interbank market; however, this form of financing was not developed in interwar Germany, where most financing went through the Reichsbank. No evidence can be found of an increase in Danatbank’s dealings with the Reichsbank, and neither did Danatbank ask other banks for help. Star-ing into the abyss in June and asked about the possibility of other banks steppStar-ing in, the proud Jacob Goldschmidt responded: “The people in the Mauerstrasse23 would feel triumphant because they think that I am finished. I will not give them the satisfaction of this triumph.”24 Other banks would have been reluctant to help in any case. Even after the Danatbank’s problems surfaced, no other bank offered to rescue it—a failure strongly criticized for example by the main bank-ing union: “The central directorate highly disapproves that the other big banks were not willing to prevent the shortage of cash of the Danatbank and all the related miseries, even with a guarantee of the Reich.”25 I focus on the month of May and stress that the information on Nordwolle was not disclosed. That the the situation remained a secret rules out several scenarios. First, other banks could not step in and provide either credit lines to Danatbank or liquidity to the distressed stocks at the same price that Danatbank had before. The secrecy of Nordwolle’s distress also rules out the possibility of other banks initiating preda-tory trading schemes (Brunnermeier and Pedersen 2005). With these channels shut down, I can reasonably attribute most of the findings reported here to the shock endured by Danatbank’s balance sheet.
Goldschmidt did not succeed with his rescue. On 17 June, Nordwolle pub-lished a short note stating that it might face some losses in the near future. In the three weeks of June during which rumors about Danatbank were circulating,
22
Between 1928 and 1930, German firms issued securities worth 2.87 billion RM that were intermediated by the five big banks in Berlin. In 1930, the investment banking division accounted for more than half of Danatbank’s total revenue. The bank’s heavy reliance on this business had its risks: in 1930, Danatbank had to write off stocks worth 10 million RM. In one of the first paragraphs in its annual report, the bank stated that “because of the development of the stock market the bank had to take large responsibilities to take care of the stock market, responsibilities we could not escape from.”
23
The Mauerstrasse was the street where the Deutsche Bank und Discontgesellschaft were lo-cated.
24Priester (1925), “Das Geheimnis des 13. Juli” p. 25 25
creditors withdrew 355 million RM. From this point forward, one can no longer assume that the information about Danatbank’s distress was private.
Having supplied the historical background necessary for this case study, in the next section I describe the data used and the construction of a liquidity mea-sure.
1.3
Data description
This study uses three main data sources: contemporary newspapers for stock market quotes; IPO prospectuses to establish the bank–firm connections; and contemporary books, stock trading manuals, and other archival sources for back-ground information and anecdotal evidence.
The main data source for identifying the bank–firm connections are files from theReichskommissar bei der Berliner B¨orse, which are held at the German Fed-eral Archives.26 Nearly 300 files of firms survived World War II; of these firms, 68 were still active in 1931.27 A firm file contains all prospectuses from the initial public offering and later seasoned equity offerings. A prospectus gives informa-tion about the underwriting banks. I use this informainforma-tion to identify firm–bank connections, where a firm is considered to be connected to a bank if it had one or two large banks. This source yields only 14 firms connected to the Danatbank, so I employ a second source—bank annual reports—to augment the sample. From 1927 onward, all Berlin banks reported their underwriting activities of the previ-ous year. If a firm had a public offering during the period 1927–1931, I connect it to Danatbank if that bank was the sole underwriter. This gives an additional 19 firms connected to Danatbank, resulting in a total sample of 87 firms (i.e., 33 connected and 54 not connected to Danatbank).28 For most of the empirical analysis, bank–firm connections are used to sort stocks into liquidity–provider specific portfolios. Every stock in a given portfolio has a common underwriter
26The files are listed in BAr R 3103
Abteilung H: Aktiengesellschaften.
27
On 3 February 1945, Berlin was attacked by nearly 1000 B-17 bombers of the Eighth Air Force. During this one and a half hour raid, led by Lieutenant-Colonel Robert Rosenthal, the Berlin Stock Exchange burned almost completely down.
28
bank and therefore a common liquidity provider on the Berlin Stock Exchange. Table 1.2 provides descriptive statistics of book values and dividends for 1930 by industry, which are taken from firms’ balance sheets in 1930. Table 1.3 shows the number of firms connected to each of the five banks.
I use firms connected to the Danatbank as a treatment group and firms con-nected to other banks as a control group. Comparing these two subsets (Table 1.2) shows that firms of the former are slightly smaller in size, though the me-dians are not statistically different. Because the shock is induced by a firm in the textile industry, it is important that textile companies not be overrepresented in the treatment group. The whole sample includes six textile companies, only one of which is connected to the Danatbank. Firms are disproportionately lo-cated in Berlin (in comparison with other German cities), which is reflected in the sample: about one fourth of the firms are situated there. Of the Danatbank-connected firms in the sample, 26 percent are located in Berlin; 24 percent of the other firms are located there. The remaining sample firms are situated all over Germany, with small clusters in the mining area around the river Ruhr. This distribution indicated that the firms in the treatment group are not geographically clustered in such a way that would bias the results.
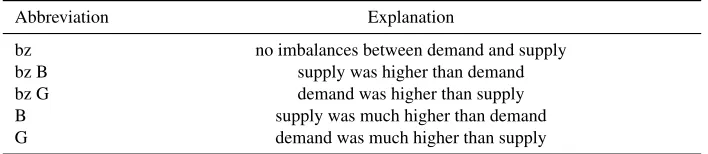
Daily stock market quotes are from the evening issues of theBerliner B¨orsen Zeitungbetween 1 November 1930 and 4 June 1931. In addition to prices, the Berliner B¨orsen Zeitungalso provides data on order imbalances: each price is followed by a “tag” describing differences in demand and supply. Table 1.4 sum-marizes the meanings of these tags.
History dictates the sample’s endpoint. Early in June 1931 Danatbank de-clined a credit to the city of Bremen, and on 5 June a Berlin newspaper pub-lished the first negative story about Danatbank. One day later, the newspaper was forced by Danatbank to publish a retraction, but rumors persisted. This sit-uation may have affected the stock prices of firms connected to Danatbank. In order to clearly identify the impact of a shock on the bank’s balance sheet, I limit my sample period to the time before 5 June 1931.
there are large order book imbalances, some traders are unable to fulfill their trading needs. This information is provided by the tags appended to the price quotes in German newspapers. Specifically, the existence of supply order book imbalances at the established price tells us that some sellers were unable to un-wind their positions. This conclusion accord with the results of Chordia et al. (2002), who find that “changes in liquidity are strongly associated with order imbalances.” My main measure of illiquidity is therefore a dummy variable set equal to 1 if there existed supply order imbalances—that is, for prices tagged ”b” or ”bb”—and set equal to zero otherwise.
1.4
A funding liquidity shock and market illiquidity
This section shows the effects of Danatbank’s constrained intermediation capi-tal on market liquidity. The frequency of supply order imbalances significantly increased for stocks connected to the Danatbank during May 1931. A difference-in-differences framework provides more evidence that this relationship between constrained intermediation capital and market illiquidity is causal, after which I show that this finding is robust to a wide range of robustness checks.
1.4.1 Frequency of illiquidity
A first glance at the data reveals how the order book imbalances of firms con-nected to the Danatbank behaved over time and how this behavior compares with that of firms connected to other banks. In Table 1.5, stocks are sorted into port-folios whose constituents have the same liquidity provider; the table shows the percentage of supply and demand order imbalances for each portfolio. Before 11 May, the Danatbank portfolio actually had a slightly lower frequency of sup-ply order imbalances than did the portfolios of other banks. To some extend, this difference reflects the importance that Danatbank CEO Jacob Goldschmidt assigned to the investment banking business. After 11 May, the frequency of illiquidity for the Danatbank portfolio nearly triples—rising from 6 percent to 23 percent—while the corresponding frequency for other banks’ portfolios does not change significantly.29 The Danatbank’s frequency of demand order imbalances declines after that date from 45 to 21 percent. This decrease can be understood
29
by recalling the quote of Wermert (1907) that “banks had a preference for excess demand.” This preference is evidenced by the high frequency of excess demand before May between 21 and 45 percent. Note also that posting limit buy orders ran the risk of being picked off, and once Danatbank became wealth constrained it stopped taking that risk.
Although these descriptive statistics tell us that illiquidity increased on av-erage during May 1931, they say nothing about the timing of that illiquidity. If different firms faced illiquidity at different times, then Danatbank’s constraints were unlikely to be the underlying reason. But if insufficient funding liquid-ity did play a role, then commonalliquid-ity in liquidliquid-ity should have increased and the stocks in the Danatbank portfolio should have become less liquid at about the same time. Figure 1.2 plots the proportion of illiquid stocks in the Danat-bank portfolio as compared with the Deutsche Bank portfolio (plotted values are based on a three-day moving average). Although practically identical be-fore May 1931, after that month the number of stocks becoming simultaneously illiquid is much higher for firms connected to Danatbank. This illiquidity was driven mainly by commonality after the Nordwolle–induced exogenous shock to Danatbank’s balance sheet.30
1.4.2 Order imbalances and market illiquidity: Baseline results
An increase in illiquidity and commonality in illiquidty deliver the initial evi-dence suggesting that the Danatbank’s constrained funding liquidity resulted in market illiquidity. In order to undertake a proper assessment of possible causal-ity, I employ a difference-in-differences approach in which the treatment group consists of firms connected to Danatbank and the control group consists of all other firms. The question to be answered is this: Were the shares of firms con-nected to Danatbank more likely to experience supply imbalances because of that bank’s liquidity constraints?
The baseline regression tests whether stocks of firms connected to Danat-bank underwent changes in May 1931 as compared with (a) preceding months and (b) the stocks of other firms. Assuming a linear functional form, I estimate
30
the regression
Imbalanceit=β1Danati+β2M ayp+β3(M ayp×Danati) +β4Xit+it
(1.1)
HereImbalanceitis an indicator variable set equal to 1 if the stock of firmihas
a supply order imbalance at timet(and zero otherwise). Danati is a dummy
for firms that are underwritten by no large bank(s) other than Danatbank.M ayp
is a dummy set to 1for the period p = DuringM ay (after 11 May) and to 0 for the period p = Bef oreM ay. We are mainly interested in β3, the
coeffi-cient for the interaction between the two preceding variables. After corrections for several fixed effects,β3captures the variation in illiquidity of the Danatbank
portfolio over time and across other portfolios. The matrix variableXincludes firm-specific dummies, industry dummies and time dummies.
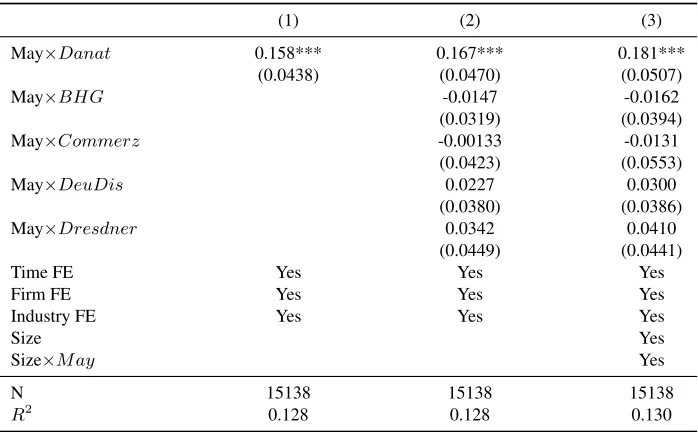
The main results are reported in Table 1.6. Qualitatively speaking, these results confirm the findings of the descriptive statistics: the Danatbank portfo-lio had a significantly higher probability of being illiquid during May 1931. The simple linear probability model predicts that, during May 1931, stocks connected to Danatbank were 15 percent more likely to have supply imbalances than stocks connected to other banks. In light of studies establishing that liquidity and liq-uidity risk are important pricing factors (Pastor and Stambaugh 2003, Acharya and Pedersen 2005), this amount of increase would have had significant pricing implications once it became known to the market.
These results are based on comparisons of two sets of firms: those connected to the Danatbank and those connected to other banks. Yet averaging over differ-ent liquidity providers may have biased the results. If other banks all behaved differently, then the respective effects may have cancelled each other out. To address this concern, I use the complete set of bank–firm connections and cre-ate bank-specific dummies for each of the five big banks. I then estimcre-ate the following linear model:
Imbalanceit=β1×Banki0+β2M ayp+β3×(M ayp×Bank0i) +β4Xit+it,
(1.2) where Banki is a dummy row vector that includes the indicator variables for
all five big banks. The coefficients of interest are within the vectorβ3, which
contains the interaction coefficients of the single banks:
. Our prior is that the probability of excess supply should increase for firms con-nected to Danatbank after 11 May andβ3Danat > 0. Column (2) of Table 1.6 gives the results for the interaction terms; the other coefficients are omitted for clarity. In this linear model the point estimate is close to that from the simpler model estimated previously: the probability of imbalances increases by about 17 percent for a firm connected to Danatbank during May 1931. Controlling for firm fixed effects, industry fixed effects, and time fixed effects does not change the results; neither does clustering the standard errors across different groups.31
The results of the baseline regression are not affected by averaging over dif-ferent liquidity providers. The same concern might arise along the time–series dimension, so we need to establish that May 1931 was the only exceptional month for the Danatbank portfolio. Towards this end, I perform a stringent test to see whether stocks connected to Danatabank behaved differently only when that bank was constrained. The baseline regression is given by
Imbalanceit=β1Banki+β2M onthp+β3(M onthp×Banki) +β4Xit+it
(1.4)
Table 1.6 reports results for the case whenBank =DanatandM onth=M ay, but now I estimate this equation for every possible bank–month combination. The results of this placebo test are displayed in Figure 1.3, which plots the re-gression coefficientβ3 for each of the possible regressions and shows (on the
x-axis) which month was used as the placebo period. In only 6 out of the 35 possible regressions was the interaction’s coefficient significantly different from zero. More importantly, two coefficients stand out. When the regression is per-formed using Danatbank firms during either May or June, the coefficients are not only significantly different from zero but also significantly larger than all other coefficients in this placebo test.
1.4.3 Order imbalances and illiquidity: Extensions
The baseline results have established a causal link between Danatbank’s reduced funding liquidity and a decrease in market liquidity. This section discusses the
31
robustness of these results to non-linear regression models, firm size, informa-tion on firm fundamentals, and other factors. It provides a more detailed look at the illiquidity of the Danatbank portfolio and shows which of its constituent stocks inside the portfolio are mainly responsible for the observed illiquidity.
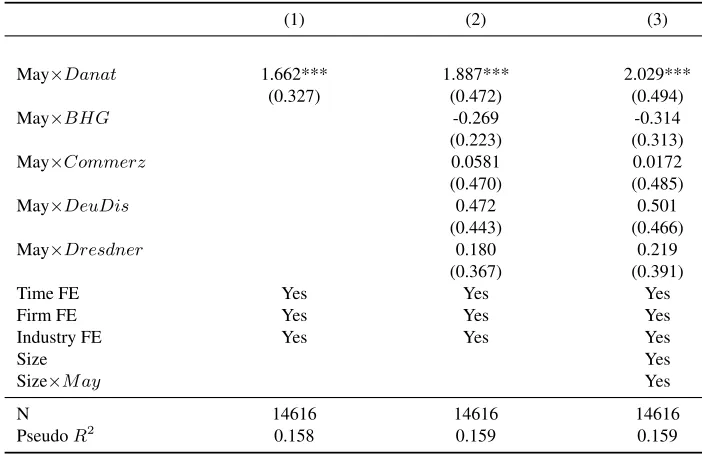
The first concern about the robustness of the results is the assumption of a linear model. Although easy to interpret, a linear model has its shortcomings; in particular, a linear model restricts the parameter estimates because it is not bounded between 0 and 1. Nonlinear models can circumvent this problem. Most of the variation in the dependent variable is captured by variation across time, which suggests a fixed–effects logit setup. The results, reported in Table 1.7, are qualitatively the same as those derived from the linear probability model. Taking a logit model without fixed effects, the predicted probability of a sup-ply imbalance before May 1931 is 6 percent for a firm connected to Danatbank before May 1931. However, that probability increases by 15 percentage points (to 21 percent) during May 1931, which is similar to the results from the simple frequency counts. When this model is used to evaluate other firms during May 1931, the predicted probability is only 11 percent. Thus, firms connected to the Danatbank have a much greater likelihood of experiencing imbalances in May 1931 when compared with the previous months and also when compared with other firms during May 1931.
Column (2) of Table 1.7 shows the results from logit estimations of the in-teraction model.32 The average marginal effect for the interaction term, 20 per-cent, is even larger than the one under the simple model. If fixed effects are excluded, the predicted probability of a supply imbalance for a Danatbank firm is 5.8 percent—a value close to that obtained under the previous model. The probability increases almost threefold, by 16 percentage points, during May. We can compare this increase to that for a firm connected to the Deutsche Bank. For such a firms, the predicted probability is 10 percent before May. During May, this probability increases by just a single percentage point, an increase that is not statistically different from zero. Thus the richer framework does not alter the conclusion derived from the baseline model: illiquidity of Danatbank–connected firms surged during May 1931.
A further concern for the robustness of the results is firm size. The Danat-bank portfolio includes relatively smaller firms, which are known to be riskier
32
and more volatile; hence the results might be driven by an increase in the volatil-ity of small–firm shares during May 1931. To deal with this concern, I group the stocks into ten size classes according to their book value. I then estimate both the linear probability model and the logit model while including dummies for each size class. Each size dummy is also interacted with the indicator variable for May 1931. The results are given in column (3) of Table 1.6 and Table 1.7 for the linear and non-linear model, respectively. These results are not driven by differences between small and large firms and the previous conclusions still hold.
Firms differ not only in size but also in the number of their underwriting banks. Several firms had two or more large underwriting banks. Even though the lead underwriter had the most responsibility, the other banks also participated in the unofficial market making. I use these observations to strengthen further the finding of illiquidity for Danatbank–connected firms. When the Danatbank was unable to provide liquidity, stocks of firms with an additional underwriter should have exhibited a smaller increase (or none at all) in market illiquidity. To test this hypothesis, I restrict the sample to firms for which Danatbank was one of the main underwriting banks. Table 1.8 reports the results for a regression of imbalances on a dummy set equal to one only if the Danatbank was the sole underwriter and on the interaction of this dummy with the May dummy (Column 1). Column (2) reports a similar regression in which the dummy variable is set to 1 if a firm had two or three large underwriting banks. Column (3) reports all ef-fects jointly. During May 1931, order imbalances increased only for cases where the Danatbank was the only underwriter; if a firm had one or two additional underwriting banks, the effect vanished. That is, other underwriters were still able to provide market–making services. These results shed light on which firms within the Danatbank portfolio drive the previously reported findings—namely, those firms that were most closely connected to Danatbank.
es-timate the conditional variance for each stock using a Garch(1,1) model. Using the average before May 1931 of the estimated variances, I separate the stocks into quartiles. Table 1.11 reports the results of a fixed–effects regression of supply imbalances on the May dummy—performed for each variance quartile separately. In Panel A of this table the sample is restricted to firms connected to Danatbank. The coefficients are increasing over the variance quartiles, and stocks with a higher average variance were more likely to experience illiquidity during May 1931. Neglecting the first (insignificant) coefficient, a simple t-test confirms that the May dummy coefficient for the fourth quartile is significantly different from the coefficients for the second and third quartile. This effect is not evident for firms connected to other banks (Panel B).
The main results have thus been shown to be robust as regards firm size. I have demonstrated that only the Danatbank that are different and that illiquid-ity surges only in May. Despite these findings, it is still possible the results are driven by shocks to fundamentals of the firms connected the Danatbank. One main identifying assumption is that the exogenous shock to Danatbank was un-known to other market participants during May 1931. Bad news about Danat-bank could influence investors’ outlook about firms connected to the Danat-bank, since those firms could find it more difficult to obtain credit from that bank in the future. It is well established among historians that the shock to Danatbank’s bal-ance sheet was initially a well-kept secret; however, it is still necessary to rule out the possible effects of firm-specific news, rumors, and speculations must be ruled out. Contemporary newspapers provide at least anecdotal evidence that firm news is not driving the results. Figure 1.4 shows an accumulated monthly news count for Danatbank firms for the period February–May 1931. News items are counted in the national newspaperVossische Zeitung.33 No significant differ-ence between May and other months is observed.
No newspaper or weekly publication ran any story on the Danatbank itself during the period in question, and the Danatbank’s share price also indicates that the Nordwolle-induced shock was unknown to the public. Figure 1.5 plots the share prices of all Berlin big banks before and during May 1931. Owing to the fall of the Oesterreichische Credit-Anstalt and some foreign withdrawals, bank stocks as a group trended downward in May. But all prices moved in lockstep
33
and, in the eyes of the market, the Danatbank was no different than other banks. Note that the Danatbank returns are not significantly different from the returns of other banks. Furthermore, Ferguson and Temin (2001) examine bank balance sheets and argue that deposit outflows were no cause for concern even during May. Early summer 1931 was a turbulent period in Germany. Although Danat-bank was the focus of the Danat-banking crisis that emerged in June, during May 1931 it was not receiving any special attention.
Absent firm–specific news, fire sales by Danatbank itself could have been the source of the order imbalances. A huge literature on asset fire sales indicates that a distressed trader might sell his assets at depressed prices.34Did the Danatbank sell stocks from its own portfolio, thus making the bank itself the source of the order imbalances? Unfortunately, detailed portfolio data before the 1931 bank crisis is not available. After 1931, theDeutsche Revisionsgesellschaftexamined Danatbank more closely, providing a detailed list of the portfolio as of December 1931. One third of the firms connected to the Danatbank were still in the port-folio and so, for two-thirds of the stocks, the possibility of fire sales cannot be ruled out with certainty. Nevertheless, the following tests suggest that fire sales are not the main cause of the order imbalances.
Accounting standards gave banks ample room to choose which stock price to report in their balance sheets. If a stock price was higher than the nominal value, banks could at most value the stock at its nominal value. But if a price was lower than the nominal value, banks could opt for the lower value or any other price up to the nominal value. Banks normally accounted stocks at their nominal value and devalued them only in extreme cases (as in 1932, after all stocks had severely fallen in value during the second half of 1931). If a bank sold assets below their nominal value, its balance sheet declined. Inspecting the monthly balance sheets of Danatbank establishes that the equity position hardly changed during the first half of 1931.
Assuming that assets were booked at their nominal value, Danatbank should have sold any assets with prices above their nominal value because doing so would have improved their balance sheet position. Conversely, sales of assets at prices below their nominal value would have resulted in balance sheet deteri-oration. A distressed trader does not want to send such a signal to the market. Given these suppositions, we can test indirectly for the occurrence of fire sales by checking for whether assets priced above their fundamental value exhibited
34
greater imbalances than did other assets in the Danatbank portfolio. For this test, the sample is restricted to stocks connected to Danatbank. I create a firm– specific dummy set to 1 if the price on 1 November 1930 is greater than the nominal value; the regression results are reported in column (1) of Table 1.9. The interaction term with the May dummy shows that stocks with higher prices were less likely to see imbalances during the period of financial distress. This result holds also when the price at the beginning of the sample is directly inter-acted with the May dummy (Column 2). Hence there were nor fire sales of the stocks Danatbank most likely would have sold first.
Moreover, Danatbank’s 1930 annual report stresses the bank’s reluctance to sell assets at prices below nominal value:“The unusually strong decline at the stock market...prohibited the liquidation of a big part of ongoing transactions.”
In view of these indirect test and anecdotal evidence, it is doubtful that fire sales originating with Danatbank were the main drivers of the observed supply imbalances. Order imbalances seem rather to have been driven by demand-side considerations (i.e., funding liquidity). The next section addresses the behavior of asset returns during these times of market illiquidity.
1.5
Funding liquidity and price reversals
1.5.1 Prices and volatility
When prices deviate from fundamentals and rebound, volatility increases. This dynamic increases the uncertainty of investors and renders liquidity risk a main pricing factor (Acharya and Pedersen 2005). After describing the average stock price behavior, this section establishes that—in response to increased market illiquidity, stocks connected to the Danatbank became more volatile during May 1931.