Clinical and basal aspects of
anemia during antiviral therapy for hepatitis C
Hanneke van Soest,* Willem Renooij,** Karel J. van Erpecum*Depts. of Gastroenterology and * Hepatology and ** Surgery University Medical Center Utrecht, Utrecht, The Netherlands.
ABSTRACT
Backgroundand Rationale. Anemia is a major side effect of combination therapy for chronic hepatitis C. In this study, severity, potential risk factors for and potential underlying mechanisms of anemia were evalua-ted. Patients and methods. 44 chronic hepatitis C patients on interferon-ribavirin treatment were inclu-ded. Anemia-related parameters were measured before and during treatment. Potential changes in membrane phospholipids composition of erythrocytes of patients on anti-viral treatment and potentially increased erythrocyte susceptibility to osmotic or bile salt induced stress were explored. Results. Anemia was almost universal during treatment, with evidence of hemolysis. Decrease of Hb after six months of the-rapy was 2.1 ± 0.1 mmol/L (range -0.6-4.1). Higher pre-treatment Hb, highest ribavirin dose (15-17.5 mg/kg) and lower pre-treatment platelet level were independent risk factors for decrease of Hb. Serum erythro-poietin levels increased during treatment with negative correlation to Hb levels at week 12 (r = -0.70, p = 0.002) and 24 (r = -0.72, p = 0.002). Erythrocyte membrane phospholipid composition did not differ bet-ween anemic patients and healthy controls. Also, resistance to osmotic or bile salt induced stress was normal in anemic patients. Phosphatidylserine exposure at the outer membrane leaflet did not change upon 24 hrs ex vivo incubation with pharmacological ribavirin concentration. Conclusions. Anemia is al-most universal during anti-HCV treatment. The extent of anemia correlates with pre-treatment levels of thrombocytes and Hb and with high ribavirin dosing. Although we found hemolysis as contributing factor, our data do not indicate that altered membrane phospholipids composition is an important factor in pa-thogenesis of anemia.
Key words. Erythropoietin. Interferon. Ribavirin. Hemolysis. Phospholipid.
Correspondence and reprint request: Dr K.J. van Erpecum Dept. of Gastroenterology and Hepatology F 02. 618 University Medical Center Utrecht
P.O. Box 85500, 3508 GA Utrecht, The Netherlands Phone: +31 88 7557004, Fax: +31 88 7555533 E-mail: [email protected]
Manuscript receive: July 27, 2009 Manuscript accepted: October 4, 2009 INTRODUCTION
Chronic hepatitis C is a life-shortening disease as-sociated with significant morbidity and decreased quality of life. Current treatment (PEG-interferon and ribavirin) achieves a sustained response in 50-90% of cases, depending on hepatitis C virus (HCV)
genotype.1,2 Treatment may cause anemia, requiring
dose-reduction or even discontinuation of therapy in
up to one third of patients.3 The cause of anemia is
probably multifactorial: interferon might suppress bone marrow regenerative activity of erythroid
pro-genitor cells and inhibit erythropoietin
produc-tion.4,5 Also, ribavirin may induce dose-dependent
hemolytic anemia.6-8 Ribavirin is converted into
ri-bavirin-mono-, di- and triphosphate in all cell types but subsequent dephosphorylation back to ribavirin occurs exclusively in nucleated cells, not in erythro-cytes. Accumulated phosphorylated ribavirin deriva-tes within the erythrocyte might lead to relative intracellular adenosine triphosphate (ATP)
deple-tion,9-12 impaired antioxidant defense and possibly,
premature removal from the circulation.13
The major structural phospholipids of the erythrocyte membrane outer leaflet are phosphati-dylcholine and sphingomyelin. Phosphatidylserine, phosphatidylethanolamine and phosphatidylinositol
are mainly located in the inner leaflet.14-17 Such
membrane asymmetry, dependent on flippase activi-ty, is essential for membrane integrity and cellular
function.18-20 Increased intracellular ribavirin could
Materials
Taurocholate was obtained from Sigma Chemical Co. (St. Louis MO, USA) and yielded a single spot upon thin-layer chromatography (butanol-acetic acid-water, 10:1:1 vol/vol/vol, application of 200 µg
bile salt). 3α-Hydroxysteroid dehydrogenase for the
enzymatic measurement of bile salt concentrations22
and TRIS-HCl were purchased from Sigma. The An-nexin V-fluorescein isothiocyanate (FITC) apoptosis detection kit was obtained from BD Pharmingen
(San Diego CA, USA). 1-β
-D-ribofuranosyl-1,2,4-tria-zole-3-carboxamide (ribavirin) was obtained from Sigma. All other chemicals and solvents were of ACS or reagent grade quality.
Clinical measurements
Hemoglobin (Hb) levels were quantified by stan-dard assay at baseline, at 1, 2, and 4 weeks after start of therapy and thereafter every four weeks du-ring the entire study period. Anemia was defined as Hb < 7.4 mmol/L for females and < 8.6 mmol/L for males. Clinical anemia-related parameters were de-termined by standard assays before and after 12 wee-ks of anti-viral therapy. HCV RNA was tested by quantitative polymerase chain reaction (PCR) (Ro-che Amplicor HCV monitor Kit v2.0) and values > 800.000 IU/mL were considered high viral load. HCV genotype was determined using Innolipa. (In-nolipa HCV II, Innogenetics, Ghent, Belgium).
Serum erythropoietin (sEPO) was quantified befo-re, 12 and 24 weeks after start of therapy anti-viral treatment in a subgroup of 16 patients. Serum erythropoietin was measured using a chemilumines-cent enzyme-labeled immunometric assay (Immunoli-te® EPO, Diagnostic Products Corporation (DPC, Los Angeles CA, USA)). The lower limit of detection for serum erythropoietin was 0.24 mU/mL and
va-lues between 3-20 mU/mL were considered normal.23
To determine whether the serum erythropoietin res-ponses to the decreasing hematocrit were normal in our patients, their values were compared with the normal human response to anemia defined by
the equation logEPO 4.609 8.7xHt.24,25
Hemolysis induced by hypotonic solutions or taurocholate
Resistance of erythrocytes against osmotic and bile salt-induced stress of fresh human erythrocytes of anemic hepatitis C patients after twelve weeks of anti-viral treatment (Hb 6.2 ± 0.6 mmol/L) and circulation. In this study, we explored potential
changes in erythrocyte membrane phospholipid com-position and susceptibility to osmotic or bile salt in-duced stress in anemic hepatitis C patients on anti-viral treatment. We also determined serum erythropoietin levels in a subgroup of patients and related these to various clinical parameters of anemia.
METHODS
Patients
44 treatment naive chronic hepatitis C (CHC) pa-tients participating in a multicenter, randomised placebo-controlled trial comparing standard therapy (interferon/ribavirin combination therapy) with an experimental triple regimen (interferon/ribavirin and amantadine), were included in this study. All patients provided written informed consent and the protocol was approved by the medical ethical com-mittee of the UMC Utrecht. Baseline patient charac-teristics are given in Table 1. 36% of patients had severe fibrosis or cirrhosis corresponding with
Me-tavir score F3-F4.21 Treatment consisted of
weight-based ribavirin (Rebetol®, Schering Plough B.V.
Maarssen, The Netherlands: 1,000 mg/day in case of body weight < 75 kg, 1,200 mg/day in case of body
weight > 75 kg) and interferon (Intron A®, Schering
from healthy controls (Hb 8.4 ± 0.3 mmol/L) was
determined as described in detail before.26,27
Phospholipid composition of the erythrocyte membrane
Fresh erythrocytes (aliquots of 10 mL blood) were sedimented three times by centrifugation du-ring 15 min. at 3,000 rpm. After discarding the plas-ma and the buffy coat, membrane phospholipids were extracted from the erythrocytes according
to Reed.28 After separation by thin layer
chromato-graphy (chloroform:methanol:acetic acid:water 50:25:8:3 vol/vol/vol/vol), phospholipid contents of separated spots were quantified according to
Rouser.29
Exposure of phosphatidylserine and hemolysis after ribavirin incubation
Phosphatidylserine normally localizes to the inner leaflet of erythrocyte membranes but becomes expo-sed to the cell surface in pathologic or aged cells,
with subsequent removal from the circulation.30-33
Annexin V is a calcium-dependent phospholipid-bin-ding protein that exhibits a high affinity for cell membranes exposing phosphatidylserine on the outer
leaflets.34 Fresh erythrocytes of normal volunteers
were incubated during 15, 30, 45, 60, 240 min and 24 h at 37 °C with solution containing 3.125 µg/mL riba-virin in order to mimic a therapeutic concentration
of ribavirin in the tube (2.5 µg/mL).9 After addition
of FITC labelled annexin V, phosphatidylserine expo-sure was meaexpo-sured by quantifying fluorescence in a Becton Dickinson Fluorescence Automate Cell
sor-ter.35 During all incubations hemolysis was assayed
by measuring absorbance of hemoglobin in the
super-natant at 540 nm.36
Statistics
Values are expressed as means ± SEM or in case of non-parametric distribution, as medians (range). Differences between groups were tested with unpai-red t-tests or Mann Whitney-U tests as appropriate. Differences between pre-treatment and on-treatment data were tested with paired t-tests or with repeated measurement ANOVA. Correlation between parame-ters was tested for statistical significance by Pear-son correlation tests or Spearman Rank test in case of non-Gaussian distribution. In order to identify risk factors for Hb decrease during the first 24
wee-ks (∆Hb), univariate and multivariate linear
regres-sion analyses were performed. Coefficients are expre-ssed with 95% confidence intervals (C.I.). First, de-terminants were examined in univariate analysis. Only determinants with coefficients significant at the 0.2 level were included in subsequent multivaria-te analysis. In multivariamultivaria-te analysis, smultivaria-tepwise re-gression procedure was used. A two-sided p-value < 0.05 was considered statistically significant.
RESULTS
Anemia during antiviral therapy
Mean pre-treatment level of hemoglobin was 9.2 ± 0.1 mmol/L. During antiviral treatment, mean hemo-globin decreased 2.6 ± 0.1 mmol/L (28%, range 11-44%) if pre-treatment Hb level was compared to lowest Hb level at any time point during treatment. 98% of patients developed anemia during antiviral therapy (see Methods for definitions), and 27 pa-tients (61%) experienced a drop of hemoglobin of at least 2.5 mmol/L. Nevertheless, no dose-reduction was required for anemia in any patient. Since there was no difference between amantadine and placebo groups in extent of anemia or any other parameter of poten-tial relevance, these groups are reported together in the following. Hb levels started to decline two weeks after the first medication was taken and minimum values were reached after a median of 24 (range 2-52)
weeks (Figure 1). Mean ∆Hb, defined as difference
Table 1. Baseline characteristics in treatment naive patients with chronic hepatitis C.
Variable
n 44
Age (yrs) 45 ± 1.4 (28-66)
Male/Female ratio 35:9
Amantadine/Placebo 22:22
Weight (kg) 78.5 ± 2.3 (40-134)
Genotype 1/non-1 (% of patients) 21:23 (48:52) High viral load* (% of patients) 57
ASAT (U/mL) 76 ± 6 (28-226)
ALAT (U/mL) 111 ± 9 (22-260)
Albumin (U/L) 40 ± 1 (28-46)
Prothrombin time (sec) 12.4 ± 0.1 (10.5-14.5) Bilirubin (mmol/L) 12 ± 0.7 (6-28)
Hemoglobin (mmol/L) 9.2 ± 0.1 (7-10.3) Platelets (x109/L) 223 ± 10 (109-406)
Severe fibrosis/cirrhosis (% of patients) 36 Histological activity index 2.8 ± 0.3.
Renal clearance** (mL/min) 113 ± 4 (45-182)
between pre-treatment Hb and Hb at 24 weeks, was
2.1 ± 0.1 mmol/L. ∆Hb was not different between
pa-tients with or without severe fibrosis/cirrhosis, bet-ween genotype 1 and non-1 patients or betbet-ween
patients with 1,000 and 1,200 mg ribavirin/day. ∆Hb
did not correlate with age, transaminases or
histolo-gical activity index. Although ∆Hb was greatest in
patients with highest weight-based dose of ribavirin,
∆Hb did not differ significantly (p 0.44) between
the various ribavirin doses (2.2 ± 0.2 mmol/L, 2.1 ± 0.2 mmol/L and 2.5 ± 0.2 mmol/L in groups with
ri-bavirin < 13.5 mg/kg/day, 13.5-15 mg/kg/day and 15.1-17.5 mg/kg/day). Determinants associated with
greater ∆Hb at the 0.2 level in the univariate
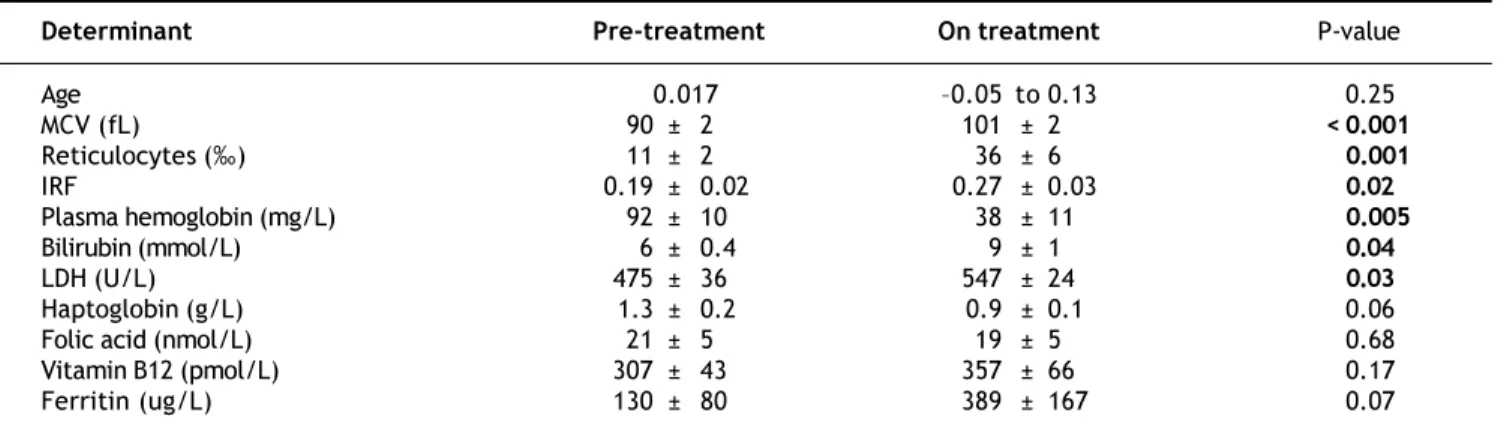
regres-sion analysis were: weight, highest ribavirin dose (15-17.5 mg/kg), higher pre-treatment level of Hb, lo-wer viral load and lolo-wer pre-treatment platelet level (Table 2A). Multivariate analysis identified only hig-her pre-treatment Hb, highest ribavirin dose (15-17.5 mg/kg) and lower pre-treatment platelet level as inde-pendent risk factors for decrease of Hb (Table 2B). As shown in Table 3, significant differences between pre- and 3 month treatment levels of mean corpuscu-lar volume (MCV), of reticulocytes, immature reti-culocyte fraction (IRF), plasma hemoglobin, bilirubin and lactate dehydrogenase (LDH) were found. Me-dian pre-treatment level of serum erythropoietin mea-sured in a subgroup of 16 patients, was 8 (5-48) mU/ mL, increased to 51 (13-326) mU/mL after 12 weeks and to 67 (7-1590) mU/mL after 24 weeks of treat-ment (Figure 2A: p < 0.001). Baseline levels of serum erythropoietin were not associated with baseli-ne levels of Hb or hematocrit (r -0.23, p 0.37 and r -0.32, p 0.21 respectively). In contrast serum erythropoietin levels at 12 and 24 weeks after start of treatment were negatively correlated with si-multaneous Hb and Ht levels (r -0.7, p 0.002 and r -0.78, p 0.0004 for Hb and Ht levels at week 12: r -0.72, p 0.002 and r -0.79, p 0.0002 for Hb and Ht levels at week 24).
Also, ∆sEPO (sEPO at 24 weeks - pretreatment
sEPO) correlated positively with ∆Hb (r 0.5,
Table 2B. Independent factors associated with an increase in ∆Hb in multiple regression analysis.
Determinant Coefficient 95% C.I. p-value
Ribavirin 15-17.5 mg/kg 0.6080.109 to 1.108 0.018
Platelets pre-treatment 0.004 0.008to 0.001 0.017
Hb pre-treatment 0.677 0.211 to 1.144 0.005
Table 2A. Univariate regression analysis of determinants associated with an increase in ∆Hb.
Determinant Coefficient 95% C.I. pvalue
Age 0.017 0.05 to 0.13 0.25
Viral load 7.8E8 2.0E7 to 4.0E-8 0.19
ASAT 0.002 0.009 to 0.005 0.59
ALAT 0.002 0.007 to 0.003 0.50
Weight 0.0180.035 to 0.001 0.04
Ribavirin <13.5 mg/kg 0.0680.713 to 0.578 0.83
Ribavirin 13.5-15 mg/kg 0.117 0.448to 0.682 0.68
Ribavirin 1517.5 mg/kg 0.579 1.132 to 0.025 0.04
Platelets pretreatment 0.004 0 to 0. 008 0.06
Hb pretreatment 0.6481.037 to 0.259 0.002
Figure 1. Box Whisker plots of hemoglobin levels during an-tiviral treatment for hepatitis C (N = 40; patients who were treated during 52 weeks). One way repeated measured ANOVA reveals a significant Hb decrease during therapy (p < 0.0001).
12
10
8
6
4
Hemoglobin
(mmol/L)
0 1 2 4 8 12 24 36 48 52
Table 3. Mean clinical anemia-related parameters before and during treatment.
Determinant Pre-treatment On treatment P-value
Age 0.017 0.05 to 0.13 0.25
MCV (fL) 90 ± 2 101 ± 2 < 0.001
Reticulocytes () 11 ± 2 36 ± 6 0.001
IRF 0.19 ± 0.02 0.27 ± 0.03 0.02
Plasma hemoglobin (mg/L) 92 ± 10 38± 11 0.005
Bilirubin (mmol/L) 6 ± 0.4 9 ± 1 0.04
LDH (U/L) 475 ± 36 547 ± 24 0.03
Haptoglobin (g/L) 1.3 ± 0.2 0.9 ± 0.1 0.06
Folic acid (nmol/L) 21 ± 5 19 ± 5 0.68
Vitamin B12 (pmol/L) 307 ± 43 357 ± 66 0.17
Ferritin (ug/L) 130 ± 80 389 ± 167 0.07
MCV: Mean corpuscular volume. LDH: Lactate dehydrogenase. IRF: Immature reticulocyte fraction.
p 0.047) and inversely with pre-treatment level of
Hb (r -0.8, p 0.001). ∆sEPO was not different
between patients with or without histologically pro-ven severe fibrosis/cirrhosis, between genotype 1 and non-1 patients or between males and females. Com-paring the normal human response to anemia with the response in our population, no significant diffe-rences in the slope of hematocrit (x) versus logEPO
(y) (-8.7 versus -8.7) and y-intercept (4.719 vs.
4.609) (Figure 2B) were found.
Effect of osmotic and
bile salt induced stress on hemolysis
In Figure 3, hemolysis of erythrocytes induced by hypotonic buffer is shown for hepatitis C patients with anemia due to anti-viral treatment and for healthy controls. In TRIS-buffer solutions with con-centrations ranging from 150 to 110 mM, hemolysis proved to be negligible. Hemolysis increased progre-ssively at lower concentrations. Nevertheless, no
di-Figure 2. A. Serum erythropoietin levels of individual pa-tients (N = 16) before and during antiviral treatment. Bars indi-cate median values at various time points. * p < 0.001 compared to basal. B. Relationship between serum erythro-poietin and hematocrit levels (r = -0.88, p < 0.0001) in our po-pulation. For comparison, the regression line ()of the normal compensatory erythropoietin response to anemia defined by the equation logEPO = 4.609-8.7xHt (see ref 24 and 25) is also shown.
A
10,000
1,000
100
10
1
Erythropoeitin
(mU/ML)
Week 1 Week 12 Week 24 Duration of antiviral treatment
B 5
4
3
2
1
0
0.00 0.10 0.20 0.30 0.40 0.50
Hematocrit
Log10
Erythropoietin
(mU/mL)
r = -0.88, p<0.0001
fference was found in osmotic resistance pattern bet-ween erythrocytes of anemic patients and healthy controls.
Although low concentrations of taurocholate
ex-hibited no effects, incubation with ≥ 15 mM of this
detergent bile salt induced progressive dose-depen-dent hemolysis. Again there were no differences bet-ween erythrocytes of anemic patients and healthy controls (results not shown).
Phospholipid composition of the erythrocyte membrane
No differences in the phospholipid composition of the red cells membranes or in the sphingomyelin (SM)/phosphatidylcholine (PC) ratio were found bet-ween healthy controls and anemic hepatitis C pa-tients on antiviral treatment. Sphingomyelin comprised 27.3 ± 0.7% and 25.1 ± 1% of total cell membrane phospholipids in hepatitis C patients and controls (P NS). For phosphatidylcholine, these values were 32.7 ± 0.7% and 34.9 ± 1.7%, for phos-phatidylinositol/phosphatidylserine 14.1 ± 0.8% and 12.7 ± 0.3%, and for phosphatidylethanolamine 25.9 ± 1% and 27.2 ± 1.3% respectively (all not sig-nificantly different).
Annexin V assay
Phosphatidylserine exposure on the outer leaflet of the erythrocyte was not detected after incubation up to 24 h with pharmacologically relevant ribavirin
concentrations. Hemolysis after 24 h incubation with ribavirin and TRIS-buffer solution was respec-tively 5% and 6%.
DISCUSSION
Specific risk factors for developing anemia during antiviral therapy for hepatitis C are not well esta-blished. We found in our multivariate analysis, hig-her pre-treatment Hb level, lower pre-treatment platelet count and highest dose of ribavirin (> 15 mg/kg/day) to be independent factors associated with greater decreases of Hb. The correlation between pre-treatment Hb level and extent of Hb decrease
du-ring therapy has been described before37,38 and could
be the consequence of the fact that a certain more or less fixed fraction of all circulating erythrocytes might be removed from the circulation during a cer-tain time period during therapy. In line with
previo-us data,38 greater ∆Hb was associated with lower
pre-treatment platelet level, but not with histologi-cally proven severe fibrosis/cirrhosis. One may spe-culate that low thrombocyte levels are a more sensitive marker for severe liver disease than liver biopsy. Indeed, thrombocytopenia is generally the first hematological abnormality to occur in patients
with cirrhosis.39
Recent data suggest increased platelet breakdown in chronic liver disease and cirrhosis, and to a les-ser extent decreased platelet production and platelet
dysfunction.40 Total ribavirin dose per day was not
associated with magnitude of Hb decrease, and there
were no significant differences in ∆Hb between
sub-groups with low, intermediate or high weight-based ribavirin dose. This may be explained by the fact
that there is a threshold ribavirin dosage of ≥ 1000
mg/day for development of anemia.41 In our study all
patients received at least 11.2 mg ribavirin/kg bo-dyweight and no patient had a dose of less than 1,000 mg/day. Nevertheless, in our multiple regres-sion analysis, ribavirin dose > 15 mg/kg/day proved to be an independent factor associated with greater
∆Hb, in line with another recent study.42 Our study
focused on baseline predictive factors for extent of anemia during antiviral treatment. It was recently reported, that early on-treatment extent of Hb-decli-ne (after 2-4 weeks of therapy) can predict extent of
anemia during the subsequent treatment period.43,44
We found in a post-hoc analysis in the current stu-dy, a highly significant correlation between Hb-de-cline after 2 (r 0.63, p < 0.0001) and 4 weeks (r 0.71, p < 0.0001) of therapy and maximal de-crease of Hb during the entire study period, thus 100
75
50
25
0
150 130 110 90 70 60 30
Concentration TRIS-buffer (mM)
Lysis
(%
of
total)
Figure 3. Resistance (mean ± SEM) against osmotic stress of erythrocytes obtained from anemic patients during antivi-ral therapy for hepatitis C does not differ from healthy con-trols.
confirming the previous reports. In the current stu-dy we found clear evidence of hemolysis, with eleva-ted levels of bilirubin and LDH and decreased haptoglobin levels. Serum ferritin levels also
increa-sed, in line with previous studies.45 So far there are
conflicting results in the literature about serum erythropoietin response during interferon-ribavirin
therapy.25,37,46 This issue has considerable clinical
relevance, since erythropoietic growth factors are used to increase hemoglobin levels and to reduce the
need of ribavirin dose reductions.47,48 Our results
show no correlation between logEPO levels and Ht in non-anemic patients before treatment but during the anemic period there was a significant inverse co-rrelation between these parameters up to 24 weeks after initiation of therapy. Previous studies exami-ned this correlation for shorter periods of maximal
12 weeks.25,37,46 Based on comparison with the
nor-mal human response to anemia, our data would sug-gest that serum erythropoietin response could be adequate in patients with anemia during antiviral therapy (Figure 2B). Since all available studies are hampered by relatively small patient numbers with severe anemia, and considering the appreciable in-ter-individual variation in normal serum
erythro-poietin response to anemia,49 further research is
warranted on this issue.
We did not find changes of erythrocyte membrane phospholipid composition or decreased resistance to osmotic or bile salt-induced stress in anemic
hepati-tis C patients. Furthermore, after ex vivo
incu-bation with ribavirin during 24 h, there was no enhanced exposure of phosphatidylserine on the outer leaflet of the membrane. Although we cannot exclude that longer incubation times could lead to different results, metabolites of ribavirin are already
formed within a few hours of incubation.10 Also,
normal phosphatidylserine exposure in patients with hemolytic anemia from other causes has been
described, in line with our findings.30
It should be noted that our study was already de-signed in the year 1999 and executed in 2000. There-fore some aspects differ from current practice. For example, PEG-interferon rather than interferon is now generally used for treatment of hepatitis C. Also, high dose interferon induction therapy as applied in our study is now controversial, and sus-tained viral responses are now defined as negative HCV RNA 24 rather than 48 weeks after the end of therapy. Nevertheless, it is generally thought that ribavirin rather than (PEG-) interferon is the most important factor in development of anemia, the topic of the current study. Since we used the standard
dose of ribavirin and there was a similar rate of ane-mia in the PEG-interferon and standard interferon groups in the two main registration trials we assu-me that our results would have been similar if
PEG-interferon had been used.1,2
In conclusion, anemia occurs in most patients du-ring anti-HCV treatment. Extent of anemia correla-tes with pre-treatment levels of thrombocycorrela-tes and Hb and becomes aggravated by high ribavirin do-sing. Although we found clear hemolysis as contri-buting factor, our data do not indicate altered membrane phospholipid composition as an impor-tant factor. Further research is needed to explore whether serum erythropoietin response is adequate during antiviral therapy.
ACKNOWLEDGEMENTS
We thank R.A. de Vries, Rijnstate Hospital Arn-hem, R.J. Lieverse, Gelre Ziekenhuizen Apeldoorn, P. Warners, Diaconessenhuis Zeist and S.Y. de Boer, Slingeland Hospital Doetinchem for their con-tribution in inclusion of patients. The important contribution of Dr J. van Hattum to this study is acknowledged.
ABBREVIATIONS
Hb: Hemoglobin.
HCV: Hepatitis C virus.
PEG-interferon: Pegylated interferon.
ATP: Adenosine triphosphate.
CHC: Chronic hepatitis C.
Ht: Hematocrit.
FITC: Fluorescein isothiocyanate.
sEPO: Serum erythropoietin.
IRF: Immature reticulocyte fraction.
MCV: Mean corpuscular volume
LDH: Lactate dehydrogenase.
SM: Sphingomyelin.
PC: Phosphatidylcholine.
REFERENCES
1. Fried MW, Shiffman ML, Reddy KR, Smith C, Marinos G, et al. Peginterferon alfa-2a plus ribavirin for chronic hepati-tis C virus infection. N Engl J Med 2002; 347: 975-82. 2. Manns MP, McHutchison JG, Gordon SC, Rustgi VK,
Shiff-man M, Reindollar R, et al. Peginterferon alfa-2b plus riba-virin compared with interferon alfa-2b plus ribariba-virin for initial treatment of chronic hepatitis C: a randomised trial. Lancet 2001; 358: 958-65.
sur-vey in real world patients with chronic hepatitis C. Ali-ment Pharmacol Ther 2002; 16: 1633-9.
4. Ganser A, Carlo-Stella C, Greher J, Volkers B, Hoelzer D. Effect of recombinant interferons alpha and gamma on hu-man bone marrow-derived megakaryocytic progenitor ce-lls. Blood 1987; 70: 1173-9.
5. Jelkmann WE, Fandrey J, Frede S, Pagel H. Inhibition of erythropoietin production by cytokines. Implications for the anemia involved in inflammatory states. Ann N Y Acad Sci 1994; 718: 300-9.
6. Bodenheimer HCJr., Lindsay KL, Davis GL, Lewis JH, Thung SN, Seeff LB. Tolerance and efficacy of oral ribavirin treatment of chronic hepatitis C: a multicenter trial. He-patology 1997; 26: 473-7.
7. Canonico PG, Kastello MD, Cosgriff TM, Donovan JC, Ross PE, Spears CT, Stephen EL. Hematological and bone ma-rrow effects of ribavirin in rhesus monkeys. Toxicol Appl Pharmacol 1984; 74: 163-72.
8. Canonico PG, Kastello MD, Spears CT, Brown JR, Jackson EA, Jenkins DE. Effects of ribavirin on red blood cells.
Toxicol Appl Pharmacol 1984; 74: 155-62.
9. Glue P. The clinical pharmacology of ribavirin. Semin Liver Dis 1999; 19(Suppl.)1: 17-24.
10. Page T and Connor JD. The metabolism of ribavirin in erythro-cytes and nucleated cells. Int J Biochem 1990; 22: 379-83. 11. Willis RC, Carson DA, Seegmiller JE. Adenosine kinase
initia-tes the major route of ribavirin activation in a cultured hu-man cell line. Proc Natl Acad Sci USA 1978; 75: 3042-4. 12. Zimmerman TP and Deeprose RD. Metabolism of
5-amino-1-beta-D-ribofuranosylimidazole-4-carboxamide and related five-membered heterocycles to 5'-triphosphates in human blood and L5178Y cells. Biochem Pharmacol 1978; 27: 709-16. 13. De Franceschi L, Fattovich G, Turrini F, Ayi K, Brugnara C, Manzato F, et al. Hemolytic anemia induced by ribavi-rin therapy in patients with chronic hepatitis C virus in-fection: role of membrane oxidative damage. Hepatology
2000; 31: 997-1004.
14. Butikofer P, Lin ZW, Chiu DT, Lubin B, Kuypers FA. Trans-bilayer distribution and mobility of phosphatidylinositol in human red blood cells. J Biol Chem 1990; 265: 16035-8. 15. Gascard P, Tran D, Sauvage M, Sulpice JC, Fukami K,
Take-nawa T, et al. Asymmetric distribution of phosphoinositi-des and phosphatidic acid in the human erythrocyte membrane. Biochim Biophys Acta 1991; 1069: 27-36. 16. Op den Kamp JA. Lipid asymmetry in membranes. Annu Rev
Biochem 1979; 48: 47-71.
17. Rothman JE and Lenard J. Membrane asymmetry. Science 1977; 195: 743-53.
18. Connor J, Schroit AJ. Transbilayer movement of phosphati-dylserine in nonhuman erythrocytes: evidence that the aminophospholipid transporter is a ubiquitous membrane protein. Biochemistry 1989; 28: 9680-5.
19. Renooij W, Van Golde LM, Zwaal RF, Van Deenen LL. Topo-logical asymmetry of phospholipid metabolism in rat erythrocyte membranes. Evidence for flip-flop of lecithin.
Eur J Biochem 1976; 61: 53-8.
20. Seigneuret M, Devaux PF. ATP-dependent asymmetric dis-tribution of spin-labeled phospholipids in the erythrocyte membrane: relation to shape changes. Proc Natl Acad Sci U S A 1984; 81: 3751-5.
21. Bedossa P, Poynard T. An algorithm for the grading of ac-tivity in chronic hepatitis C. The METAVIR Cooperative Study Group. Hepatology 1996; 24: 289-93.
22. Turley SD, Dietschy JM. Re-evaluation of the 3 alpha-hydroxysteroid dehydrogenase assay for total bile acids in bile. J Lipid Res 1978; 19: 924-8.
23. Elmlinger MW, Lambrecht HG, Kuhnel W. Evaluation of an automated chemiluminescence assay to measure serum erythropoietin and determination of age-dependent refe-rence ranges. J Lab Med 1999; 23: 289-94.
24. Erslev AJ. Erythropoietin. N Engl J Med 1991; 324: 1339-44. 25. Trivedi HS, Trivedi M. Subnormal rise of erythropoietin in patients receiving interferon and ribavirin combination therapy for hepatitis C. J Clin Gastroenterol 2004; 38: 595-8.
26. Heuman DM, Pandak WM, Hylemon PB, Vlahcevic ZR. Con-jugates of ursodeoxycholate protect against cytotoxicity of more hydrophobic bile salts: in vitro studies in rat he-patocytes and human erythrocytes. Hepatology 1991; 14: 920-6.
27. Velardi AL, Groen AK, Elferink RP, van der MR, Palasciano G, Tytgat GN. Cell type-dependent effect of phospholipid and cholesterol on bile salt cytotoxicity. Gastroenterolo-gy 1991; 101: 457-64.
28. Reed CF, Swisher SN, Marinetti GV, Enen EG. Studies of the lipids of the erythrocyte. I. Quantitative analysis of the lipids of normal human red blood cells. J Lab Clin Med
1960; 56: 281-9.
29. Rouser G, Fkeischer S, Yamamoto A. Two dimensional then layer chromatographic separation of polar lipids and de-termination of phospholipids by phosphorus analysis of spots. Lipids 1970; 5: 494-6.
30. Boas FE, Forman L, Beutler E. Phosphatidylserine exposu-re and exposu-red cell viability in exposu-red cell aging and in hemolytic anemia. Proc Natl Acad Sci USA 1998; 95: 3077-81. 31. Connor J, Pak CC, Schroit AJ. Exposure of
phosphatidylse-rine in the outer leaflet of human red blood cells. Relations-hip to cell density, cell age, and clearance by mononuclear cells. J Biol Chem 1994; 269: 2399-404.
32. Schwartz RS, Tanaka Y, Fidler IJ, Chiu DT, Lubin B, Schroit AJ. Increased adherence of sickled and phosphatidylseri-ne-enriched human erythrocytes to cultured human peri-pheral blood monocytes. J Clin Invest 1985; 75: 1965-72. 33. Schroit AJ, Madsen JW, Tanaka Y. In vivo recognition and
clearance of red blood cells containing phosphatidylserine in their plasma membranes. J Biol Chem 1985; 260: 5131-8. 34. Andree HA, Reutelingsperger CP, Hauptmann R, Hemker
HC, Hermens WT, Willems GM. Binding of vascular anticoa-gulant alpha (VAC alpha) to planar phospholipid bilayers. J Biol Chem 1990; 265: 4923-8.
35. Kuypers FA, Lewis RA, Hua M, Schott MA, Discher D, Ernst JD, Lubin BH. Detection of altered membrane phospholipid asymmetry in subpopulations of human red blood cells using fluorescently labeled annexin V. Blood 1996; 87: 1179-87.
36. Moschetta A, vanBerge-Henegouwen GP, Portincasa P, Pa-lasciano G, Groen AK, van Erpecum KJ. Sphingomyelin exhi-bits greatly enhanced protection compared with egg yolk phosphatidylcholine against detergent bile salts. J Lipid Res 2000; 41: 916-24.
37. Balan V, Schwartz D, Wu GY, Muir AJ, Ghalib R, Jackson J, et al. Erythropoietic response to anemia in chronic hepa-titis C patients receiving combination pegylated interfe-ron/ribavirin. Am J Gastroenterol 2005; 100: 299-307. 38. Van Vlierberghe H, Delanghe JR, De Vos M, Leroux-Roel G.
Factors influencing ribavirin-induced hemolysis. J Hepatol
2001; 34: 911-16.
40. Witters P, Freson K, Verslype C, Peerlinck K, Hoylaerts M, Nevens F, et al. Review article: blood platelet number and function in chronic liver disease and cirrhosis. Aliment Pharmacol Ther 2008; 27: 1017-29.
41. Chang CH, Chen KY, Lai MY, Chan KA. Meta-analysis: riba-virin-induced haemolytic anaemia in patients with chronic hepatitis C. Aliment Pharmacol Ther 2002; 16: 1623-32. 42. Lindahl K, Stahle L, Bruchfeld A, Schvarcz R. High-dose
ri-bavirin in combination with standard dose peginterferon for treatment of patients with chronic hepatitis C. Hepa-tology 2005; 41: 275-9.
43. Hiramatsu N, Kurashige N, Oze T, Takehara T, Tamura S, Kasahara A, et al. Early decline of hemoglobin can predict progression of hemolytic anemia during pegylated interfe-ron and ribavirin combination therapy in patients with chronic hepatitis C. Hepatol Res 2008; 38: 52-9.
44. Reau N, Hadziyannis SJ, Messinger D, Fried MW, Jensen DM. Early predictors of anemia in patients with hepatitis C genotype 1 treated with peginterferon alfa-2a (40KD) plus ribavirin. Am J Gastroenterol 2008; 103: 1981-8. 45. Ladero JM, Lopez-Alonso G, Devesa MJ, Cuenca F, Ortega
L, Agreda M, et al. Oscillations in serum ferritin associated
with antiviral therapy in chronic hepatitis C. Rev Esp En-ferm Dig 2009; 101: 31-40.
46. Durante ME, Marrone A, Saviano D, Del Vecchio C, Utili R, Ruggiero G. Normal erythropoietin response in chronic he-patitis C patients with ribavirin-induced anaemia. Antivir Ther 2003; 8: 57-63.
47. Afdhal NH, Dieterich DT, Pockros PJ, Schiff ER, Shiffman ML, Sulkowski MS, et al. Epoetin alfa maintains ribavirin dose in HCV-infected patients: a prospective, double-blind, randomized controlled study. Gastroenterology
2004; 126: 1302-11.
48. Dieterich DT, Wasserman R, Brau N, Hassanein TI, Bini EJ, Bowers PJ, Sulkowski MS. Once-weekly epoetin alfa improves anemia and facilitates maintenance of ribavi-rin dosing in hepatitis C virus-infected patients recei-ving ribavirin plus interferon alfa. Am J Gastroenterol
2003; 98: 2491-9.
49. Erslev AJ, Caro J, Miller O, Silver R. Plasma erythropoie-tin in health and disease. Ann Clin Lab Sci 1980; 10: 250-7.