Metabolomics Discloses a New
Non-invasive Method for the Diagnosis and
Prognosis of Patients with Alcoholic Hepatitis
Javier Michelena,*,† Cristina Alonso,‡ Ibon Martínez-Arranz,‡ José Altamirano,† Rebeca Mayo,‡ Pau Sancho-Bru,†,§ Ramón Bataller,†,||,¶ Pere Ginès,*,†,§ Azucena Castro,‡ Juan Caballería*,†,§* Liver Unit, Hospital Clínic, Barcelona, Spain. † Institut d’Investigacions Biomèdiques August Pi i Sunyer, University of Barcelona, Barcelona, Spain. ‡ OWL Metabolomics, Parque Tecnológico de Bizkaia, Derio, Bizkaia, Spain. § Centro de Investigación Biomédica en Red de Enfermedades Hepáticas y Digestivas, Barcelona, Spain. || Division of Gastroenterology and Hepatology, Departments of Medicine and Nutrition, University of North Carolina at Chapel Hill, Chapel Hill, NC, USA. ¶ Pittsburgh Liver Research Center, Division of Gastroenterology, Hepatology and Nutrition, University of Pittsburgh Liver Center, Pittsburgh, PA, USA.
January-February, Vol. 18 No. 1, 2019: 144-154
The Official Journal of the Mexican Association of Hepatology, the Latin-American Association for Study of the Liver and
the Canadian Association for the Study of the Liver
Manuscript received: Manuscript received: Manuscript received: Manuscript received:
Manuscript received: October 06, 2017. Manuscript accepted:Manuscript accepted:Manuscript accepted:Manuscript accepted:Manuscript accepted: February 21, 2018.
DOI:10.5604/01.3001.0012.7906
A B S T R A C T A B S T R A C T A B S T R A C T A B S T R A C T A B S T R A C T
Introduction and aims. Introduction and aims.Introduction and aims. Introduction and aims.
Introduction and aims. Alcoholic hepatitis is the most severe manifestation of alcoholic liver disease. Unfortunately, there are still some unresolved issues in the diagnosis and management of this disease, such as the need of histological diagnosis, an accu-rate prognostic stratification, and the development of novel targeted therapies. The present study aimed at addressing these issues by means of metabolomics, a novel high-throughput approach useful in other liver diseases. Material and methods.Material and methods.Material and methods.Material and methods.Material and methods. 64 patients with biopsy-proven alcoholic hepatitis were included and compared with 26 patients with decompensated alcoholic cirrhosis without superimposed alcoholic hepatitis, which was ruled out by liver biopsy. Results.Results.Results.Results.Results. The comparison of the metabolic profiles of pa-tients with alcoholic hepatitis and decompensated cirrhosis showed marked differences between both groups. Importantly, metabolic differences were found among alcoholic hepatitis patients when subjects were stratified according to 90-day survival. Based on these findings, two non-invasive signatures were developed. The first one allowed an accurate non-invasive diagnosis of alcoholic hepatitis (AUROC 0.932; 95% CI 0.901-0.963). The second signature showed a good performance in the prognostic stratification of patients with alcoholic hepatitis (AUROC 0.963; 95% CI 0.895-1.000). Conclusions.Conclusions.Conclusions.Conclusions. Signatures based on metabolomics allowed an accu-Conclusions. rate non-invasive diagnosis and prognostic stratification of alcoholic hepatitis. The differences observed in the metabolic profile of the patients according to the presence and severity of alcoholic hepatitis are related with different mechanisms involved in the pathophys-iology of alcoholic hepatitis such as peroxisomal activity, synthesis of inflammatory mediators or oxidation. This information could be useful for the development of novel targeted therapies.
Key words. Key words.Key words. Key words.
Key words. Alcoholic hepatitis. Metabolomics. Non-invasive diagnosis. Prognosis. Lipidomics.
INTRODUCTION
Alcoholic liver disease is one of leading causes of liver disease worldwide.1 Alcoholic hepatitis (AH), the most
severe form of alcoholic liver disease is characterized by an acute derangement of liver function that can occur at any stage of the disease in patients with heavy alcohol con-sumption.2 The clinical spectrum of AH ranges from
asymptomatic forms to severe liver failure with a high mortality rate. The diagnosis of AH can be suspected by clinical and analytical data, but a definitive diagnosis often
requires histological confirmation.3 The need of liver
re-mains misdiagnosed without histological confirmation. Therefore, the development novel non-invasive diagnostic methods for AH is urgently needed.
AH carries a high short-term mortality, up to 40% at 90 days from admission in its severe forms.4 The therapeutic
approach depends on the severity of the AH. Therefore, an accurate prognostic stratification is of great importance for the correct management of patients with AH. Prognostic models based on clinical or biochemical variables are usu-ally used, such as Maddrey’s discriminant function (DF), model for end-stage liver disease (MELD), Glasgow and age, serum bilirubin, international normalized ratio (INR) and creatinine (ABIC) scores.5-8 Recently, a histologic
in-dex for the assessment of the severity and short-term prog-nosis has also been developed, allowing the classification of patients into mild, moderate and severe AH.9
Metabolomics entails the study of the molecular species smaller than 1,500 Da in any biological fluid, cell or tissue, aiming to determine possible alterations in the metabolism due to physiological and pathological changes, or distur-bances in the biological system. This rapidly expanding re-search field is set up on high-throughput technologies such as soft-ionization mass spectrometry (MS) combined with well-established separation techniques, in particular liquid chromatography. Metabolomics offers clinical applications, such as disease diagnosis or stratification, as well as impor-tant information for clinical research in terms of hypothesis generation. The usefulness of metabolomics has been dem-onstrated in a wide range of medical conditions, including liver diseases. In this field, several applications of metabo-lomics have been reported, such as the potential to discrim-inate between different forms of liver disease10 or the
non-invasive diagnosis of idiopathic portal hypertension.11
It has also been identified a metabolic profile able to distin-guish simple steatosis from steatohepatitis in patients with non-alcoholic fatty liver disease.12
The aims of the present study were:
• To identify a metabolic profile as a non-invasive meth-od for an accurate diagnosis of AH and
• To assess the utility of metabolomics to stratify AH ac-cording to its severity in order to optimize the man-agement of these patients.
MATERIAL AND METHODS
Patients
Sixty-four consecutive patients with biopsy-proven AH admitted to the Liver Unit of the Hospital Clinic of Bar-celona, Spain between 2010 and 2012 were prospectively included, as well as 26 patients with decompensated alco-holic cirrhosis admitted in the same period. The clinical
and biochemical suspicion criteria of AH were an abrupt worsening of liver function, high bilirubin (> 3 mg/dL) and elevated levels of aminotransferases (aspartate ami-notransferase higher than alanine amiami-notransferase) and gammaglutamyl transferase in the presence of an excessive alcohol intake. According to the center’s protocol, all pa-tients in whom AH was clinically suspected underwent a liver. The histological criteria of AH were hepatocellular necrosis, inflammatory infiltrate (mainly polimorphonu-clear) and pericellular fibrosis. Patients with severe AH, defined as a Maddrey’s DF > 32 and/or ABIC score > 6.71, and no contraindications, were treated with 40 mg/ day of prednisone for 4 weeks, followed by a 2-week taper period, with or without treatment discontinuation at 7 days in non-responding patients assessed by the Lille model.13 The decompensated cirrhosis (DC) group
in-cluded those patients with clinical and biochemical suspi-cion of AH that underwent liver biopsy and did not fulfill histological criteria of AH. In all cases, serum samples were obtained from peripheral blood at the time of liver biopsy, which was performed within the first 48 h of hos-pitalization, and they were stored at -80°C until the metab-olomic analysis. Major decompensations of cirrhosis and bacterial infections were diagnosed and treated according to International guidelines and the Liver Unit protocols. The study was approved by the Hospital Clínic Ethics Committee and written informed consent was obtained from all the participants.
Metabolic profiling
Serum metabolic profiles were analyzed as previously described.12 Briefly, ultra-high performance liquid
chro-matography (UHPLC)-single quadruple-MS amino acid analysis system was combined by two separate UHPLC-time-of-flight-MS based platforms analyzing methanol and chloroform/methanol extracts. Identified ion features in the methanol extract platform included non-esterified fat-ty acids (FA), acyl carnitines, bile acids, steroids, oxidized FA, monoacylglycerophospholipids and monoetherglyc-erophospholipids. The chloroform/methanol extract plat-form provided coverage over glycerolipids, cholesteryl esters, sphingolipids, diacylglycerphospholipids, acyl-ether-glycerophospholipids and primary fatty amides. Lip-id nomenclature and classification follows the LIPID MAPS convention, www.lipidmaps.org.
Data and statistical analysis
Continuous variables were described by mean (95% confidence interval – CI). Categorical variables were de-scribed by means of counts and percentages. Comparisons between AH and DC patients, and between AH patients alive or deceased at 90 days were performed by the Student
t test or the Mann-Whitney U test when appropriate. The
two-tailed Wilcoxon signed-rank test was used for assess-ing the metabolic differences. Differences between cate-gorical variables were assessed by the χ2 test or the
Fisher’s exact test. The threshold of significance was 0.05. Survival curves were created by the Kaplan-Meier method and compared using the log-rank test. The main end-points of the study were the diagnosis of AH in the case of non-invasive diagnosis of AH, and the 90-day mortality in the case of prognostic stratification of AH.
A logistic regression (LR) was performed to identify a predictive signature capable of distinguishing between AH and DC. A forward stepwise method was used as variable selection criterion, where the analysis started with an empty model and variables were added one at a time as long as these inclusions were worthy. Once a variable was added, the model was evaluated to ensure its discrimina-tory capability. This process ended when no more varia-bles could be added. Variavaria-bles with missing values were not included in the analysis as they would provide useless information in this classification method. The model was constructed in order to assign a score to each patient. In relation to this score, the probability (from 0 to 1) that an observation belonged or did not belong to a certain class was calculated. If the probability was 0, it did not belong to that class (patient without alcoholic hepatitis), while if the probability was 1, then it belonged to that class (pa-tient with alcoholic hepatitis). In order to provide an un-biased evaluation of the model’s discrimination and accuracy, a bootstrap method was used, where patients were randomly divided into estimation (80% of the sub-jects, n = 72) and validation (20% of all subsub-jects, n = 18) sets, with proportional representation of patients with AH and DC. This process was repeated 1,000 times. Receiver operating characteristic (ROC) curve analysis was used to assess the discriminatory power. Overall diagnostic accu-racy for a given two-class comparison was done by the area under the ROC curve (AUROC) with its associated standard error. Sensitivity, specificity and positive and negative predictive values were calculated as averages over all 1,000 random subsampling cross-validation. The same procedure was followed to determine a predictive model of the severity of AH. The 90-day mortality was defined as the criterion for the severity of the disease. Therefore, the metabolic profile of patients that survived shorter than 90 days was compared with the metabolic profile of those with a survival longer than 90 days. As in the previous model, estimation and validation data sets were
consid-ered as the 80% and the 20% of the AH patients (51 and 13 patients, respectively), with proportional representation of the studied groups.
These calculations were performed using R v.2.14.1 (R Development Core Team, 2011) with caret, caTools and receiver operating characteristic R (ROCR) packages to produce ROC curves and AUROC estimate, and MASS package to generate the LR, or the SPSS statistical package (version 18.0; SPSS, Inc., Chicago, IL).
RESULTS
Characteristics of the patients
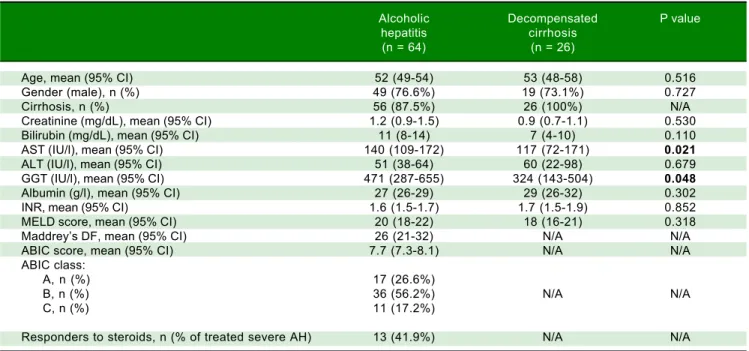
Main baseline characteristics of the patients with AH and DC are listed in table 1. Age and gender were similar in both groups. Patients with AH showed higher levels of aspartate aminotransferase and gammaglutamyl transferase, while liver bilirubin and albumin levels, INR, creatinine levels and MELD score were similar in both groups. 87.5% of the patients with AH fulfilled histological criteria of liver cirrhosis. Among the patients with AH, 26.6% were classified in the low risk group, 56.2% in the moder-ate risk group, and 17.2% in the high risk group, according to the ABIC score. 31 out of the patients with severe AH were treated with corticosteroids, and 41.9% were consid-ered responders as defined by a Lille model > 0.45. Over-all 90-day mortality of patients with AH was 23.4%.
When focusing on patients with AH, there were no dif-ferences in age, gender or proportion of cirrhotic patients between those who died before the 90-day follow up and those who remained alive. However, early death patients had higher bilirubin, aspartate aminotransferase and creati-nine levels and enlarged INR than those who survived, re-sulting in higher ABIC and MELD scores as well as in higher Maddrey’s DF (Table 2). Among the patients that were treated with corticosteroids, the proportion of re-sponders according to the Lille model was higher in pa-tients with a survival period longer than 90 days.
Metabolomic analysis
The entire metabolic profile of the AH and DC pa-tients is depicted in the heat map of figure 1A, containing all the relative ion abundance levels of the metabolites for each individual patient. A total of 468 metabolites were an-alyzed, involving 21 amino acids and 447 lipids (77 fatty acyls, 68 glycerolipids, 226 glycerophospholipids, 43 sphingolipids and 33 sterol lipids).
Table 2. Baseline characteristics of patients with alcoholic hepatitis according to 90-day survival.
Alive Deceased P value
at 90 days at 90 days
(n = 49) (n = 15)
Age, mean (95% CI) 52 (49-54) 52 (45-58) 0.953
Gender (male), n (%) 37 (75.5%) 12 (80%) 0.719
MELD score, mean (95% CI) 18 (16-20) 29 (24-33) < 0.001
Maddrey’s DF, mean (95% CI) 22 (16-28) 41 (27-56) 0.003
ABIC score, mean (95% CI) 7.3 (6.9-7.7) 8.9 (8.3-9.6) < 0.001
ABIC class
A, n (%) 17 (34.7%) 0 (0%)
B, n (%) 27 (55.1%) 9 (60%) 0.004
C, n (%) 5 (10.2%) 6 (40%)
Treated with corticosteroids, n (%) 20 (40.8%) 13 (86.7%) 0.002
Lille model, mean (95% CI) 0.32 (0.21-0.42) 0.76 (0.56-0.96) < 0.001
Responders to corticosteroids,
n (% of patients treated with corticosteroids) 14 (70%) 1 (7.7%) < 0.001
Cirrhosis, n (%) 42 (85.7%) 14 (93.3%) 0.435
Creatinine (mg/dL), mean (95% CI) 0.9 (0.8-1.0) 2.1 (1.0-3.1) < 0.001
Bilirubin (mg/dL), mean (95% CI) 8 (6-11) 20 (15-25) < 0.001
AST (IU/l), mean (95% CI) 143 (103-182) 133 (98-169) 0.640
ALT (IU/l), mean (95% CI) 49 (33-65) 58 (44-72) 0.024
GGT (IU/l), mean (95% CI) 540 (302-778) 245 (157-333) 0.132
Albumin (g/l), mean (95% CI) 28 (26-29) 26 (23-30) 0.395
INR, mean (95% CI) 1.5 (1.4-1.6) 1.9 (1.6-2.2) 0.019
ABIC: age, bilirubin, INR, creatinine score. ALT: alanine aminotransferase. AST: aspartate aminotransferase. GGT: gamma-glutamyl transpeptidase. INR: in-ternational normalized ratio. Maddrey’s DF: Maddrey’s discriminant function. MELD: model for end-stage liver disease.
Table 1. Baseline characteristics of patients with alcoholic hepatitis or decompensated alcoholic cirrhosis included in the study.
Alcoholic Decompensated P value
hepatitis cirrhosis
(n = 64) (n = 26)
Age, mean (95% CI) 52 (49-54) 53 (48-58) 0.516
Gender (male), n (%) 49 (76.6%) 19 (73.1%) 0.727
Cirrhosis, n (%) 56 (87.5%) 26 (100%) N/A
Creatinine (mg/dL), mean (95% CI) 1.2 (0.9-1.5) 0.9 (0.7-1.1) 0.530
Bilirubin (mg/dL), mean (95% CI) 11 (8-14) 7 (4-10) 0.110
AST (IU/l), mean (95% CI) 140 (109-172) 117 (72-171) 0.021
ALT (IU/l), mean (95% CI) 51 (38-64) 60 (22-98) 0.679
GGT (IU/l), mean (95% CI) 471 (287-655) 324 (143-504) 0.048
Albumin (g/l), mean (95% CI) 27 (26-29) 29 (26-32) 0.302
INR, mean (95% CI) 1.6 (1.5-1.7) 1.7 (1.5-1.9) 0.852
MELD score, mean (95% CI) 20 (18-22) 18 (16-21) 0.318
Maddrey’s DF, mean (95% CI) 26 (21-32) N/A N/A
ABIC score, mean (95% CI) 7.7 (7.3-8.1) N/A N/A
ABIC class:
A, n (%) 17 (26.6%)
B, n (%) 36 (56.2%) N/A N/A
C, n (%) 11 (17.2%)
Responders to steroids, n (% of treated severe AH) 13 (41.9%) N/A N/A
Figure 1. Figure 1. Figure 1. Figure 1.
Figure 1. Heatmaps of (AAAAA) the entire metabolic profile of patients with alcoholic hepatitis (AH) and decompensated alcoholic cirrhosis (DC). Each data point corresponds to the relative ion abundance of a given metabolite (vertical axis; ordered by metabolite chemical group and according to their carbon number and unsaturation degree of their acyl chains) in an individual patient’s (horizontal axis; ordered by disease: yellow, DC; green, AH) serum extract. The scale indi-cates for each metabolite, its relative ion abundance in the serum extract of a given subject with respect to that found in the rest of the study population, as represented by the 10th-100th percentiles; (BBBBB) the differences between AH and decompensated alcoholic cirrhosis; (CCCCC) the differences in patients with AH ac-cording to 90-day survival. The log2 transformed ion abundance ratios (colors from green to red show drops or elevations of the metabolite levels in AH patients or severe-AH, respectively) and unpaired Student’s t-test (or Welch’s t test where unequal variances were found) p-values (grey lines correspond to significant fold changes of individual metabolites) per metabolite are displayed for both comparisons. AA: amino acids. FA: fatty acids. oxFA: oxidized FA. AC: acylcarni-tines. FAA: primary fatty amides. DG: diacylglycerols. TG: triacylglycerols. ChoE: cholesteryl esters. BA: bile acids. ST: steroids. DAPE: diacyl-phosphatidyleth-anolamines (PE). MEMAPE: monoacyl:monoether-PE. MAPE: monoacyl-PE. MEPE: monoether-PE. DAPC: diacyl-phosphatidylcholines (PC). MEMAPC: monoacyl:monoether-PC. MAPC: monoacyl-PC. MEPC: monoether-PC. DAPI: diacyl-phosphatidylinositols (PI). MAPI: monoacyl-phosphatidylinositols. Cer: ceramides. SM: sphingomyelins. CMH: monohexosylceramides. FSB: free sphingoid bases.
AA
FA
oxFA AC FAA DG
TG
ChoE BA ST DAPE MEMAPE
MAPE
MEPE
DAPC
MEMAPC
MAPC
MEPC DAPI MAPI Cer
SM CMH FSB
ion abundance for the comparisons AH/DC and 90-day mortality/survival of AH patients, respectively. For the comparison between AH and DC cohorts, almost all ether-linked lysoglycerophospholipids levels were higher in DC patients than in those with AH, including all ether
families analyzed in the serum samples: monoetherglycer-ophosphoethanolamines and monoetherglycerophospho-cholines, considering both ether and vinyl ether lipids (Figure 1B). Cholesteryl esters showed the same trend, al-though only those with esterified acyl chains shorter than
Figure 2. A. Figure 2. A.Figure 2. A.
Figure 2. A.Figure 2. A. ROC curve for the comparison of patients with alcoholic hepatitis and patients with decompensated alcoholic cirrhosis. The AUROC of the obtained signature was 0.932 (95% CI 0.901 - 0.963). The AUROC in the 1000 random subsampling cross-validation was 0.907 and the accuracy, sensitivity, specificity, pos-itive and negative predictive values were 0.869, 0.742, 0.933, 0.834, and 0.897, respectively. B.B.B.B.B. ROC curve for the comparison of patients with alcoholic hepatitis according to 90-day survival. The AUROC was 0.963 (95% CI 0.895 - 1.000). The corresponding AUROC in the 1000 random subsampling cross-validation was 0.945, and the accuracy, sensitivity, specificity, positive and negative predictive values were 0.891, 0.733, 0.939, 0.757 and 0.920, respectively.
Figure 3. Figure 3. Figure 3. Figure 3.
Figure 3. 90-day survival of patients with alcoholic hepatitis according to the metabolomic prognostic signature. 90-day survival was 92.2% among pa-tients classified as low risk according to the metabolic signature, while high risk patients showed a 90-day survival of 15.4% (p = 0.001).
Figure 4. Figure 4. Figure 4. Figure 4.
Figure 4. Comparison of the ROC curves of the metabolomic prognostic signature, the ABIC score, the MELD score and Maddrey’s discriminant function (DF) for the prediction of 90-day mortality in alcoholic hepatitis. The corresponding AUROC were 0.963 (95% CI 0.917-1.000, p < 0.001), 0.827 (95% CI 0.722-0.931, p < 0.001), 0.863 (95% CI 0.767-0.958, p < 0.001) and 0.754 (95% CI 0.630-0.877, p = 0.003), respectively.
0.0 0.02 0.4 0.6 0.8 1.0
1-Specificity
Sensitivity
1.0
0.8
0.6
0.4
0.2
0.0
0.0 0.02 0.4 0.6 0.8 1.0
1-Specificity
Sensitivity
1.0
0.8
0.6
0.4
0.2
0.0
AAAAA BBBBB
0 30 60 90
Time (days)
Survival (%)
100 90 80 70 60 50 40 30 20 10 0
Low risk 51 50 49 47
High risk 13 4 3 2
Long rank test: p < 0.0001
Low risk
High risk
0.0 0.5 1.0
1-Specificity
Sensitivity
1.0
0.5
0.0
18 carbons were significantly different. Interestingly, the essential polyunsaturated linoleic (18:2n-6) acid was sig-nificantly augmented in AH patients (p < 0.05). Linoleic acid is especially important because it is required for the synthesis of arachidonic acid (20:4n-6), the precursor of eicosanoids. Finally, the level of most of triacylglycerols was increased in patients with AH, being the most signifi-cant differences for those with longer esterified chains and unsaturations.
AH cohort also disclosed metabolic differences de-pending on the 90-day mortality (Figure 1C). Similarly to the previous comparison, differences in the cholesteryl es-ters were remarkable. Patients who died during the first 90 days showed significantly lower levels of most of the cholesteryl esters analyzed in comparison to those who survived. The same trend was observed for several diacyl-, monoacyl-, and mainly monoetherglycerophospho-cholines, including both ether and vinyl ether lipids.
Non-invasive diagnostic and prognostic signatures
Once the differences in the serum metabolic profiles were established, the predictive ability was assessed for both comparisons. Then, LR model was calculated to identify a predictive signature capable of distinguishing between AH and DC. The forward stepwise method fin-ished after the inclusion of four metabolites, all of them lysoglycerophosphatidylcholines. The AUROC of the
obtained model was 0.932 (95% CI 0.901-0.963). ROC curve was also calculated as the average over 1,000 ran-dom subsampling cross-validation (Figure 2A). As a re-sult, the AUROC was 0.907 in the validation and the accuracy, sensitivity, specificity, positive and negative predictive values were 0.869, 0.742, 0.933, 0.834 and 0.897, respectively.
The same procedure was followed to define a predic-tive model of 90-day mortality, as the criterion to deter-mine the severity of the disease. Four lipid metabolites were included in the LR model, belonging to FA (one metabolite) and to lysoglycerophosphatidylcholines (three metabolites, one of them and other vinyl ether-linked) families. The AUROC of the obtained model was 0.963 (95% CI 0.895 - 1.000). As in the previous model, ROC curve was also calculated as the average over 1000 random subsampling cross-validation (Figure 2B). The corresponding AUROC was 0.945, and the accuracy, sen-sitivity, specificity, positive and negative predictive values were 0.891, 0.733, 0.939, 0.757 and 0.920, respectively.
The metabolic signature generated for the prognostic stratification of AH was a good predictor of mortality among patients with AH. 90-day mortality was 7.8% among patients classified as low risk according to the metabolic signature, while high risk patients showed a 90-day mor-tality of 84.6% (p = 0.001) (Figure 3). Among patients with high mortality risk according to the predictive signature, infections were the main immediate cause of death, often complicated with acute kidney injury or multiple organ
Figure 5. A. Figure 5. A. Figure 5. A. Figure 5. A.
Figure 5. A. 90-day survival of patients with alcoholic hepatitis ABIC class B according to the metabolomic prognostic signature. 90-day survival was 93.1% in the low risk group vs. 0% in the high risk group (p < 0.001). B.B.B.B.B. ROC curve of the metabolomic prognostic signature for the prediction of 90-day mortality in patients with alcoholic hepatitis ABIC class B. The AUROC was 0.967 (95% CI 0.907-1.000, p < 0.001).
0 30 60 90
Time (days)
Survival (%)
100 90 80 70 60 50 40 30 20 10 0
Low risk 29 29 28 27
High risk 7 2 1 0
Long rank test: p < 0.0001
Low risk
High risk
0.0 0.5 1.0
1-Specificity
Sensitivity
1.0
0.5
0.0
failure. Four out of the eleven patients with a survival shorter than 90 days were diagnosed of respiratory infec-tions, one of abdominal focus septic shock, one of sponta-neous bacteremia and another one suffered multiple infections (in-hospital pneumonia, spontaneous bacterial peritonitis and urinary tract infection). Of note, two of the patients were diagnosed of aspergillosis, one of them with pulmonary involvement and the second one with pulmo-nary aspergillosis and brain abscesses. Two of the patients did not present an identifiable infection. In one case the death was attributed to type 1 hepatorenal syndrome and in the other case to sever liver failure, with hepatic encepha-lopathy and acute kidney injury. Among patients classified in the low risk group by the metabolic signature, four of the patients died by day 90. In two of the cases in hospital pneumonia was identified as the immediate cause of death, complicated with septic shock or multiple organ failure. One patient presented type 1 hepatorenal syndrome, and the last patient was diagnosed of multiple organ failure in the context of severe liver dysfunction.
The signature also showed a good correlation with the current prognostic scores. High risk patients according to its metabolic profile showed significantly higher mean values of ABIC score (9.11 vs. 7.43, p < 0.001), MELD score (29 vs. 18, p < 0.001) and Maddrey’s DF (45 vs. 22, p = 0.001). When all the AH patients in the study cohort were considered, the metabolomic prognostic signature showed a significantly better performance than the usual AH prognostic scores for the prediction of 90-day mortal-ity. The AUROC of the metabolomic signature was 0.963 (95% CI 0.917-1.000), while the AUROC of ABIC score, MELD score and Maddrey’s DF was 0.827 (95% CI 0.722-0.931), 0.863 (0.767-0.958), and 0.754 (0.630-0.877), respec-tively (Figure 4). Moreover, when only considering ABIC class B patients (n = 36), the metabolomic prognostic model also predicted mortality in this subset of patients. Two out of 29 patients (6.9%) with a low risk metabolic profile died before 90 days, while 90-day mortality was 100% among the 7 patients classified in the high risk group (p < 0.001) (Figure 5A). The AUROC of the metabo-lomic prognostic signature to predict 90-day mortality in ABIC B patients was 0.967 (95% CI 0.907-1.000, p < 0.001) (Figure 5B). Finally, the prognostic signature also predict-ed the response to corticosteroids as assesspredict-ed by the Lille model. 33 of the patients with alcoholic hepatitis received treatment with corticosteroids. 22 out of them were con-sidered low risk by the prognostic signature, while 11 were stratified as high risk. According to the Lille model, the response rate was 64% in the low risk group vs. 9% among high risk patients (p = 0.003).
Most of the patients in with alcoholic hepatitis in our cohort had underlying liver cirrhosis. However, the pres-ence or abspres-ence of cirrhosis did not seem to affect the
ac-curacy of the prognostic signature. 44 out of the 56 pa-tients with alcoholic hepatitis and underlying liver cirrho-sis were classified in the low risk group while 12 patients were classified as high risk. 90 day mortality was signifi-cantly different between both groups: 9.1 vs. 83.3% in the low and high risk group, respectively (p < 0.001). Despite the low number of patients with alcoholic hepatitis with-out underlying cirrhosis present in the study cohort, the prognostic signature also found significant differences on 90-day mortality between low risk patients and those clas-sified as high risk. All the 7 patients in the low risk group survived longer than 90 days, while the only patient with alcoholic hepatitis without underlying liver cirrhosis clas-sified as high risk died by day 90 (p = 0.008).
DISCUSSION
Alcoholic hepatitis is the most severe manifestation of alcoholic liver disease and despite the advances in the knowledge of its pathophysiology there are still important unresolved issues in the diagnosis and management of these patients. The need of histological diagnosis of AH remains controversial. However, histology enables differ-entiation of AH from decompensated alcoholic cirrhosis and, in addition, allows grading the severity of AH and to establish the prognosis as demonstrated by a recent score.9
Different non-invasive methods have been proposed to confirm the diagnosis of AH and, among them, a breath analysis of volatile organic compounds has been proposed recently.15 Several prognostic scores have been developed
to predict short-term mortality and to identify patients who may benefit for specific therapy. However, some-times it is difficult to establish the prognosis in patients with an intermediate severity. Metabolomics is a novel ap-proach that combined with high-throughput technologies such as UHPLC-MS and could be very useful to address these remaining issues, and this was the aim of the current study.
One of the main results of the present study is the de-velopment of a non-invasive AH diagnostic model able to discriminate patients with a biopsy-proven AH from those with decompensated alcoholic liver cirrhosis without su-perimposed AH. This is a first step to develop a reliable metabolomic-based non-invasive AH diagnostic tool, which may avoid misdiagnosing this condition and ho-mogenize the inclusion of patients in prospective studies when liver biopsy is not readily available. Moreover, this metabolomic profile provides important information about the physiopathology of AH. For example, the ether-linked phospholipids are synthesized in the peroxi-somes.16 Because of peroxisomal and mitochondrial
peroxi-somal activity. In addition, the current results show evi-dence for the alterations of triacylglycerols, which were increased in AH in comparison to DC patients. Further-more, the significant increase of several polyunsaturated FA (PUFA) may reveal alterations in the synthesis of in-flammatory mediators. In fact, enzymes involved in PUFA synthesis are also important regulators among others of plasma and tissue fatty acid composition, de novo lipogene-sis and gluconeogénelipogene-sis.17 Further studies should
investi-gate the pathogenic role of these mediators, which could represent new targets for therapy.
Another important finding of our study is the perform-ance of our metabolomics signature in predicting patients’ short-term survival. This signature, which includes 4 me-tabolites, was able to accurately stratify AH patients into high and low mortality groups. Currently, models based on biochemical and/or clinical variables are used to estab-lish the severity of an episode of AH. These methods are more simple and available than the model based on meta-bolic profiling. However, the metabolomic model has shown a better performance to predict mortality in AH than the current severity scores. Moreover, as aforemen-tioned, these scores fail to accurately classify the severity of some cases of AH. The metabolomic signature may complement the previous scores and allow a more accu-rate prediction of mortality of patients with, otherwise, indeterminate prognosis, in a stepwise approach to risk stratification. For instance, ABIC class B patients, with in-termediate mortality, can be accurately stratified in two well defined groups, with high and low mortality risk. In addition to risk stratification, AH prognostic scores are useful tools to indicate specific pharmacological therapy (i.e. corticosteroids). There are also models that assess the response to therapy such as the Lille score,13 which allows
the stratification of severe AH patients treated with corti-costeroids into responders and non-responders after one week of treatment. It would be of great interest to be able to predict the response to corticosteroids before starting the treatment, in order to better define which patients would benefit from them. The early identification of non-responders may avoid the exposure to adverse events of these patients, who may be candidates for new therapeutic strategies in the setting of clinical trials. Although the prognostic signature predicts the response to corticoster-oids as assessed by the Lille model, it is possible that it is a confounding bias, since both metabolic signature and Lille model predict mortality. Therefore, the usefulness of the metabolic profile to address the indication and the predic-tion of the response to steroid therapy is an extremely in-teresting clinical and practical point that deserves future research in specifically designed prospective studies.
In addition to its clinical relevance to assess the prog-nosis of patients with AH, the metabolic profile also
pro-vides important information about the metabolic routes related to the severity of an episode of AH. The implica-tion of ether glycerophospholipid families in the inflam-mation and oxidation processes clearly highlights the importance of the changes observed in these metabolites in the prognosis of patients with AH. As the ether-linked lipids in plasma are predominantly synthesized in the liv-er, their measurement can reflect the severity of the hepat-ic alterations.18 Moreover, this information could be
useful for the development of novel targeted therapies. The different metabolic profiles of patients with alco-holic liver disease with and without superimposed AH found in the present study is consistent with those de-scribed in an article by Rachakonda, et al.19 Their results
revealed alterations in pathways related to lipid metabo-lism, and an increment of bile acids and FA. They also found changes in the branched-chain amino acids compo-sition that were not observed in the present study. How-ever, our analytical approach is more complete and allows a broader coverage of the lipidome, including sphingolip-ids, triacylglycerols or ether-linked phospholipids that were not included in Rachakonda, et al. study. Notewor-thy, there are several significant differences in the design of both studies, regarding the number, selection and diag-nosis of patients. First, the sample size of the present study was larger, and included patients with AH regardless the severity as assessed by usual prognostic scores, while in the study by Rachakonda et al. only severe AH patients were included. Therefore, AH patients in the present study presented lower serum bilirubin (11 vs. 15 mg/dL) and INR (1.6 vs. 2.0) levels and higher albumin levels (27
vs. 20 g/L), resulting in a lower MELD score and
the finding of a different metabolic profile in both condi-tions is clinically relevant, whereas AH can be easily dif-ferentiated from compensated cirrhosis. Another study described a metabolomic profiling of plasma capable of accurately predicting survival in patients with DC.20
Inter-estingly, significantly lower levels of lysophosphatidyl-cholines and phosphatidyllysophosphatidyl-cholines were associated with 90-day mortality, which is consistent with the findings of the present study.
Our study suggests that metabolomics is an interesting approach to non-invasively estimate the presence of AH in clinically suggestive cases and to assess the risk of mortali-ty in patients with AH. However, although the above men-tioned studies partially support our findings, the lack of an external validation cohort is an important limitation of the study, as well as a limited sample size, which may affect the statistical power and difficult the performance of suba-nalyses. Therefore, independent prospective studies with a bigger sample size are needed to confirm the utility of me-tabolomics in the setting of AH. It is worth mentioning that while the determination of both LR models was based on a complete metabolomics analysis including three dif-ferent serum extracts, the resulting models include only FA and lysoglycerophosphatidylcholines, belonging to the same analytical platform. This circumstance simplifies the methodology, being more applicable into the clinical practice.
In conclusion, our study describes the metabolic signa-ture of AH as compared with decompensated alcoholic cirrhosis as well as differences in the metabolic profile ac-cording to 90-day survival after an episode of AH. Accord-ingly, non-invasive AH diagnostic and prognostic signatures are proposed. These models have shown an ex-cellent performance in the study cohort. However, fur-ther research is needed in order to confirm these findings in an independent cohort. The role of metabolomics for a better knowledge of the pathophysiology of AH and in as-sessing the potential benefit of steroid therapy in an indi-vidual patient also deserves further investigation.
ABBREVIATIONS
• ABIC: age, bilirubin, INR and creatinine score. • AH: alcoholic hepatitis.
• AUROC: area under the ROC curve. • CI: confidence interval.
• DC: decompensated cirrhosis. • FA: fatty acids.
• INR: international normalized ratio. • LR: logistic regression.
• Maddrey’s DF: Maddrey’s discriminant function. • MELD: model for end-stage liver disease.
• MS: mass spectrometry.
• PUFA: polyunsaturated fatty acids. • ROC: receiver operating characteristic. • ROCR: receiver operating characteristic R.
• UHPLC: ultra-high performance liquid chromatography.
CONFLICT OF INTEREST
The authors declares that there is no conflict of interest regarding the publication of this article.
FINANCIAL SUPPORT
This work was supported by grants from Fondo de In-vestigación Sanitaria Carlos III (FIS), co-financed by Fon-do Europeo de Desarrollo Regional (FEDER), Unión Europea, “Una manera de hacer Europa” (FIS PI14/00320, PI12/00330, FIS PI09/01164, FIS PI12/01265 and FIS PI11/ 01990 to PS-B, PG, JC and RB respectively) and from the NIH (1U01AA021908-01-33490 to PS-B and 1U01AA021908 to RB). JM was enrolled in the Master on Research in Liver Diseases of the Universitat de Barcelo-na and received a Formacion del Profesorado Universitar-io grant of the Spanish EducatUniversitar-ion Ministry. JA received a grant from Fundación Banco Bilbao Vizcaya Argentaria and was enrolled in the Master on Research in Liver Dis-eases of the Universitat de Barcelona. PS-B is funded by Instituto de Salud Carlos III, Miguel Servet (CP11/00071 and CON14/00129) and co-financed by Fondo Europeo de Desarrollo Europeo (FEDER), Unión Europea, “Una manera de hacer Europa”. PG is funded by Agencia de Gestió d’Ajuts Universitaris i de Recerca (AGAUR) 2014 SGR 708, Centro de Investigación Biomédica en Red de Enfermedades Hepáticas y Digestivas (CIBEReHD) and Institució Catalana de Recerca i Estudis Avançats (IC-REA). JA wishes to express his gratitude to the Mexican National Council of Science and Technology (CONA-CyT, Mexico City, Mexico) for partially supporting his predoctoral stay at IDIBAPS.
REFERENCES
1. Elphick DA, Dube AK, McFarlane E, Jones J, Gleeson D. Spectrum of liver histology in presumed decompensated al-coholic liver disease. Am J Gastroenterol 2007; 102: 780-8. 2. Lucey M, Mathurin P, Morgan T. Alcoholic Hepatitis. N Engl J
Med 2009; 360: 2758-2769.
3. European Association for the Study of the Liver. EASL clini-cal practice guidelines: management of alcoholic liver dis-ease.J Hepatol 2012; 57: 399-420.
4. Kulkarni K, Tran T, Medrano M, Yoffe B, Goodgame R. The role of the discriminant factor in the assessment and treat-ment of alcoholic hepatitis. J Clin Gastroenterol 2004; 38: 453-9.
6. Dunn W, Jamil LH, Brown LS, Wiesner RH, Kim VR, Menon KV, Malinchoc M, et al. MELD accurately predicts mortality in patients with alcoholic hepatitis. Hepatology 2005; 41: 353-8.
7. Forrest EH, Evans CD, Stewart S, Phillips M, Oo YH, McAvoy NC, Fisher NC, et al. Analysis of factors predictive of mortal-ity in alcoholic hepatitis and derivation and validation of the Glasgow alcoholic hepatitis score. Gut 2005; 54: 1174-9. 8. Dominguez M, Rincon D, Abraldes JG, Miquel R, Colmenero J,
Bellot P, García-Pagán JC, et al. A new scoring system for prognostic stratification of patients with alcoholic hepatitis. Am J Gastroenterol 2008; 103: 2747-56.
9. Altamirano J, Miquel R, Katoonizadeh A, Abraldes JG, Du-arte-Rojo A, Louvet A, Augustin S, et al. A histologic scoring system for prognosis of patients with alcoholic hepatitis. Gastroenterology 2014; 146: 1231-9.
10. Soga T, Sugimoto M , Honma M, Mori M, Igarashi K, Kashikura K, Ikeda S, et al. Serum metabolomics reveals gamma-glutamyl dipeptides as biomarkers for discrimination among different forms of liver disease. J Hepatol 2011; 55: 896-905.
11. Seijo S, Lozano JJ, Alonso C, Reverter E, Miquel R, Abral-des JG, Martínez-Chantar ML, et al. Metabolomics discloses potential biomarkers for the noninvasive diagnosis of idio-pathic portal hypertension. Am J Gastroenterol 2013; 108: 926-932.
12. Barr J, Caballería J, Martínez-Arranz I, Domínguez-Díez A, Alonso C, Muntané J, Pérez-Cormenzana M, et al. Obesity dependent metabolic signatures associated with nonalcohol-ic fatty liver disease progression. J Proteome Res 2012; 11(4): 2521-32.
13. Louvet A, Naveau S, Abdelnour M, Ramond MJ, Diaz E, Far-toux L, Dharancy S, et al. The Lille model: a new tool for
therapeutic strategy in patients with severe alcoholic hepati-tis treated with steroids. Hepatology 2007; 45: 1348-54. 14. Martinez-Arranz I, Mayo R, Perez-Cormenzana M, Mincholé
I, Salazar L, Alonso C, Mato JM. Enhancing metabolomics research through data mining. J Proteomics 2015; 127: 275-88.
15. Hanouneh IA, Zein NN, Cikach F, Dababneh L, Grove D, Alkhouri N, Lopez R, et al. The breathprints in patients with liver disease identify novel breath biomarkers in alcoholic hepatitis.Clin Gastroenterol Hepatol 2014; 12: 516-23. 16. Lodhi IJ, Semenkovich CF. Peroxisomes: a nexus for lipid
me-tabolism and cellular signaling. Cell Metab 2014; 19: 380-92. 17. Jump DB. Fatty acid regulation of hepatic lipid metabolism.
Curr Opin Clin Nutr Metab Care 2011; 14: 115-20.
18. Vance JE. Lipoproteins secreted by cultured rat hepato-cytes contain the antioxidant 1-alk-1-enyl-2-acylglycero-phosphoethanolamine. Biochim Biophys Acta 1990; 1045: 128-34.
19. Rachakonda V, Gabbert C, Raina A, Bell LN, Cooper S, Malik S, Behari J. Serum metabolomic profiling in acute alcoholic hepatitis identifies multiple dysregulated pathways. PloS ONE 2014; 9: e113860. Doi:10.1371/journal.pone.0113860. 20. McPhail MJ, Shawcross DL, Lewis MR, Coltart I, Want EJ,
Antoniades CG, Veselkov K, et al. Multivariate metabotyping of plasma predicts survival in patients with decompensated cirrhosis.J Hepatol 2016; 64: 1058-67.
Correspondence and reprint request: Juan Caballería, M.D., Ph.D.
Liver Unit, Hospital Clinic. Villarroel 170. 08036 Barcelona, Spain. Tel.: + 34 932275753. Fax: + 34 932271779