Alkaline phosphatase normalization is a biomarker of
improved survival in primary sclerosing cholangitis
Moira Hilscher,* Felicity B. Enders,† Elizabeth J. Carey,‡ Keith D. Lindor,§,** James H. Tabibian||
* Department of Internal Medicine, Mayo Clinic, Rochester, MN, USA. † Division of Biomedical Statistics & Informatics, Mayo Clinic, Rochester, MN, USA. ** Division of Gastroenterology & Hepatology. Mayo Clinic, Scottsdale, AZ. ‡ Division of Gastroenterology & Hepatology, Mayo Clinic, Scottsdale, AZ, USA. § Executive Vice Provost & Dean, College of Health Solutions, Arizona State University, Phoenix, AZ, USA. || Division of Gastroenterology & Hepatology, Mayo Clinic, Rochester, MN, USA.
A B S T R A C T A B S T R A C T A B S T R A C T A B S T R A C T A B S T R A C T
Introduction. Introduction.Introduction. Introduction.
Introduction. Recent studies suggest that serum alkaline phosphatase may represent a prognostic biomarker in patients with pri-mary sclerosing cholangitis. However, this association remains poorly understood. Therefore, the aim of this study was to investigate the prognostic significance and clinical correlates of alkaline phosphatase normalization in primary sclerosing cholangitis. Material Material Material Material Material and methods.
and methods.and methods. and methods.
and methods. This was a retrospective cohort study of patients with a new diagnosis of primary sclerosing cholangitis made at an academic medical center. The primary endpoint was time to hepatobiliaryneoplasia, liver transplantation, or liver-related death. Secondary endpoints included occurrence of and time to alkaline phosphatase normalization. Patients who did and did not achieve normalization were compared with respect to clinical characteristics and endpoint-free survival, and the association between normalization and the primary endpoint was assessed with univariate and multivariate Cox proportional-hazards analyses. Results. Results. Results. Results. Results. Eig-hty-six patients were included in the study, with a total of 755 patient-years of follow-up. Thirty-eight patients (44%) experienced alkaline phosphatase normalization within 12 months of diagnosis. Alkaline phosphatase normalization was associated with longer primary endpoint-free survival (p = 0.0032) and decreased risk of requiring liver transplantation (p = 0.033). Persistent normali-zation was associated with even fewer adverse endpoints as well as longer survival. In multivariate analyses, alkaline phosphatase normalization (adjusted hazard ratio 0.21, p = 0.012) and baseline bilirubin (adjusted hazard ratio 4.87, p = 0.029) were the only signi-ficant predictors of primary endpoint-free survival. Conclusions. Conclusions. Conclusions. Conclusions. Alkaline phosphatase normalization, particularly if persistent, re- Conclusions. presents a robust biomarker of improved long-term survival and decreased risk of requiring liver transplantation in patients with primary sclerosing cholangitis.
Key words. Key words.Key words. Key words.
Key words. Serologic tests. Prognosis. Biliary tract diseases. Outcomes. Cholangiocarcinoma.
March-April, Vol. 15 No. 2, 2016: 246-253
INTRODUCTION
Primary sclerosing cholangitis (PSC) is a cholestatic, fibro-inflammatory hepatobiliary disease of unknown etio-pathogenesis.1-4 PSC generally progresses to end-stage cir-rhosis, represents a major risk factor for hepatobiliary and colonic carcinogenesis, and carries a median liver trans-plant (LT) free survival of approximately 15 years.3,5-7 An ongoing challenge in PSC management for both patients and providers is accurate prediction of major adverse clin-ical endpoints, in particular hepatobiliary neoplasia, need
for LT, and death.8 Although the Mayo PSC risk score and model for end-stage liver disease (MELD) score are help-ful for research purposes and organ allocation, respective-ly,9-11 more clinically specific and applicable biochemical markers for PSC-related prognosis are needed.
Persistent elevation of serum alkaline phosphatase (ALP) is a characteristic biochemical finding in patients with PSC. It is routinely measured during clinical follow-up and remains elevated in a majority of patients; in a small propor-tion, though, it can normalize over time,12-14 and recent preliminary studies by us and others suggest that this
The Official Journal of the Mexican Association of Hepatology, the Latin-American Association for Study of the Liver and
the Canadian Association for the Study of the Liver
Manuscript received: Manuscript received: Manuscript received: Manuscript received:
phenomenon may be associated with better long-term out-comes. Despite these findings, however, it is known that major adverse events can still occur in patients who have ex-perienced ALP-N; therefore, the utility of ALP as prognos-tic biomarker in PSC, while promising, remains uncertain.
In the present study, our aim was to better understand the potential role of ALP in the natural history of patients with PSC. In particular, we examined, in a well-character-ized cohort of patients with PSC:
• The frequency of ALP-N.
• Clinico-demographic, biochemical, and histologic fea-tures of patients who experience ALP-N.
• PSC-related outcomes of patients who experience ALP-N and the potential importance of time to, de-gree, and persistence of ALP-N, and
• Whether ALP-N is an independent predictor of de-creased adverse outcomes after adjusting for other rele-vant variables.
Our collective findings herein support and extend the current knowledge regarding the role of ALP as a potential prognostic biomarker in patients with PSC.
MATERIAL AND METHODS
Patients
After obtaining Mayo Foundation institutional review board approval, electronic medical records from the Mayo Clinic in Rochester, MN were reviewed to identify all patients who received a new diagnosis of PSC at Mayo Clinic between January 1, 1997 and December 31, 2001. The diagnosis of PSC was made based on: serum ALP >1.5x the upper limit of normal (ULN), endoscopic ret-rograde (ERC) or magnetic resonance cholangiography demonstrating biliary ductal irregularity consistent with PSC, and/or liver histology compatible with PSC.15,16 Ex-clusion criteria included:
• Age < 18 years at diagnosis.
• Presence of concomitant or overlap liver disease (e.g. autoimmune hepatitis), and
• Evidence of hepatobiliary neoplasia (cholangiocarci-noma [CCA], hepatocellular carci(cholangiocarci-noma [HCC], or gallbladder carcinoma [GBCA]), need for (or prior) LT, or death within 1 year of PSC diagnosis.
In addition, because patients with small duct-only PSC, by definition, do not have detectable cholangiographic ab-normalities, and given their natural history is known to be significantly different compared to those with large duct PSC, they were excluded from this study.
Study endpoints and variables
The primary endpoint was time to the composite out-come of hepatobiliary neoplasia (CCA, HCC, or GBCA), LT (due to liver failure), or death. Secondary endpoints included occurrence of and time to ALP-N (defined as at least 1 normal ALP value after the diagnosis of PSC) as well as occurrence of persistent ALP-N (i.e. sustained nor-mal ALP levels after initial nornor-malization).
In addition to the above endpoints, the following data were abstracted: age at PSC diagnosis, sex, race, inflam-matory bowel disease (IBD), use and dose of ursodeoxy-cholic acid (UDCA), body mass index (BMI) at diagnosis and 1 year thereafter, baseline serum laboratory tests (e.g. aspartate aminotransferase [AST], international normal-ized ratio [INR], creatinine, and total and direct bilirubin), revised Mayo PSC risk9 (MRS) and MELD11 scores, histologic stage,17 nadir and peak ALP and AST val-ues post-diagnosis of PSC, persistent ALP-N, occurrence of AST normalization, need for ERC, and date of last follow-up (defined as a patient’s most recent clinical visit). Given the ULN varied by patient sex and age for both ALP and AST, we also calculated the ratio of individual pa-tients’ ALP and AST values divided by the laboratory ULN at the time of phlebotomy.
Data analysis
All data were summarized as median (interquartile range [IQR]) or percentages. Patients who did and did not achieve ALP-N were compared with respect to demo-graphic, biochemical, and clinical features and outcomes. Student’s t-test and χ2 test were used for comparing con-tinuous and categorical data, respectively, between pa-tients who did and did not achieve ALP-N. Kaplan-Meier curves were generated to evaluate time to endpoints. Uni-variate and multiUni-variate Cox proportional-hazards models were constructed to assess predictors of time to the com-posite endpoint. Variables adjusted for in the multivariate proportional-hazards models were those that were signifi-cant in univariate analyses.9-11,18
Tests of significance were two-tailed, with an alpha lev-el of 0.05. Analyses were performed using JMP statistical software (version 10.0, SAS Institute, NC).
RESULTS
Baseline characteristics
PSC diagnosis was 696 U/L (reference range 98-251 U/L, depending on age and sex). The median Ludwig stage of PSC was 2, and no patients had small-duct only disease. Patients were followed for a median of 8.7 years, amount-ing to 755 patient-years of total follow-up.
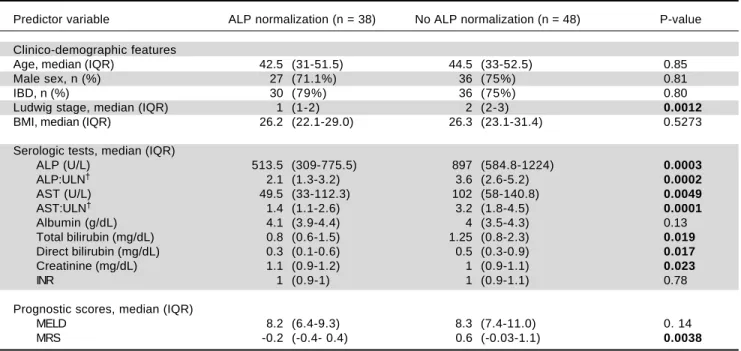
Overall, 38 patients (44%) went on to experience ALP-N, after the diagnosis of PSC (52% of which were being treated with UDCA), with a median time to normalization
of 12 months, as shown in figure 1. Four patients (5%) had normal ALP levels at the time of diagnosis. Characteristics of patients who did and did not experience ALP-N are shown and compared in table 1. Notably, patients who ex-perienced ALP-N did not differ with respect to age, sex, BMI, or presence of IBD at time of diagnosis compared to those who did not experience ALP-N (all p > 0.05). There were significant differences in several baseline se-rum laboratory parameters, including higher ALP (p = 0.0003) and AST (p = 0.0049) in patients who did not ex-perience ALP-N compared to those who did. In addition, baseline Ludwig stage was higher in patients who did not experience ALP-N (p = 0.0012).
Outcomes of patients as a function of ALP normalization
We compared therapies, serum laboratory parameters, and outcomes over the course of follow-up among the pa-tients who experienced ALP-N and those papa-tients who did not. As shown in table 2, these two groups did not vary in UDCA treatment, maximum UDCA dose, need for therapeutic ERC, or change in BMI following diagnosis of PSC. Patients who experienced ALP-N had both lower nadir and peak ALP:ULN ratios than those who did not experience ALP-N and were also more likely to ex-Figure 1.
Figure 1. Figure 1. Figure 1.
Figure 1. Time to and proportion of patients who experience ALP normali-zation.
Table 1. Characteristics of patients with vs. without alkaline phosphatase normalization at time of PSC diagnosis.
Predictor variable ALP normalization (n = 38) No ALP normalization (n = 48) P-value
Clinico-demographic features
Age, median (IQR) 42.5 (31-51.5) 44.5 (33-52.5) 0.85
Male sex, n (%) 27 (71.1%) 36 (75%) 0.81
IBD, n (%) 30 (79%) 36 (75%) 0.80
Ludwig stage, median (IQR) 1 (1-2) 2 (2-3) 0.0012
BMI, median (IQR) 26.2 (22.1-29.0) 26.3 (23.1-31.4) 0.5273
Serologic tests, median (IQR)
ALP (U/L) 513.5 (309-775.5) 897 (584.8-1224) 0.0003
ALP:ULN† 2.1 (1.3-3.2) 3.6 (2.6-5.2) 0.0002
AST (U/L) 49.5 (33-112.3) 102 (58-140.8) 0.0049
AST:ULN† 1.4 (1.1-2.6) 3.2 (1.8-4.5) 0.0001
Albumin (g/dL) 4.1 (3.9-4.4) 4 (3.5-4.3) 0.13
Total bilirubin (mg/dL) 0.8 (0.6-1.5) 1.25 (0.8-2.3) 0.019
Direct bilirubin (mg/dL) 0.3 (0.1-0.6) 0.5 (0.3-0.9) 0.017
Creatinine (mg/dL) 1.1 (0.9-1.2) 1 (0.9-1.1) 0.023
INR 1 (0.9-1) 1 (0.9-1.1) 0.78
Prognostic scores, median (IQR)
MELD 8.2 (6.4-9.3) 8.3 (7.4-11.0) 0. 14
MRS -0.2 (-0.4- 0.4) 0.6 (-0.03-1.1) 0.0038
ALP:alkaline phosphatase. AST: aspartate aminotransferase. BMI: body mass index (at PSC diagnosis). IBD: inflammatory bowel disease. INR: international normalized ratio. IQR: interquartile range. MELD: model for endstage liver disease. MRS:revised Mayo PSC risk (i.e. natural history model for PSC) score. UDCA:ursodeoxycholic acid. ULN: upper limit of normal. † ALP and AST were compared to the ULN in the form of a ratio given the normal range for these
values varied according to patient sex and age and changed during the course of this study in the Mayo Clinic laboratory. Follow-up was 433 patient-years in the ALP normalization group and 322 patient-years in the no ALP normalization group. P-value < 0.05 noted in bold.
100
80
60
40
20
0
0 20 40 60 80 100
Months following diagnosis of PSC
Table 2. Outcomes of patients with vs. without alkaline phosphatase normalization.
Predictor variable ALP normalization (n = 38) No ALP normalization (n = 48) P-value
Clinical features, mean (SD)
UDCA treatment, n (%) 20 (52.6%) 29 (60.4%) 0.51 Initial UDCA dose (mg/day) 1080 (±698.9) 1097 (±489.4) 0.95 Max UDCA dose (mg/day) 1342.1 (±608.8) 1703.7 (±855.1) 0.11
BMI at 1 year 26.8 (±4.5) 26.2 (±5.1) 0.70
ΔBMI from baseline -0.56 (±1.8) -0.31 (±1.6) 0.68
Therapeutic ERC 20 (±52.6%) 33 (±68.8%) 0.18
Serologic tests
Peak ALP, median (IQR) 618 (432-1087.5) 1081 (818-1601.5) 0.0001 Peak ALP: ULN,† median (IQR) 2.8 (1.9-4.8) 5.6 (3.8-7.6) 0.0001
Nadir ALP, median (IQR) 89.5 (72.2-112.3) 337.5 (225-595.2) 0.0001 Nadir ALP: ULN,† median (IQR) 0.70 (0.6-0.8) 1.9 (1.2-3.1) 0.0001
Persistent ALP normalization, n (%) 17 (44.7%) 0 (0%) NA
AST normalization 35 (92.1%) 12 (25%) 0.0001
Major adverse events, n (%) 7 (18.4%) 24 (50%) 0.0032
Liver transplant 2 (5.3%) 11 (22.9%) 0.033
Cholangiocarcinoma 2 (5.3%) 7 (14.6%) 0.29
Gallbladder carcinoma 1 (2.6%) 0 (0%) 0.44
PSC-related death 0 (0%) 0 (0%) NA
Non PSC-related death 1 (2.6%) 3 (6.3%) 0.76
ALP: alkaline phosphatase. AST: aspartate aminotransferase. BMI: body mass index. ERC: endoscopic retrograde cholangiography. UDCA: ursodeoxycholic acid. † ALP and AST were compared to the ULN in the form of a ratio given the normal range for these values varied according to patient sex and age and
changed during the course of this study in the Mayo Clinic laboratory. P-value < 0.05 noted in bold.
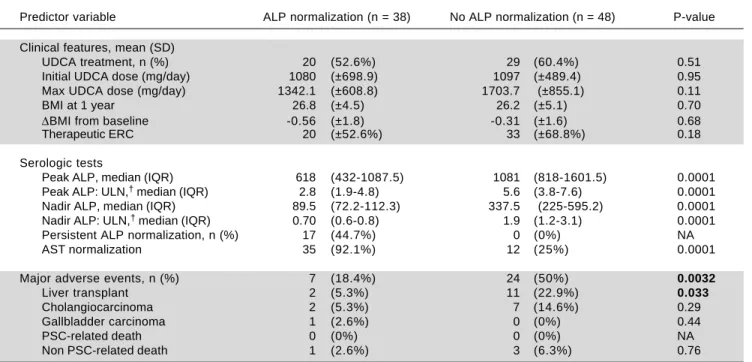
Figure 2. Figure 2.Figure 2.
Figure 2.Figure 2. Kaplan-Meier analysis of endpoint free survival for PSC patients who do and do not experience ALP normalization (p = 0.0001).
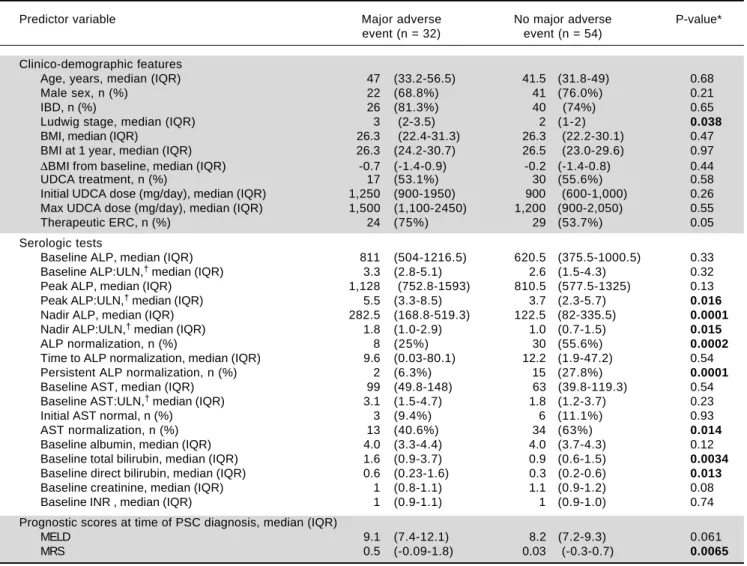
Figure 3. Figure 3.Figure 3. Figure 3.
Figure 3. Kaplan-Meier analysis of end-point free survival in patients who experience persistent ALP normalization (i.e. sustained normal ALP levels after initial normalization) vs. those patients without persistent ALP normali-zation (p = 0.0075).
perience normalization of AST. Importantly, and as demonstrated in figure 2, patients who experienced ALP-N were overall less likely to experience the composite clinical endpoint of hepatobiliary neoplasia, LT, or death (p = 0.0032). Of note, there were no differences in out-comes between those who experienced ALP-N with UDCA vs. without UDCA treatment.
In addition to examining ALP-N, we also assessed the occurrence of persistent ALP-N. We found that a total
of 17 patients (19%) experienced this endpoint during the follow-up period. Only one of these patients expe-rienced the composite endpoint; this was a case of HCC, although the patient was noted to have a remote history of alcoholic hepatitis prior to the diagnosis of PSC. Therefore, and as demonstrated in figure 3, per-sistent ALP-N appears to be a particularly favorable biomarker in PSC.
Number at risk
ALP normalization 17 17 17 16 16
No ALP normalization 69 61 53 31 31
100 80 60 40 20 0
0 50 100 150 200
Time to composite endpoint (months)
Composite endpoint-free survival (%)
Persistent ALP normalization No persistent ALP normalization
Number at risk
ALP normalization 38 38 36 29 29
No ALP normalization 48 39 34 20 16
100 80 60 40 20 0
0 50 100 150 200
Time to composite endpoint (months) ALP normalization
No ALP normalization
Features of patients who did vs. did not experience major adverse events
Thirty-two patients (37%) experienced the primary endpoint during follow-up. These patients exhibited sev-eral significant differences in univariate regression analy-ses compared to those who did not experience the primary endpoint (Table 3). For example, they had higher Ludwig stage and MRS at the time of PSC diagnosis, and a higher proportion required therapeutic ERC (all p < 0.05). With respect to serum biochemical tests, they had higher peak ALP:ULN ratios and baseline total and direct bilirubin as well as higher nadir ALP values and nadir ALP:ULN ra-tios. In addition, they less frequently experienced ALP and AST normalization and persistent ALP-N.
Multivariate analysis for predictors of
primary endpoint-free survival
Multivariate Cox proportional hazards analyses were performed to examine the association between ALP-N while adjusting for other potentially relevant variables found to be significant in univariate regression analyses, including Ludwig stage, need for therapeutic ERC, peak ALP:ULN, AST normalization, and baseline total and direct bilirubin. After adjusting for these variables, ALP-N remained significantly associated with de-creased risk of major adverse PSC-related outcomes (Table 4).
Table 3. Comparison of patients who experienced a major adverse event vs. those who did not.
Predictor variable Major adverse No major adverse P-value* event (n = 32) event (n = 54)
Clinico-demographic features
Age, years, median (IQR) 47 (33.2-56.5) 41.5 (31.8-49) 0.68
Male sex, n (%) 22 (68.8%) 41 (76.0%) 0.21
IBD, n (%) 26 (81.3%) 40 (74%) 0.65
Ludwig stage, median (IQR) 3 (2-3.5) 2 (1-2) 0.038
BMI, median (IQR) 26.3 (22.4-31.3) 26.3 (22.2-30.1) 0.47 BMI at 1 year, median (IQR) 26.3 (24.2-30.7) 26.5 (23.0-29.6) 0.97
ΔBMI from baseline, median (IQR) -0.7 (-1.4-0.9) -0.2 (-1.4-0.8) 0.44
UDCA treatment, n (%) 17 (53.1%) 30 (55.6%) 0.58
Initial UDCA dose (mg/day), median (IQR) 1,250 (900-1950) 900 (600-1,000) 0.26 Max UDCA dose (mg/day), median (IQR) 1,500 (1,100-2450) 1,200 (900-2,050) 0.55
Therapeutic ERC, n (%) 24 (75%) 29 (53.7%) 0.05
Serologic tests
Baseline ALP, median (IQR) 811 (504-1216.5) 620.5 (375.5-1000.5) 0.33 Baseline ALP:ULN,† median (IQR) 3.3 (2.8-5.1) 2.6 (1.5-4.3) 0.32
Peak ALP, median (IQR) 1,128 (752.8-1593) 810.5 (577.5-1325) 0.13 Peak ALP:ULN,† median (IQR) 5.5 (3.3-8.5) 3.7 (2.3-5.7) 0.016
Nadir ALP, median (IQR) 282.5 (168.8-519.3) 122.5 (82-335.5) 0.0001
Nadir ALP:ULN,† median (IQR) 1.8 (1.0-2.9) 1.0 (0.7-1.5) 0.015
ALP normalization, n (%) 8 (25%) 30 (55.6%) 0.0002
Time to ALP normalization, median (IQR) 9.6 (0.03-80.1) 12.2 (1.9-47.2) 0.54 Persistent ALP normalization, n (%) 2 (6.3%) 15 (27.8%) 0.0001
Baseline AST, median (IQR) 99 (49.8-148) 63 (39.8-119.3) 0.54 Baseline AST:ULN,† median (IQR) 3.1 (1.5-4.7) 1.8 (1.2-3.7) 0.23
Initial AST normal, n (%) 3 (9.4%) 6 (11.1%) 0.93 AST normalization, n (%) 13 (40.6%) 34 (63%) 0.014
Baseline albumin, median (IQR) 4.0 (3.3-4.4) 4.0 (3.7-4.3) 0.12 Baseline total bilirubin, median (IQR) 1.6 (0.9-3.7) 0.9 (0.6-1.5) 0.0034
Baseline direct bilirubin, median (IQR) 0.6 (0.23-1.6) 0.3 (0.2-0.6) 0.013
Baseline creatinine, median (IQR) 1 (0.8-1.1) 1.1 (0.9-1.2) 0.08 Baseline INR , median (IQR) 1 (0.9-1.1) 1 (0.9-1.0) 0.74
Prognostic scores at time of PSC diagnosis, median (IQR)
MELD 9.1 (7.4-12.1) 8.2 (7.2-9.3) 0.061
MRS 0.5 (-0.09-1.8) 0.03 (-0.3-0.7) 0.0065
ALP: alkaline phosphatase. AST: aspartate aminotransferase. BMI: body mass index. ERC: endoscopic retrograde cholangiography. MRS: revised Mayo PSC risk (i.e. natural history model for PSC) score. UDCA: ursodeoxycholic acid. † ALP and AST were compared to the ULN in the form of a ratio given the
Table 4. Multivariate analysis of predictors of major adverse PSC-related clinical events.
Predictor variable Adjusted hazard ratio (95% CI) P-value
ALP normalization 0.21 (0.073, 0.48) 0.012
Ludwig stage† 6.01 (0.99, 4.51) 0.051
Therapeutic ERC 1.18 (0.49, 3.30) 0.72
AST normalization 0.99 (0.37, 2.47) 0.98
Baseline total bilirubin 4.87 (1.25, 67.71) 0.029
Variables adjusted for were determined a priori as described in the data analysis section. The Mayo PSC risk score was not included as several of its individual components were included and directly studied. Peak ALP was excluded because of colinearity with ALP normalization; direct bilirubin was excluded because of colinearity with total bilirubin. CI: confidence interval. ERC: endoscopic retrograde cholangiography. AST: aspartate aminotransferase. † Per 1 unit increase in
Ludwig stage. P-value < 0.05 noted in bold.
DISCUSSION
PSC is a progressive disorder with an unpredictable clinical course, paucity of therapeutic options, and poten-tially devastating outcomes.1,16 Although natural histo-ry models and risk scores have been developed to estimate mortality in PSC, better biochemical markers of disease prognosis and response to therapy are needed to help in-form disease surveillance and assess existing and emerging therapies.8 The objectives of this study, thus, were to ex-pand the role of serum ALP as a promising and readily available prognostic biochemical marker in patients with PSC by examining different biochemical and clinical end-points. Our major findings herein are:
• Nearly one quarter of PSC patients experience sponta-neous ALP-N within a median of 12 months post-PSC diagnosis.
• ALP-N, and even more so persistent ALP-N, is associ-ated with a low incidence of liver transplantation and other major adverse PSC-related events during extend-ed follow-up, and
• ALP-N is an independent predictor of decreased major adverse PSC-related events, even after adjusting for other relevant variables.
Therefore, our study clarifies the role of ALP as a bio-chemical marker in PSC and strongly supports its prog-nostic value in patients with this disease.
ALP levels vary widely during the course of PSC12,13 but remain persistently elevated in a majority of patients. Per-sistent elevation has been proposed as a potential marker of ongoing biliary injury and disease progression. Recent stud-ies by us and others have suggested that ALP-N portends a better prognosis for PSC patients.14 For example, Al Mamari, et al. recently showed that reduction of ALP to <1.5 the ULN is associated with improved outcome and decreased risk of CCA.19 Lindstrom, et al. assessed the im-pact of UDCA treatment with and without ALP-N on sur-vival in patients with PSC; the authors found that patients
with normalization or reduction (defined as ≥ 40% reduc-tion from baseline) of ALP had longer survival times than patients with no biochemical response irrespective of treat-ment with UDCA. These studies have been corroborated by a recent magnetic resonance elastography-based study which found decreased liver stiffness measurements and slower progression of liver stiffness among patients with ALP-N when compared to patients with persistently elevat-ed ALP.20 Collectively, these studies suggest that achieving ALP-N over the disease course has clinical and prognostic importance in PSC, but several important questions have, until now, remained unaddressed.
In our study of 86 patients with 755 patient-years of fol-low-up, we confirmed the recent findings of the afore-mentioned reports and extended them with novel aspects regarding the temporal dynamics and prognostic signifi-cance of ALP-N. In our study, ALP-N (with or without UDCA therapy) was an independent predictor of primary endpoint-free survival, even after adjusting for other clini-cally relevant variables, suggesting that ALP-N serves as a biomarker of milder disease phenotype (Figures 2 and 3). Al Mamari, et al. propose that persistent improvement of ALP to <1.5 ULN confers decreased risk of CCA and recommend this as a biochemical cutoff. However, this cutoff was not associated with decreased risk of progres-sive PSC requiring LT in their study. Importantly, we found that ALP-N, either transient or persistent, was asso-ciated with a significantly decreased risk of requiring LT (p = 0.03). This finding further establishes the prognostic significance of ALP by identifying a cutoff which predict-slower risk for requiring LT in addition to other adverse endpoints.
hepato-cellular injury. Previous studies have demonstrated that AST has prognostic significance in primary biliary cholan-gitis (PBC) and PSC and that patients with PSC who present with higher initial AST levels have decreased sur-vival;9 our paper is the first to demonstrate that AST nor-malization is associated with ALP-N as well as improved survival. After adjusting for ALP-N in a multivariate mod-el, however, AST normalization was no longer a predictor of improved survival (Table 4); aside from ALP-N, only base-line bilirubin values were statistically significant inde-pendent predictors of composite endpoint-free survival, and baseline Ludwig stage showed a trend toward signifi-cance. Taken together, these findings indicate that lower ALP levels both at diagnosis and throughout the disease course are predictive of a more benign disease course and better long term outcomes. Moreover, they suggest that a reasonable clinical strategy may be to observe patients for one year after PSC diagnosis, and for those who do not ex-perience ALP-N spontaneously, considering a 6-12 month trial of intermediate-dose UDCA (or other emerging ther-apies).
Importantly, patients with persistent ALP-N appeared to be the least likely to experience a major adverse event and had improved survival (Figure 3). Stanich, et al.14 pre-viously found that ALP-N more commonly occurred shortly after diagnosis. However, our data suggest that the persistence of ALP-N bears more prognostic significance than time to normalization, which can vary widely. There-fore, serial monitoring of ALP for normalization is worth-while and bears prognostic significance for patients. In addition, our results suggest that patients with persist-ently elevated ALP who are treated with UDCA and expe-rience ALP-N should, in the absence of more effective pharmacotherapy, be continued on this treatment.21
This study has several limitations which should be men-tioned. It was retrospective in nature, and thus causal rela-tionships cannot be inferred. The sample size was small, in part due to the low incidence of PSC, but the long median patient follow-up and well-characterized nature of the co-hort helped to mitigate this limitation. This was a single center study based in a tertiary care institution, which may limit generalizability; however, by including only patients with a new diagnosis of PSC (as opposed to those referred with already established advanced PSC), we believe our findings may be broadly applicable and less affected by po-tential confounders. Another limitation of our study is that we did not treat ALP-N as a time-dependent (but instead a categorical) variable; however, most patients who experi-enced ALP-N did so relatively early in their disease course (within 12-18 months of diagnosis), and time to ALP-N was not predictive of primary endpoint-free survival in our analyses (Table 3). Lastly, we did not study non-hepatobil-iary outcomes (e.g. colorectal cancer) in this study,
al-though we recognize that these are important areas of re-search in PSC.
CONCLUSION
In conclusion, ALP-N with or without UDCA therapy is independently and robustly associated with improved outcomes and survival in patients with PSC. Moreover, persistent ALP-N is associated with particularly favorable long term outcomes. Therefore, our study supports the role of ALP-N as a readily available and reliable marker of more benign disease phenotype, decreased risk of PSC-re-lated adverse outcomes, and possibly response to pharma-cotherapy. These findings have important implications in the current management of PSC and suggest closer sur-veillance of patients who do not experience ALP-N.
ABBREVIATIONS
• ALP: alkaline phosphatase.
• ALP-N: alkaline phosphatase normalization.
• AST: aspartate aminotransferase.
• BMI: body mass index.
• CCA: cholangiocarcinoma.
• ERC: endoscopic retrograde cholangiography.
• GBCA: gallbladder carcinoma.
• HCC: hepatocellular carcinoma.
• IBD: inflammatory bowel disease.
• INR: international normalized ratio.
• IQR: interquartile range.
• LT: liver transplantation.
• MELD: model for end-stage liver disease.
• MRS: revised Mayo PSC risk (i.e. natural history model for PSC) score.
• PSC: primary sclerosing cholangitis.
• UDCA: ursodeoxycholic acid.
• ULN: upper limit of normal.
GRANT SUPPORT, CONFLICTS OF INTEREST, WRITING ASSISTANCE, OR OTHER DISCLOSURES
None.
ACKNOWLEDGMENT
The authors would like to thank Dr. Peter Stanich for his assistance with identifying patients eligible for this study.
REFERENCES
2. Gupta A, Bowlus CL. Primary sclerosing cholangitis: etio-pathogenesis and clinical management. Frontiers in bio-science 2012; 4: 1683-705.
3. Levy C, Lindor KD. Primary sclerosing cholangitis: epidemiol-ogy, natural history, and prognosis. Seminars in liver dis-ease 2006; 26: 22-30.
4. Tabibian JH, O’Hara SP, Splinter PL, Trussoni CE, Larusso NF. Cholangiocyte senescence via N-Ras activation is a characteristic of primary sclerosing cholangitis. Hepatolo-gy2014; 7: 103-14.
5. Tabibian JH, Lindor KD. Challenges of Cholangiocarcinoma Detection in Patients with Primary Sclerosing Cholangitis. Journal of Analytical Oncology 2012;1: 50-5.
6. Karlsen TH, Schrumpf E, Boberg KM. Update on primary sclerosing cholangitis. Digestive and liver disease 2010; 42: 390-400.
7. Feldstein AE, Charatcharoenwitthaya P, Treeprasertsuk S, Benson JT, Enders FB, Angulo P. The natural history of non-alcoholic fatty liver disease in children: a follow-up study for up to 20 years. Gut 2009; 58: 1538-44.
8. Tabibian JH, Enders F, Imam MH, Kolar G, Lindor KD, Talw-alkar JA. Association between serum IgE level and adverse clinical endpoints in primary sclerosing cholangitis. Ann Hepatol 2014; 13: 384-9.
9. Kim WR, Therneau TM, Wiesner RH, Poterucha JJ, Benson JT, Malinchoc M, LaRusso NF, et al. A revised natural histo-ry model for primahisto-ry sclerosing cholangitis.Mayo Clinic pro-ceedings 2000; 75: 688-94.
10. Wiesner RH. Moving toward evidence-based liver allocation in patients with primary sclerosing cholangitis.Liver trans-plantation 2013; 19: 241-2.
11. Kamath PS, Wiesner RH, Malinchoc M, Kremers W, Therneau TM, Kosberg CL, D’Amico G, et al. A model to predict survival in patients with end-stage liver disease. Hepatology 2001; 33: 464-70.
12. Olsson R, Broome U, Danielsson A, Hägerstrand I, Järnerot G, Lööf L, Prytz H, et al. Spontaneous course of symptoms in primary sclerosing cholangitis: relationships with biochem-ical and histologbiochem-ical features. Hepatogastroenterology 1999; 46: 136-41.
13. Balasubramaniam K, Wiesner RH, LaRusso NF. Primary scle-rosing cholangitis with normal serum alkaline phosphatase activity.Gastroenterology 1988; 95: 1395-8.
14. Stanich PP, Bjornsson E, Gossard AA, Enders F, Jorgensen R, Lindor KD. Alkaline phosphatase normalization is associ-ated with better prognosis in primary sclerosing cholangitis. Digestive and liver disease 2011; 43: 309-13.
15. Tabibian JH, Weeding E, Jorgensen RA, Petz JL, Keach JC, Talwalkar JA, Lindor KD. Randomised clinical trial: vancomy-cin or metronidazole in patients with primary sclerosing cholangitis - a pilot study. Alimentary pharmacology & thera-peutics 2013; 37: 604-12.
16. Chapman R, Fevery J, Kalloo A, Nagorney DM, Boberg KM, Shneider B, Gores GJ. Diagnosis and management of prima-ry sclerosing cholangitis.Hepatology 2010; 51: 660-78. 17. Ludwig J, Dickson ER, McDonald GS. Staging of chronic
non-suppurative destructive cholangitis (syndrome of primary bil-iary cirrhosis).VirchowsArchiv 1978; 379: 103-12.
18. NguJH, Gearry RB, Wright AJ, Stedman CA. Inflammatory bowel disease is associated with poor outcomes of patients with primary sclerosing cholangitis. Clinical gastroenterolo-gy andhepatologastroenterolo-gy 2011; 9: 1092-7; quiz e135.
19. Al Mamari S, Djordjevic J, Halliday JS, Chapman RW. Im-provement of serum alkaline phosphatase to <1.5 upper limit of normal predicts better outcome and reduced risk of cholangiocarcinoma in primary sclerosing cholangitis. J Hepatol 2013; 58: 329-34.
20. Corpechot C, Gaouar F, El Naggar A, Kemgang A, Wendum D, Poupon R, Carrat F, et al. Baseline values and changes in liver stiffness measured by transient elastography are asso-ciated with severity of fibrosis and outcomes of patients with primary sclerosing cholangitis. Gastroenterology 2014; 146: 970-9; quiz e15-6.
21. Tabibian JH, Lindor KD. Ursodeoxycholic acid in primary sclerosing cholangitis: if withdrawal is bad, then administra-tion is good (right?). Hepatology 2014; 60: 785-8.
Correspondence and reprint request: Keith D. Lindor, M.D.
Arizona State University. College of Health Solutions
550 North 3rd Street. Phoenix, AZ 85004, USA. Tel.: (602) 496-2644. Fax: (602) 496-0886