1
Hydrothermal CO
2Conversion Using Zinc As Reductant: Batch
Reaction, Modeling and parametric analysis of the process
D. Roman-Gonzaleza, A. Moroa, F. Burgoaa, E. Pérezb , A.Nieto c , A.Martín a M.D. Bermejo a*
a
High Pressure Process Group, Department of Chemical Engineering and Environmental Technology, University of Valladolid (SPAIN),
bTERMOCAL Research Group, Thermodynamics and Calibration, University of Valladolid, Escuela de Ingenierías Industriales, Paseo del Cauce 59, E-47011 Valladolid, Spain
c
Department of Mechanical Engineering, Chemical and Industrial. ETSIDI-UPM, Madrid (SPAIN),
*email: mdbermejo@iq.uva.es
KEYWORDS: CO2 reduction; hydrothermal; zinc; modeling; formic acid, batch
Abstract
Hydrothermal reduction of CO2 using Zn as reductant to obtain formic acid is a selective and efficient process. This process has the advantage of avoiding the use of gaseous hydrogen with all its safety and environmental concerns, and allowing an easier integration with CO2 capturing steps such as CO2 absorption in aqueous NaOH, because the latter solutions can be directly fed to the process as NaHCO3. In this work, this reaction was studied in batch reactors at temperatures from 275 to 325ºC. Conversions up to 75% were obtained with selectivity towards formic acid near 100%, at residence times between 10 and 180 min. Reactions proceeds fast in the first steps of reaction, and it is slowed down when the oxidation of Zn is completed. The experimental results obtained were used to stablish a model that can explain both experimental data from this work and from literature with an averaged error of 13%. Using both the model and the experimental data the main variables of the process were analyzed: temperature, Zn/HCO3
ratio, heating rate, Zn particle size, pressure reactor material and use of supercritical conditions. The optimum reaction conditions found were 300ºC with a rapid heating, and particle sizes of 0.75-1 mm. Zn excess dramatically improves the yield, but working with a lower excess can be compensated by working at pressures higher than 300 bar.
1. Introduction
2
carried out that have led to important advances, especially in the development of improved catalysts [4,5]. However, these technologies still face important limitations, especially with respect to the selectivity and the productivity of the conversion reaction, and new investigations regarding process intensification and energy integration are needed to make these technologies technically and economically feasible [6]
Among the different carbon dioxide conversion technologies, the hydrothermal reduction of CO2 stands out since it has already shown the potential to selectively convert carbon dioxide into valuable products such as formic acid, methane and methanol, favored by the increased reactivity of CO2 in hydrothermal conditions [7-10]. In this process, gaseous CO2, or CO2 captured in a basic aqueous solution as bicarbonate, is reduced using zero-valent metals [10-12] or organics [11, 13-15] as reductants, eliminating in this way the need of using hydrogen gas with all its economical and safety issues. In many of these processes water acts not only as a solvent but also as a hydrogen source, and, what it is more, the reduction performed with the hydrogen so generated is faster than the reaction using gaseous hydrogen [11, 16].
Depending on the operational variables such as temperature, residence time, and reductant and catalyst employed, different products can be obtained, and in some cases, conversions near 80% have been reported in literature. The most frequent combination is the use of Fe as reducing metal and Ni [11] or Cu [12] as catalysts. Other metals used as reductants are Mg, Mn, Al and Zn, being the last three very effective even without catalysts [10-12]. The most frequent product is formic acid, but some authors have reported the formation of phenol [17], methane [18] and methanol [19].
The third and maybe most important advantage of this process is that CO2 can be captured by absorption in basic solutions, which is a well-known technology. By combination of absorption and hydrothermal conversion, CO2 can be directly converted by hydrothermal reduction eliminating in this way cost of purification, compression or storage associated to other conversion technologies. Moreover, the conversion and selectivity of the process towards formic acid has proved to be higher when the pH is around 9, in which CO2 is mostly as bicarbonate, over those obtained for gaseous CO2 [8] or carbonate [14]. This has been attributed to a stabilization of the formate, which reduces its decomposition in gaseous by-products [2]. The most promising results were obtained reducing bicarbonate using Zn as a reducing metal. In this way conversions of almost 70%, with selectivities towards formic acid near 100% were obtained in residence times of a few minutes, obtaining higher conversions at longer residence times, at temperatures between 250 to 325ºC.
Most of the work done so far was performed at laboratory scale and it is still far for its application at industrial level, with the exception of the work of Takahashi et al [9] in which the process was tested in semi-continuous way. Additionally, some ways of reducing back the oxidized metals have been proposed as the reduction using glycerin [10] or solar light [8].
3
hydrothermal conditions over copper-based catalysts [22]. The integration of both steps might be a green process to reduce carbon dioxide while producing biofuels.
The objective of this work is to develop a simple kinetic model to describe the process of bicarbonate reduction to formic acid using Zn as reductant, and to integrate it in a mathemathical model able to predict the behavior of the process under different operational condicions such as temperature, residence time, heating rate or amount and size of the Zn particles. In order to do so, batch experiments of bicarbonate reduction with Zn were performed at temperatures between 10 and 180 min at temperatures between 250ºC and 325ºC.
2. Experimental
2.1 Materials
Zinc (particle size <10 µm, purity ≥ 98%. CAS: 7440-66-6) was obtained from Sigma Aldrich (St. Louise, USA). Sodium bicarbonate (NaHCO3 “A”E500 ii) and Sulphuric acid (DEL HPLC) (CAS: 7664-93-9) were obtained from Cofarcas (Burgos, Spain). For HPLC standards the following reagents were used: Glacial acetic acid (QP), formic acid 85% for analysis, formaldehyde 37-38% w/w stabilized for methanol for analysis, methanol for analysis and ethanol absolute partially denatured technical grade all of them supplied by PANREAC.
2.2 Experimental procedure
A 42 g/L (0.5 M) solution of NaHCO3 prepared using MilliQ water was used for the experiments. The amounts of sodium bicarbonate were weighed using a Sartorius Basic balance (Accuracy 0.1 mg). Batch reactors constructed using metallic tubing were used. Two different types of reactors were used: for most reactions, stainless steel reactors (½ ‘’) were used, while Ni Alloy 625 reactors (3/8”) were used for selected reactions, and for the reactions performed with a sequence of 350-400ºC a Ni Alloy 625 reactors (1/2”) were used, as stainless steel reactors cannot operate at these temperatures. The reactors had an inner volume of approximately 15 mL. Each reactor was loaded with a known amount of sodium bicarbonate solution, filling approx. 50% of the volume of the reactor. A known weight of Zn-powder was then added (molar ratio Zn/NaHCO3 = 5 for most experiments). As zinc easily oxidizes in the presence of air, it was handled under inert conditions. For this purpose an inert bag, which could be filled with nitrogen, was used. Inside the bag, the selected amount of Zn was weighed and poured inside the reactors. After that, reactors were closed, weighted and introduced in a Gallur MR-4N oven preheated to the reaction temperature. In some experiments, in order to study the temperature profile of the process, both with and without reaction, a stainless steel reactor equipped with a type K thermocouple was used to record the temperature over time. After the desired reaction time the reactor was extracted from the oven and quenched to room temperature by immersion in a refrigerated bath (propylene glycol +water) to stop the reaction. Then the reactor was dried and weighted to check that there were no losses of gaseous products by leaking. Then, the reactors were partially opened to release the gas produced in the reaction. After that, the reactors were weighed again, in order to have an approximate value of the amount of gas produced during the reaction. Finally, the reaction products were recovered, the solid and liquid fraction separated and analyzed separately. All the experiments were duplicated in order to check reproducibility.
2.3 Analysis
4
into the HPLC equipment. In the HPLC analysis an Aminex HPX-87 column was used, the mobile phase was 0.005M H2SO4 at a flow rate of 0.6 m/min, the temperature was 60ºC and an IR2414 detector was used.
Analyses using a TOC Shimadzu TOC V-series equipment were performed to determine organic carbon (TOC), inorganic carbon (IC) and Total Carbon. For these analysis the samples required filtration and dilution, in a volume ratio 1:25. Additionally, for the TOC measurements nitric acid was added to the diluted samples before the analysis to convert unreacted sodium bicarbonate into CO2, that it is released by ultrasounds. The IC samples did not require further pretreatment. For the analysis, standard solutions IC 100 ppm and TOC 100 ppm were used as calibration samples.
The solid samples from the reaction were dried in a thermostated oven at vacuum for two days at 35 ºC, to remove the remaining water in the metallic samples. After that XRD test were carried out using a BRUKER D8 DISCOVER A25 device, Generator 3KW, Ceramic cupper tube 2.2 kW type FFF, to determinate the different structure of Zn and is oxidized form, ZnO: The amount of ZnO was then determined by the Rietveld method.
Malvern Mastersizer 2000 Light Scattering Device was used to measure the average Zn particle size, before the reaction takes place. The equipment could measure particles with size ranging between 0.02 to 2000 µm. To do that, the device count with a dual wave length detection system. The first wavelength is the red light (633 nm), and the second one is the blue light (436 nm). The Zn particles were introduced as an aqueous suspension into the stirring unit (Hydro SM). Knowing the refraction value of water (1.331), and measuring the refraction of the sample, the average size distribution can be calculated, considering all the particles in the suspension are spherical.
Yield of formic acid is calculated as shown in eq. 1
100
3
NaHCO ,
× =
i FA FA
C C
Y eq. 1
Where CFA is the molar concentration of formic acid obtained and Ci,NaHCO3 the initial molar concentration of bicarbonate.
3. Modeling
In order to develop a mathematical model of the process, reactions 1 to 5 were taken into account:
𝐻𝐻𝐻3−(𝑎𝑎) +𝑍𝑍(𝑠) → 𝐻𝐻𝐻𝐻−(𝑎𝑎) +𝑍𝑍𝐻(𝑠) (1)
(2)
𝐻𝐻𝐻3−(𝑎𝑎) + 𝐻2(𝑎𝑎) → 𝐻𝐻𝐻𝐻−(𝑎𝑎) + 𝐻2𝐻(𝑙) (3)
𝐻𝐻𝐻𝐻−(𝑎𝑎) +𝐻
2𝐻 (𝑙)→ 𝐻𝐻𝐻3−(𝑎𝑎) +𝐻2 (4)
𝐻𝐻𝐻𝐻−(𝑎𝑎)→ 𝐻𝐻(𝑔) +𝐻𝐻−(𝑎𝑎) (5)
5
which according to the results of Jin et al [8] is only present during the first minutes of the reaction. Reaction (1) describes the rapid reduction of bicarbonate reacting directly with Zn to give ZnO and formate. Even though it is reasonable to think that this reaction occurs through a chemical intermediate, as suggested by Jin el al [8], there is not enough evidence to exactly determine the reaction mechanism and the intermediate, and therefore it has been decided to consider the global reaction between bicarbonate and zinc, as indicated with reaction (1). Reaction (2) is the oxidation of Zn with water to form ZnO and hydrogen. While it was found that in the case of some metals such as Fe this reaction is not produced in the absence of bicarbonate in the media, in the case of the Zn, Mn or Al, Jin et al [10] proved that the reduction of water to give hydrogen is produced without participation of bicarbonate.
The second step is the one that controls the reaction rate after Zn is completely oxidized. It mainly consists of reaction (3), through which the remaining HCO3
reacts with hydrogen dissolved in the liquid phase.
Moreover, at long residence times, and especially at the higher temperatures considered in this work (300 and 325ºC), the results of Jin et al [8] show that the yield of formic acid slightly decreases. According to Yu et al [23], this is because formic acid and formiate suffers decomposition under hydrothermal conditions at high temperatures following reactions (4) and (5). Nevertheless, conversion of formate due to reaction 5 is negligible in comparison to reaction 4 and it has not been taken into account. In reaction 4 it is considered that CO2 formed is readily dissolved in the aqueous phase as bicarbonate. Note that reaction 3 and 4 are reverse reactions, but they are expressed as independent reactions for clarity in the adscription of subindexes in kinetic constants. Even though they are opposite reaction the chemical equilibrium is not reached until the last steps of the reactions, and in many of the simulations carried out equilibrium is not reached.
The oxidation of Zn particles is considered to follow a shrinking core reaction model, and the conversion of zinc ,XZn was defined as in eq. 2
𝑋𝑍𝑍=𝑅0
3−𝑟3
𝑅03 eq. 2
Where r is the radius of the non-reacted core of the particles and R0 is the initial radius of the Zn particle. To select if the controlling mechanism of the shrinking core model is the reaction or the diffusion (internal or external) the evolution of the conversion of bicarbonate and of the relation between the radius of the unreacted core radius ( r) divided by the initial radius of the particle (Ro ): r/Ro versus the relative reaction time (ratio between the time and the time at which the whole Zn particle is converted (tf)), calculated from experimental data from Jin el al[11], is presented in figure 1. It is observed that at low reaction times both parameters linearly decrease with the relative reaction time, indicating a control of the chemical reaction. However, at longer times this trend changes, adopting the typical form of the internal diffusion control rate. Therefore, it is concluded that both resistances control the process [24]. Thus the reaction rate of Zn is expressed as the variation of the radius of the unreacted core as expressed in eq. 3 [24] as a function of the diffusion through the particle and of the kinetics of reactions 1 and 2.
−
𝑑𝑟𝑑𝑑=
(𝑅𝑜−𝑟)𝑟/𝑅𝑜 1𝐷𝑒 +𝑘1·𝑐𝐻𝐻𝐻3−+𝑘21
eq. 3
6
Figure 1. Evolution of the zinc conversion and of the relation between the radius of the
unreacted core r divided by the initial radius of the particle Ro (r/Ro) with the relative reaction time (ration between the time and the time at which the whole Zn particle is converted), using
the experimental data of Jin el al [11]
The mass balances of the main species involved in the reaction are presented below. In eq. 4 the balance to the bicarbonate is shown taking into account that it is consumed by reduction, first directly with metallic Zn (reaction 1) and later with H2 (reaction 3), and that it is produced through the decomposition of formic acid to H2 and CO 2 (reaction 4), which in basic media is absorbed in the liquid phase as bicarbonate.
𝑑𝑐𝐻𝐻𝐻3−
𝑑𝑑 =− 3𝑍𝑍𝑛𝑜𝑟2
𝑅𝑜3𝑉𝐿 �
1 (𝑅𝑜−𝑟)𝑟/𝑅𝑜
𝐷𝑒 +𝑘1·𝑐𝐻𝐻𝐻1 3 −
� − 𝑘3·𝑐𝐻2·𝑐𝐻𝐻𝐻−3 +𝑘4·𝑐𝐻𝐻𝐻𝐻𝑍 − eq. 4
Where: nZno is the initial number of mol of zinc and VL is the volume of the liquid phase inside the reactor.
The exponent n in the kinetic equation of reaction 4 was correlated using eq. 5 according to the work of Yu et al [23] ], who indicates that the reaction does not follow a first order kinetic equation.
𝑍= 1.4671 +25.6595𝑇 + 0.0007024 · ln𝑇;𝑇= [𝐾] eq. 5
The balance to formate is presented in eq. 6. The formate is generated by reduction of bicarbonate in reactions 1 and 3 and consumed by decomposition to CO2 and H2 by reaction 4 and to CO and water by reaction 5.
𝑑𝑐𝐻𝐻𝐻𝐻−
𝑑𝑑 = 3𝑍𝑍𝑛𝑜𝑟2
𝑅𝑜3𝑉𝐿 �
1 (𝑅𝑜−𝑟)𝑟/𝑅𝑜
𝐷𝑒 +𝑘1·𝑐𝐻𝐻𝐻1 3 −
�+𝑘3·𝑐𝐻2·𝑐𝐻𝐻𝐻3−− 𝑘4·𝑐𝐻𝐻𝐻𝐻𝑍 − eq. 6 0
0.2 0.4 0.6 0.8 1
0 0.2 0.4 0.6 0.8 1
(1
-XZn
)/ r
/Ro
t/t 100% Zn conversion
7
The balance to the hydrogen is presented in eq. 7
𝑑𝑍𝐻2 𝑑𝑑 =−
𝑑𝑍𝑍𝑛 𝑑𝑑 +
𝑑𝑍𝐻𝐻𝐻3−
𝑑𝑑 eq. 7
Where nH2, nZn and nHCO3- are the number of mol of H2 (total, in gas and in liquid phase), Zn and of bicarbonate. The number of mol of Zn and of bicarbonate are calculated as indicated in eq. 8 and 9 respectively.
𝑑𝑍𝑧𝑛 𝑑𝑑 =
3𝑍𝑍𝑛𝑜𝑟2 𝑅𝑜3
𝑑𝑟
𝑑𝑑 eq 8
𝑑𝑍𝐻𝐻𝐻3−
𝑑𝑑 =
𝑑𝑐𝐻𝐻𝐻3−
𝑑𝑑 ·𝑉𝐿 eq.9
Most of the hydrogen generated passes to the gas phase increasing the pressure in the reactor, and only a part remains dissolved in the aqueous phase, according to its solubility, and is thus able to react with bicarbonate. The solubility of hydrogen in the liquid phase, is calculated using the predictive Soave-Redlich-Kwong equation [25], depending of temperate and of the hydrogen pressure inside the reactor, which is calculated as a function of the amount of hydrogen generated with equation 10.
𝑃𝐻2=
𝑅𝑇 𝑉𝑚𝐻2−𝑏−
𝑎
𝑉𝑚𝐻2+𝑏·𝑇0.5;𝑤ℎ𝑒𝑟𝑒𝑎= 0.42748
𝑅2·𝑇
𝑐𝐻22.5
𝑃𝑐𝐻2 𝑏= 0.08664 · 𝑅·𝑇𝑐𝐻2
𝑃𝑐𝐻2 eq. 10
Where PH2 is the partial pressure of H2, VmH2 is the molar volume of hydrogen, and TcH2 and PcH2 are the critical temperature and pressure of hydrogen. In this equation, the molar volume of hydrogen is not constant due to the varying reaction conditions (temperature, pressure and volume available for the gas phase in the reactor), and it is calculated according to equation 11:
𝑑𝑉𝑚𝐻2 𝑑𝑑 =
𝑉0+𝑑𝑉𝐻2𝐻𝑒𝑒𝑒𝑒𝑜𝑟𝑒𝑒𝑒𝑑𝑑𝑒
𝑑𝑛𝐻2𝐺 𝑑𝑒
eq. 11
Where V0 is the initial free volume in the reactor. dVH2O is the volume variation associated to the water evaporation or condensation in the reactor and nH2G is the number of mol of hydrogen in the gas phase.
The values of kinetic constants and of the diffusion constant De were obtained by minimizing the squared error between experimental and calculated formic acids yields at a constant temperature or using the temperatures registered in the experiments, minimizing the value obtained in eq. 12
𝑆𝑆𝑆𝑆𝑅𝑆𝐷𝑆𝑅𝑅𝐻𝑅= (𝑒𝑥𝑝𝑒𝑟𝑝𝑝𝑒𝑍𝑝𝑎𝑙𝑓𝑜𝑟𝑝𝑝𝑎𝑝𝑒𝑦𝑝𝑒𝑙𝑦𝑣𝑎𝑙𝑣𝑒 − 𝑝𝑟𝑒𝑦𝑝𝑐𝑝𝑒𝑦𝑓𝑜𝑟𝑝𝑝𝑎𝑝𝑒𝑦𝑝𝑒𝑙𝑦𝑣𝑎𝑙𝑣𝑒)2 eq. 12
Moreover, in order to model the evolution of temperature during the reaction, the energy balance was added to the model, taking into account the enthalpy of reaction and the heat transfer trough reaction walls to the oven, according to the following equation:
𝑑𝑇𝑒 𝑑𝑑 =
(−∆𝐻𝑅1 )·𝑟1+(−∆𝐻2)𝑟2+�−∆𝐻𝑅3�·(𝑟3−𝑟4) +𝑈·𝐴𝑟·(𝑇𝐸𝐸𝑒−𝑇𝑒)−𝑑𝑚𝐻2𝐻𝑒𝑒𝑒𝑒𝑜𝑟𝑒𝑒𝑒𝑑𝑑𝑒 ∆𝐻𝐻𝑎𝐻 (𝑚𝐻2𝐻+𝑚𝐻𝐻𝐻3)·𝑐𝑃𝐻2𝐻+𝑚𝑍𝑛𝑍𝑐𝑃𝑍𝑛 Eq 13
8
𝑟1=3𝑍𝑍𝑛𝑜𝑟
2 𝑅𝑜3
⎝ ⎜
⎛ 1
(𝑅𝑜−𝑟)𝑟 𝑅𝑜
𝐷𝑒 +𝑘1·𝑐𝐻𝐻𝐻1 3 −⎠
⎟
⎞ Eq. 14
𝑟2=3𝑍𝑍𝑛𝑜𝑟
2
𝑅𝑜3 �
1 (𝑅𝑜−𝑟)𝑟
𝑅𝑜 𝐷𝑒 +𝑘12
� Eq. 15
𝑟3= 𝑘3·𝑐𝐻2·𝑐𝐻𝐻𝐻3− Eq.16
𝑟4=𝑘4·𝑐𝐻𝐻𝐻𝐻𝑍 − Eq. 17
A term considering the latent heat corresponding to water evaporation was included in order to take into account the evaporation or condensation caused by the water liquid-vapor equilibrium inside the reactor. As a simplification, the heat capacity of pure water, obtained from National Institute of Standards and Technology (NIST) [33], was considered instead of the heat capacity of the bicarbonate solution. In the case of zinc, the heat capacity was obtained from the work carried out by Grønvold et al. [27]
For obtaining the global heat transfer coefficients, heating profiles without reaction were correlated with the model by minimizing the predicted temperature and the experimental temperature profile in experiments without reaction, defining the error as indicated in eq. 18
𝑆𝑅𝑅𝐻𝑅= (𝑆𝑥𝑝𝑒𝑟𝑝𝑝𝑒𝑍𝑝𝑎𝑙𝑇𝑒𝑝𝑝𝑒𝑟𝑎𝑝𝑣𝑟𝑒𝑣𝑎𝑙𝑣𝑒 − 𝑃𝑟𝑒𝑦𝑝𝑐𝑝𝑒𝑦𝑇𝑒𝑝𝑝𝑒𝑟𝑎𝑝𝑣𝑟𝑒𝑣𝑎𝑙𝑣𝑒)2 eq.
18
The results obtained for the global heat transmission coefficient U are presented in table 1:
Table 1. Correlated global heat transfer coefficients
U (kW/m2ºC) Temperature (ºC)
0.7554 275
0.7941 300
0.8756 325
All the coefficients are in the expected range of the typical values of transmission coefficients in natural convection of gasses (0.5 – 1 kW/m2ºC).
Finally, it must be considered that the reaction studied in this work involves different ionic species, which may react differently. In particular, the different ions formed by dissociation of carbonic acid in the aqueous media may have a different behavior. It is therefore necessary to quantify the concentration of each of these ions, in order to verify that the predominant ion in the mixture is bicarbonate, as assumed in the mechanism presented with reactions 1-5. For this reason, applying the results of the model, the ionic equilibrium has been studied to determine which are the predominant species in the conditions considered in this work. For this purpose, the equilibrium conditions considered are water ionic equilibrium (eq. 19), the acid-base equilibrium of carbonic acid (eq. 20) and bicarbonate ion (eq. 21), and formic acid and formate ion (eq. 22).
9
𝐾𝑎 𝑐𝑎𝑟𝑏𝑐𝑍𝑐𝑐 𝑎𝑐𝑐𝑑=[𝐻𝐻𝐻3
−][𝐻
3𝐻+]
[𝐻2𝐻𝐻3] eq.20 𝐾𝑎 𝑏𝑐𝑐𝑎𝑟𝑏𝑐𝑍𝑎𝑑𝑏=�𝐻𝐻3
−2�[𝐻3𝐻+]
[𝐻𝐻𝐻3−] eq. 21 𝐾𝑎 𝑓𝑐𝑟𝑚𝑐𝑐 𝑎𝑐𝑐𝑑=[𝐻𝐻𝐻2
−][𝐻3𝐻+]
[𝐻2𝐻𝐻2] eq. 22
The values of the water ion product water ionic product were calculated using eq. 23 proposed by Marshall & Franck [28]
log10𝐾𝑤∗ =−4.098 +−3245.2𝑇 +2.2362 · 10 5
𝑇2 +−3.984 · 10 7
𝑇3 +�13.957 +−1262.3𝑇 +8.5641 · 10 5
𝑇2 �· log10𝜌𝑤∗
Eq. 23
The density of water in eq. 23 depends on the pressure inside the reactor, which depends on the amounts of hydrogen and water in the gas phase. The amount of hydrogen was calculated as described in eq. 11, and the amount of water in gas phase as result of the liquid-vapor equilibrium was calculated using Raoult’s Law applying Antoine’s equation [26].
𝑃𝐻2𝐻=𝑃𝐻2𝐻0 𝑥𝐻2𝐻 Eq. 24
Therefore, the total pressure was calculating using eq. 25, where Pairo=1 atm.
𝑃𝑑𝑐𝑑𝑎𝑡=𝑃𝐻2𝐻+𝑃𝐻2+𝑃𝑎𝑐𝑟0 Eq. 25
The values of the acid constants of carbonic acid, bicarbonate ion and formic acid were calculated using eq. 25 [29, 30], 26 and 20. Eq. 27 and 28 were obtained by simulation using the software Aspen Plus® ELECNRTL package method.
𝑝𝐾𝑎𝑓𝑐𝑟𝑚𝑐𝑐 𝑎𝑐𝑐𝑑 =−57.528 +2773.9𝑇 + 9.1232 · ln𝑇; 𝑇[=]𝐾 Eq. 26
𝑝𝐾𝑎𝑐𝑎𝑟𝑏𝑐𝑍𝑐𝑐 𝑎𝑐𝑐𝑑 =−231.465 +12092.1𝑇 + 36.7816 · ln𝑇; 𝑇[=]𝐾 Eq. 27
𝑝𝐾𝑎𝑏𝑐𝑐𝑎𝑟𝑏𝑐𝑍𝑎𝑑𝑏 =−216.05 +1243137𝑇 + 35.4819 · ln𝑇; 𝑇[=]𝐾 Eq. 28
Thus, the resulting ionic balance is shown in eq. 29
eq. 29
10
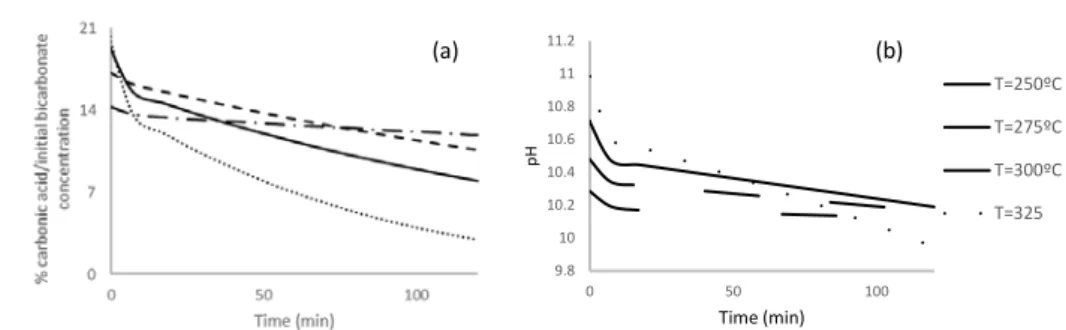
Figure. 2. Evolution of the % of the Carbonic acid (a) and the pH (b) in the reaction solution.
In part b) of Figure 2 the evolution of the calculated pH of the reaction media with reaction time is shown. The same behavior is observed at all temperatures conditions: starting in alkaline conditions, a gradual decrease of pH,is observed, but remaining in strong basic conditions (pH>10). This reduction of pH can be explained by the formation of formate, and its equilibrium with formic acid, in addition to the degradation of formic acid and the conversion of bicarbonate.
At a temperature of 325 ºC, both parameters, pH and % of carbonic acid presents a different behavior, decreasing at a higher rate than in the other cases. This can be due to the closeness of these conditions to the water critical point (218 atm and 374ºC). In the case of 325 ºC, the calculated pressure reached values of 210 atm, very close to the critical pressure of water. Furthermore, the bicarbonate conversion in this case is very high.
4. Results
4.1 Influence of temperature and residence time: experimental results
Figure 3 presents the experimental evolution of the yield of formation of formic acid obtained in this work, for a ratio Zn/NaHCO3 = 5. This figure also presents the formic acid yields calculated with the model, as well as the experimental and calculated temperature profiles along the reaction. In figure 4 the predictions of the model are compared to the experimental results of Jin et al [8], obtained with a ratio Zn/HCO3-=10.
9.8 10 10.2 10.4 10.6 10.8 11 11.2
0 50 100
pH
Time (min)
T=250ºC
T=275ºC
T=300ºC
T=325
11
Figure 3. Formic acid yield prediction and experimental data (a, c and e) and temperature
profiles (b, d and f) with and out reaction at different for different operation temperatures
In figure 3, it is observed that, as described in literature [8] (figure 4), high formate yields are obtained in the beginning of the reactions while in a second step the reaction rate is slower and there even is a decrease in the yield at the highest temperatures (part e) of figure 3). Nevertheless, it seems clear that there is no increment in the yield with the increasing temperature, in contrast to the trend of increasing yields at increasing temperatures described by Ji et al [8] (Figure 4). This can be explained by the heating profile in the experiments performed in tis work. While Jin et al [8] achieved the heating in a few seconds, parts, b), d) and f) shows that in the experiments presented here around 15 minutes were needed to reach the desired temperature. As most of the conversion is occurring in the first minutes, the slow heating in the system is causing that in the initial step of the reaction the temperature in the three experiments is essentially the same. Thus, the yields reached are also similar. The temperature profile also shows that there was a significant increment in the temperature associated to the heat of the reaction. The reactions are globally exothermic, and the global temperature of the process is expected to rise between 30-35 ºC, which is consistent with the increment of temperature experimentally observed.
0 15 30 45 60
0 30 60 90 120 150 180
Fo rm ic aci d y ie ld (% ) Time (min)
Model predicition T=275 ºC Experiment T=275 ºC
0 15 30 45 60
0 30 60 90 120 150 180
Fo rm ic aci d y ie ld (% ) Time (min)
Model prediction T=300 ºC Experiment T=300 ºC
0 20 40 60
0 20 40 60 80 100 120
Fo rm ic aci d y ie ld (% ) Time (min)
Model prediciton T=325 ºC Experiment T=325 ºC
0 80 160 240 320
0 10 20 30
Temp er at ur e ( ºC ) Time (min)
T reaction exp T reaction predicted T no reaction exp T no reaction predicted
0 70 140 210 280 350
0 10 20 30
Temp er at ur e ( ºC ) Tme (min)
T reaction exp T reaction predicted
T no reaction exp T no reaction predicted
0 100 200 300 400
0 5 10 15 20 25 30 35 40 45
Temp er at ur e ( ºC ) Time (min)
T reaction exp T reaction predicted T no reaction exp T no reaction predicted
(a) (b)
(c) (d)
12
Figure 4. Comparison of the formic acid yields predicted with the model to the experimental
data of Jin et al [8], obtained with a Zn/HCO3
ratio of 10.
4.2 Correlation of reaction kinetic parameters
As described in Section 3, kinetic constants of reactions 1-4 were correlated to experimental data reported in this work and to literature data reported by Jin et al. [8]. The results are reported in Figure 5 as Arrhenius plots (ln k vs. 1/T). It can be observed that the correlated kinetic constants accurately follow Arrhenius law, which reinforces the confidence in the reliability of the model and allows calculating the corresponding activation energies and pre-exponential factors. Results are reported in Table 2. With these parameters, the model is able to predict the yields of formation of formate with an average deviation of 12% and a maximum deviation of 25%. The model is also able to predict the temperatures with an average deviation of 24ºC with respect to the experimental temperature profile.The main source of error in the prediction of temperature is estimated to be the lack of stirring of reactor contents, which may lead to inhomogeneity in temperature which may affect the accuracy of temperature measurements.
Figure 5. Arrhenius plots of correlated kinetic constants of reactions 1-4.
Table 2. Correlated reaction kinetic constants: pre-exponential factors and activation energies 0
20 40 60 80
0 50 100 150
Fo
rm
ic
aci
d y
ie
ld
(%
)
Time (min)
Experimental formic yield T=250 Ji Experimental formic yield T=275 Ji Experimental formic yield T=300 Ji Experimental formic yield T=325 Ji Predicted formic yield T=250 Jin et Predicted formic yield T=275 Jin et Predicted formic yield T=300 Jin et Predicted formic yield T=325 Jin et
R² = 1
R² = 0.9872 R² = 0.9791 R² = 0.9956
-25 -20 -15 -10 -5 0
0.0015 0.00175 0.002
Ln K
1/T
13
Value Units
A1 1390000 m·L·mol
-1 ·min-1
Ea1/R 15200 K
A2 1.9·109 m·min-1
Ea2/R 10600 K
A3 1020000 L·mol
-1 ·min-1
Ea3/R 9000 K
A4 1·10
20
L(n-1)·mol-(n-1)·min-1
Ea4/R 29200 K
The results of the model are compared with experimental results obtained in this work in Figure 3, and with experimental data reported by Jin et al. [8] in Figure 4. Comparing experimental and calculated results, it can be observed that the model is able to reproduce the experimental results obtained in this work as well as data reported by Jin et al. [8] with good accuracies, which demonstrates its reliability. In particular, the model is able to reproduce both the rapid conversion to formic acid during the first minutes of reaction, and the slow conversion at longer times, and even the decomposition of formate at higher temperatures and long residence times.
4.3 influence of the ratio Zn/ NaHCO3
Different Zn/ NaHCO3 molar ratios were tested at 275 ºC, to analyze the influence of the amount of Zn in the production of formic acid. In figure 5, the experimental results obtained in this work and the predicted evolution of the formate yield at 275ºC with different Zn/ NaHCO3 ratios are shown. Comparing the experimental results obtained with Zn/ NaHCO3 ratios of 5 and 10, it can be observed that higher formate yields are obtained at shorter times when the ratio is increased. This result is obtained because with higher Zn/ NaHCO3 ratios, the fast reaction of conversion of NaHCO3 with Zn (reaction 1) is promoted. Moreover, it can be observed that the model accurately reproduces the experimental results obtained with the two Zn/ NaHCO3 ratios tested in experiments.
0 13 26 39 52 65 78
0 50 100 150
14
Jin et al. [8] also made a sensibility study to determine the optimal Zn/HCO3- ratio for several reagents concentrations. The experimental results reported by Jin et al. [8] are compared with the predictions of the model in figure 6. It can be observed that, in agreement with the results reported in this work, Jin et al. [8] also obtained increasing yields of formiate when the Zn/HCO3
ratio was increased. Moreover, it is shown that the model is also able to predict the influence of the Zn excess at different concentrations and experimental conditions determined in the experiments of Jin et al. [8].
Figure. 6 Comparison of yields of formate at different Zn/HCO3 ratios using (a) 10 mmol of Zn
and (b) 1 mmol of NaHCO3 predicted by the model and the experimental results from Jin et al. [8]
4.4 Influence of the heating rate
In section 4.1 it is observed that higher yields were obtained when the heating rate is higher, because this promotes the fast reaction with metallic Zn (reaction 1) that is proceeding in the first minutes of the reaction. In figure 7 the predictions of the model corresponding to two different heating rates and a concentration of 0.5 M HCH3, a Zn/HCO3
ratio of 5 and a final reaction temperature of 300ºC are shown. It is observed that the model predicts that formate yields increase when the heating rate is increased, especially in the first minutes of the reaction, corresponding to the promotion of the fast reaction with metallic Zn as indicated. Therefore, in order to optimize the reaction performance, it is important to achieve a fast heating of the reaction mixture.
15
Figure 7. Evolution of formate yield at different heating rates
4.5 Influence of the pressure
As discussed in section 4.3, Zn excess is a very important factor in improving the yield of formation of formate. Nevertheless, only a part of the Zn is used to reduce the CO2, as the other part is oxidized by water, generating H2. This H2 increases the pressure inside the batch reactor. Increasing pressure is also beneficial for improving the yield of formate because it increases the solubility of H2 in the aqueous phase, increasing the reaction rate of reaction 3. Indeed, in the case of a Zn/bicarbonate ratio of 5, the final hydrogen pressure calculated was 10.3 MPa, with a corresponding hydrogen solubility of 0.061 mol·L-1, while in the case of Zn/ratio 10, the final hydrogen pressure reached was 19.9 MPa, increasing the hydrogen solubility almost 6 times in water, up to value of 0.346 mol·L-1.
Following these considerations, using the model the separate effect of pressure was investigated. As a batch closed reactor was used to study the reaction, the increase of the final pressure was achieved varying the initial filling of the reactor, because if a higher proportion of the reactor volume is filled with the initial aqueous solution, a higher final pressure is reached. In figure 8 the predictions of the model corresponding to the reduction of CO2 with a molar concentration of 0.5 M of HCO3, a Zn/HCO3 ratio of 5 and a final reaction temperature of 300ºC, for fillings of 25% (final pressure of 17.5 MPa), 50% (final pressure of 22.7 MPa) and 75% (final pressure of 35.8 MPa) are presented. In order to compare the effect of pressure with the effect of the Zn/HCO3 ratio, in part (b) of figure 8, model predictions corresponding to a constant reactor filling of 50% and variable Zn/HCO3 ratios are presented. It is observed that, working with a fixed Zn/HCO3
ratio of 5, the time needed to achieve a 50% reaction yield is reduced from 75 minutes when pressure is 22.7 MPa, to 20 minutes when pressure is 35.8 MPa. Comparing this variation with the results reported in figure 8 (b), it can be seen that in order to achieve similar reduction of reaction time without varying pressure, the Zn/HCO3 ratio has to be increased from 5 to 10. Therefore, it can be observed that the operation at a higher pressure allows a significant improvement of the performance of the reaction without increasing the costs associated to the metal reductant. On the other hand, this brings with it an increment in the cost of the reactors, which must withstand higher pressures.
0 10 20 30 40 50
0 20 40 60 80
Fo
rm
at
e y
ie
ld
(%
)
Time (min)
16
Figure 8. Evolution of formate yield at different operation pressures (a) and different Zn/HCO3
-ratios (b)
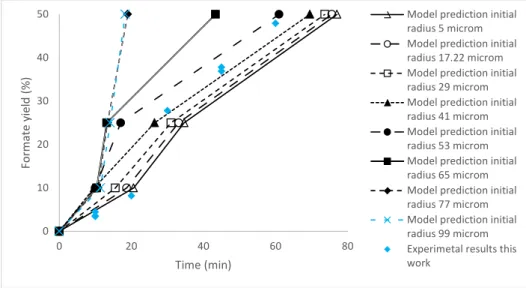
4.6 Influence of the size of Zn particles
In figure 9 the evolution of the formate yield calculated with the model varying the initial radius of zinc particles is presented, considering a Zn/HCO3 ratio of 5, a temperature of 300ºC, a HCO3 initial concentration of 0.5 M and an initial reactor filling of 50 %. It is observed that, in the range of particle sizes investigated, the reaction rate increases when particle size is increased. A possible reason for this result is that, using bigger particles, the reaction of oxidation of zinc (reaction 2) is slowed down, allowing the reaction between zinc and bicarbonate (reaction 1) to proceed for a longer fraction of the reaction time.
Figure 9. Evolution of formate yield at different particle sizes 0
10 20 30 40 50
0 20 40 60 80
Fo
rm
at
e y
ie
ld
(%
)
Time (min)
17
4.6 Experiments in supercritical conditions
In the last part of the reaction the reaction, when Zn is already completely oxidized to ZnO, the reaction proceeds between HCO3- and H2, both dissolved in liquid phase, and it is limited by the low solubility of H2 in in the liquid phase. On the other hand, in supercritical conditions, H2 and CO2 would be in the same supercritical phase, and the solubility limitation would be overcome. In order to test if this condition could improve the reaction performance, an experiment was carried out setting a subcritical temperature of 350ºC during the first 25 minutes of the reaction, when the predominant mechanism of formate formation is the solid liquid reaction 1, and a supercritical temperature of 400ºC during the subsequent 55 min, during which the predominant reaction is reaction 3 between bicarbonate and hydrogen. A conversion of bicarbonate of 28% was achieved with a yield of formic acid of 14%, results that are much lower that the values obtained at lower temperature conditions in liquid phase, where yields of at least 40% were achieved. This result can be due to the faster decomposition rate of formate at higher temperatures. It is therefore concluded that the operation at supercritical temperature conditions is not favorable for this reaction.
4.7 Influence of reactor materials
It is well known the capacity of Ni to catalyze chemical reactions, in this case the reduction of bicarbonate [32]. For this reason, in screening reactions many authors prefer to use SS-316 reactors or Teflon lined reactors to exclude possible catalytic effects of the wall of the reactor [8], even though the surface of the reactor wall in contact with the reaction mixture is low in comparison to the surface area of a common porous catalyst. It is also well known that most alloys used for standing high temperatures such as Ni alloy 600 or 625 contains high nickel amounts, so it would be useful to know the different behavior that can be expected from these materials. In this work, selected experiments at different temperatures were performed both in SS316 reactors and in Ni alloy 625 reactors in order to test the influence of reactor materials on the reaction. The yields obtained for experiments performed with a HCO3
concentration of 42 g/L and Zn/NaHCO3 = 5 in reactors of both materials at different temperatures are compared in figure 10. It is observed that using Ni alloy or SS reactors, formate yields are equivalent. Therefore, the catalytic effect of the wall of the reactor can be discarded.
Figure 10. Comparison of formate yields obtained with a HCO3- concentration of 42 g/L and
Zn/NaHCO3 = 5 in reactors of both Ni Alloy and SS 316 at different temperatures
Conclusions
18
Using the experimental data obtained in this work and literature data, a kinetic model was proposed and incorporated to a mathematical model, which was able to predict yields of formate with and average error of 12% and a maximum error of 25%. The model was able to reproduce experimental data reported in this work and literature data with similar accuracies, and fitted reaction constants followed Arrhenius law. This indicates that the model is reliable with high predictive capacity. The model includes the influence of parameters such as temperature, metal reductant particle size, metal/HCO3- ratio, temperature, heating rate or pressure.
Using the model and the experimental data, an analysis of the influence of the main parameters of the process was performed. Selectivity to formate close to 100% and yields up to 75% were reached. The optimum working temperature was 300ºC, and operation at supercritical temperature conditions was detrimental to reaction yield due to the decomposition of formate. The process kinetics were favored by a high Zn excess, or equivalently by operation at high pressures that increase hydrogen solubility in the liquid phase.
Acknowledgements
This research has been financed by the Spanish Ministry of Economy and Competitiveness through project ENE2014-53459-R. M.D. Bermejo thanks the Spanish Ministry of Economy and Competitiveness for a Ramón y Cajal fellowship. D. Roman-Gonzalez Bermejo thanks the Spanish Ministry of Economy and Competitiveness for a FPU fellowship.
Literature
[1] T Sakakura, JC Choi, H Yasuda.Transformation of Carbon Dioxide. Chemical Reviews 107 (2007) 2365-2387.
[1] GA Olah, A Goeppert, GK Surya Prakash. Chemical Recycling of Carbon Dioxide to Methanol and Dimethyl Ether: From Greenhouse Gas to Renewable, Environmentally Carbon Neutral Fuels and Synthetic Hydrocarbons J. Organic Chemistry 74 (2009) 487-498.
[3] A Fujishima, K Honda. Electrochemical photolysis of water at a semiconductor electrode Nature 238 (1972) 37-38.
[4] K Maeda, K Domen, Photocatalytic water splitting: recent progress and future challenges. J. Physical Chemistry Letters 1 (2010) 7851-7861.
[5] S Fukuzumi, Y Yamada, Y. Shape- and Size-Controlled Nanomaterials for Artificial Photosynthesis. ChemSusChem 6 (2013) 1834-1847.
[6] A. Navarrete, G. Centi, A. Bogaerts, A. Martín, A. York, G. D. Stefanidis. Harvesting renewable energy for carbon dioxide catalysis. Energy Tec7) 1-17.
[7] Jeffrey S. Seewald, Mikhail Yu Zolotov, Thomas McCollom, 2005. Experimental investigation of single carbon compounds under hydrothermal conditions. Geochimica et Cosmochimica Acta 70 (2006), 446-460.
[8] F. Jin., Zeng X., Liu J., Jin Y., Wang L., Zhong H., Yao G., Huo Z, 2014. Highly efficient and autocatalytic H 2 O dissociation for CO 2 reduction into formic acid with zinc. (2014) Scientific Reports, 4 , 4503-4511
19
[10] F. Jin, Y. Gao, Y. Jin, Y. Zhang, J. Cao, Z. Wei, R. L. Smith Jr "High-yield reduction of carbon dioxide into formic acid by zero-valent metal/metal oxide redox cycles." Energy & Environmental Science 4 (2011).): 881-884.
[11] F. Jin, Y Gao, YJ Jin, YL Zhang, JL Cao, Z Wei, RL Smith. “High-yield reduction of carbon dioxide into formic acid by zero-valent metal/metal oxide redox cycles” Energy Environ. Sci. 4 (2011) 881−884
[12] C He, G Tian, ZW Liu, SH Feng. “A Mild Hydrothermal Route to Fix Carbon Dioxide to Simple Carboxylic Acids” Org. Lett. 12 (2010) 649−651.
[13] X Zeng, FM Jin, ZB Huo, T Mogi, A Kishita, H Enomoto. “Reduction of Carbon Dioxide in Hydrothermal Cracking of Polymer Wastes” Energy & Fuels 25 (2011) 2749−2752.
[14] Z Shen, Y Zhang, F Jin, “The alcohol-mediated reduction of CO2 and NaHCO3 into formate: a hydrogen transfer reduction of NaHCO3 with glycerine under alkaline hydrothermal conditions” RSC Advances, 2 (2012) 797-801
[15] Z. Shen, Y. Zhang, F. Jin, “From NaHCO3 into formate and from isopropanol into acetone: Hydrogen-transfer reduction of NaHCO3 with isopropanol in high-temperature water” Green Chem., 2011, 13, 820-823
[16] F Jin, X Zeng, Z Jing, H Enomoto, A potentially useful technology by mimicking nature-rapid conversion of biomass and CO2 into chemicals and fuels under hydrothermal conditions Ind. & Eng. Chem Res, 51 (2012) 9921-9937
[17] G Tian, HM Yuan, Y Mu, C He, SH Feng “Hydrothermal Reactions from Sodium Hydrogen Carbonate to Phenol” Org. Lett. 9 (2007) 2019−2021.
[18] Z Liu, G Tian, S Zhu, C He, H Yue, S Feng, “Ready Hydrothermal Reactions from Carbon Dioxide to Methane” Sust. Chem Eng, 1 (2013) 313-315
[19] Z Huo, M Hu, X Zeng, J Yun, F Jin, “Catalytic reduction of carbon dioxide into methanol over copper under hydrothermal conditions” Catalysis Today 194 (2012) 25-29.
[20] Takahashi, H., et al. (2006). "CO2 reduction using hydrothermal method for the selective formation of organic compounds." Journal of Materials Science 41(5): 1585-1589.
[21] Mar Pérez-Fortes, Jan C. Schoneberger, Aikaterini Boulamanti, Gillian Harrison, Evangelos Tzimas; Formic acid synthesis using CO2 as raw material: Techno-economic and environmental evaluation and market potential. International journal of Hydrogen energy; 41 (2016) 16444-16462.
[22] H. Yao, X. Zeng, Min Cheng, Jun Yun, Zhenzi Jing and Fangming Jin; Catalytic conversion of formic acid to methanol with Cu and Al under hydrothermal conditions. Bioresources; 7 (2012) 972-983.
[23] J.L. Yu, P.E. Savage. Decomposition of formic acid under hydrothermal conditions. Ind Eng Chem Res. 37 (9981) 2-10. doi:10.1021/ie970182e.
[24] Wiley J, Hepburn K, Levenspiel O. Chemical Reaction Engineering. Vol 19.; 1964. doi:10.1016/0009-2509(64)85017-X
20
[26]http://webbook.nist.gov; Chemistry. Last visit (25th/02/2017).
[27] Grønvold F, Stølen S. Heat capacity of solid zinc from 298.15 to 692.68 K and of liquid zinc from 692.68 to 940 K: Thermodynamic function values. Thermochim Acta. 2003;395(1-2):127-131. doi:10.1016/S0040-6031(02)00217-4.
[28] Marshall WL, Franck EU. Ion product of water substance, 0-1000 °C, 1-10,000 bars New International Formulation and its background. J Phys Chem Ref Data. 1983;10(2):295-304. doi:10.1063/1.555643.
[29] Bell JLS, Wesolowski DJ, Palmer DA. The dissociation quotients of formic acid in sodium chloride solutions to 200??C. J Solution Chem. 1993;22(2):125-136. doi:10.1007/BF00650679.
[30] Kim MH, Kim CS, Lee HW, Kim K. Temperature Dependence of Dissociation Constants for Formic Acid and 2,6-Dinitrophenol in Aqueous Solutions up to 175oC. J Chem Soc Faraday Trans. 1996;92(24):4951. doi:10.1039/ft9969204951.
[31] CRC Handbook of Chemistry and Physics; CRC press, 90th Edition, 2010.
[32] G. Yao, F. Chen, Z. Huo, F. Jin, Hydrazine as a facile and highly efficient hydrogen source for reduction of NaHCO3 into formic acid over Ni and ZnO catalysts, Int. J. Hydrogen Energy, 41 (2016) 9135–9139