Universidad Nacional de La Plata
Séptimas Jornadas de Economía
Monetaria e Internacional
La Plata, 9 y 10 de mayo de 2002
Bank Relationships: Effect on the Availability and Marginal
Cost of Credit for Firms in Argentina
Streb, Jorge M. (UCEMA); Bolzico, Javier (BCRA); Druck, Pablo
(UCEMA); Henke, Alejandro (BCRA); Rutman, José (BCRA) and
Bank relationships: effect on the availability and marginal cost of credit for firms in
Argentina
November 2001 (abridged version)
Jorge M. Streb, Javier Bolzico, Pablo Druck,
Alejandro Henke, José Rutman, and Walter Sosa Escudero ∗,∗∗
Abstract: The paper provides evidence on what affects at the margin the cost and
availability of bank credit for firms in Argentina. We study in particular how banks use different pieces of private and public information to screen firms and overcome informational asymmetries in the credit market. Some private information is transferable, like balance sheet data. Private information generated in relationships is not. To capture the closeness of bank relationships, we resort to the concentration of bank credit and the number of credit lines in a bank. We also consider public information available in the Central de Deudores.
The cost of credit is measured using overdrafts, the most expensive line of credit, at the bank that charges the highest rate for overdrafts. We find that the cost of credit is smaller for a firm with a close relationship to the marginal bank. Firms with large assets, a high sales/assets ratio, and a low debt/assets ratio pay a lower interest rate at the margin. A good credit history (no debt arrears and no bounced checks) and collateral also reduce the marginal interest rate.
The availability of credit is measured by unused credit lines as a proportion of total liabilities with the main bank. The availability of credit depends positively on a close relationship with the main bank. Large assets, a high return over assets, a high sales/assets ratio, a low debt/assets ratio, a good credit history, and collateral lead to higher credit availability. Our measure of unused credit lines is less ambiguous than traditional measures like leverage, which may indicate financial distress rather than availability of credit.
JEL: D82, E44, G14, G20
∗ The Centro de Economía Aplicada of Universidad del CEMA (UCEMA) and the Banco Central de la República Argentina (BCRA) jointly undertook the project, as part of the Inter-American Development Bank (IADB) Research Network Project ‘Determinants and Consequences of Financial Constraints Facing Firms in Latin America and the Caribbean’. Pablo Druck and Jorge Streb are at UCEMA. Alejandro Henke and José Rutman are at the BCRA, but the viewpoints expressed here do not necessarily represent the position of the BCRA (Javier Bolzico was also at the BCRA when the project got started). Walter Sosa Escudero is an invited researcher from the Universidad Nacional de La Plata (UNLP).
1. Introduction
This paper tries to evaluate the determinants of the variation in the cost and availability of bank credit across firms in Argentina. This issue has a high profile because many firms complain loudly about bank credit being too expensive. There is also widespread complaint about limited access to bank credit. These same complaints are voiced in many places, but in Argentina this happens against the backdrop of underdeveloped financial markets, not only compared to OECD countries, but also to emerging countries like Chile (Caballero, 2000). Stock market capitalization is low, and so is financial intermediation in terms of the ratio of M3 to GDP, or of loans to the private sector to GDP. To complete this picture, in the last two years high country risk, and crowding out by the public sector, have made the problem of credit constraints particularly acute for firms in Argentina.
To study credit constraints, a cross-section for October 2000 is built with data collected by the Banco Central de la República Argentina (BCRA) from financial institutions. All financial institutions supervised by the central bank are referred to as “banks” for short. Bank credit is particularly relevant for firms in Argentina. Mayer (1994) defines as a banking economy a country with a small proportion of quoted firms, and as a market economy a country with a high percentage of quoted firms. Argentina can clearly be classified as a banking economy, because less than a hundred firms are quoted in the stock exchange,
whereas the financial system grants credit to over a hundred thousand legally incorporated firms.
The theoretical literature on credit constraints emphasizes the importance of information problems. Our goal is to see how different bits and pieces of information affect the cost and access to credit. In Argentina, the changes in this front have been substantial. There was practically no credit market in 1990. Banks had imploded, and the little assets they had were concentrated in government securities. After the Convertibility plan was
launched in 1991 with the aim of achieving price stability, lending to firms had to start almost from scratch. Since it takes time to generate a track record to evaluate firms, it seems no wonder that firms should initially have been subject to large individual credit constraints. Besides this internal information of banks, which can be termed relationships, private credit bureaus and public credit registers developed during the 90’s, pooling part of this internal information.
degree that firms resort to trade credit to finance their operations. We propose to look instead at the lack of unused credit lines as an indicator of credit constrained firms. Our study can throw light on the intensive credit margin, which has to do with how much credit is available to a firm that already operates with the financial system. Since we do not have data on firms that have not received any credit from the financial system, the paper cannot explain extensive credit margins that determine whether a firm is cut off from bank loans or not.
Our main findings are as follows. The availability of credit depends positively on close relationships with a bank. Good characteristics of a firm (large assets, a high return over assets, a high sales/assets ratio, and a low debt/assets ratio), a good credit history (normal credit situation and no bounced checks) and collateral also lead to higher credit availability. Significantly, a good median credit situation in the public credit register leads to higher credit availability, suggesting that the Central de Deudores eases credit constraints for good firms. As to the cost of credit, the findings mostly parallel those of credit availability. The cost is smaller for a firm with a close relationship to a bank. Firms with large assets, a high sales/assets ratio, and a low debt/assets ratio pay a lower interest rate (returns over assets, however, turn out not to be significant). A good credit history and collateral also reduce the interest rate.
An important difference between the effects on the price and the quantity of credit is that the interest rate does not increase monotonically as the credit situation deteriorates, unlike credit availability that decreases monotonically. Similarly, the median credit situation in the public credit register does not affect the cost. These findings are consistent with credit rationing, which predicts that beyond a certain point it makes no sense for the lender to raise interest rates because that only increases the probability of default. Rather, as risk rises, lenders will cut back credit.
The paper proceeds as follows. Section 2 places our approach on how public and private information impacts the market for bank loans in the context of the existing literature on the topic. Section 3 describes the dataset constructed to characterize the workings of the loan market for firms in Argentina. Section 4 presents our regressions on the cost of credit and the access to credit at the margin. Section 5 presents the conclusions, as well as suggestions for further work.
2. Conceptual framework
We briefly review the theoretical literature on the role of information in credit markets, and previous empirical studies on how it affects the cost and access to credit of firms.
Informational asymmetries are a central issue in credit markets. Freixas and Rochet (1997) distinguish between three settings of asymmetric information: ex-ante asymmetric information (adverse selection), interim asymmetric information (moral hazard), and ex-post asymmetric information (costly state verification model, that can be related to ex-post moral hazard).
In the theoretical literature, asymmetric information has been identified as the source of equilibrium credit rationing. Asymmetric information pushes the market away from that of a perfectly competitive equilibrium where the intersection of demand and supply clear the market. The classic contribution by Stiglitz and Weiss (1981) predicts that a lender's expected return on a risky loan is a non-monotonic function of the interest rate. This can be due either to adverse selection, because as interest rates rise the best borrowers drop out, or to moral hazard, because at higher interest rates borrowers adopt riskier strategies. Hence, lenders may not be willing to supply more credit beyond a certain interest rate. This may lead to a credit rationing equilibrium, where borrowers are willing to demand more than they are supplied at the equilibrium interest rate. This type of credit rationing is an intensive limit, or type 1 credit rationing. If lenders refuse outright to supply any loans at all to some of the prospective customers at the prevailing interest rate, the borrower faces instead an extensive limit, or type 2 credit rationing. This is for example the case in the costly state
verification version of credit rationing in Williamson (1987).
To alleviate the degree of asymmetric information, banks resort to different mechanisms. Banks are precisely the organizations that specialize in recollecting information on potential borrowers, to price credit risks appropriately.1 A common practice by banks is to implement screening mechanisms (alternatively, good firms have an incentive to signal their type, in order to differentiate themselves from bad firms and get better terms on their loans). Another response to the problem of asymmetric information is the development of private
information through banking relationships.
In this regard, Petersen and Rajan (1994) distinguish between public and private information in lending activities. Private information is the information that lenders acquire in the course of relationships with borrowers, information that is not easily transferable to others. In this same line, Berger, Klapper, and Udell (2000) contrast relationship lending to pure transactions lending. Relationship lending is based on information gathered by the
lender through contact over time with the firm, its owner, and the local business community. Pure transactions lending is based on information from financial statements, credit scoring
and other similar quantitative techniques. This information is relatively public and transparent, and only requires the analysis of currently available data.
The idea of relationship lending is already in Akerlof (1970), in his example of local moneylenders in credit markets in India who can profitably lend because of their knowledge of local borrowers’ creditworthiness. Outside middlemen trying to arbitrage in that market, lending at the same high rates, would lose money due to the risk of attracting borrowers with poor repayment prospects. The emergence of financial intermediaries such as banks can thus be explained as a way to solve the problem of asymmetric information in financial markets.
Relationship information is especially important for small firms. Small firms produce less public information than large firms, which can instead resort directly to capital markets to place debt (Diamond, 1991). Relationships affect the bank-firm interaction in at least two dimensions. Concerning the amount of credit, Diamond (1984) shows that relationships allow a firm to have more access to credit. With respect to the cost of credit, there is no clear-cut association between interest rates and relationships. On the one hand, Diamond (1984) shows that a relationship with a single bank may reduce risk, leading to a lower interest rate charged. The reduction in interest rates is due both to the monitoring role of the bank, that reduces the incidence of moral hazard, and to an improved knowledge of the firm,
that helps to overcome the problem of adverse selection. On the other hand, relationships provide a bank with private information that is not verifiable. The bank that lends to a firm learns more about it than other banks. This informational advantage gives the bank market power over the firm, allowing it to extract rents attributable to knowing that the borrower is less risky than average (Sharpe, 1990). Summarizing, there are theoretical justifications for both an increase and decrease of a firm’s interest rate with closer relationships.
Whether other information is either private or public depends on the regulations in
place, like laws of habeas data that guarantee privacy. Public credit registers and private credit bureaus that pool the information of lenders allow a reduction of the degree of asymmetric information. Since information is costly to produce, other lenders might have an incentive to free ride and compete away the banks’ best clients if it becomes public information, which may reduce the incentives of banks to invest in relationship lending in the first place. While this may be the case for positive information on borrowers, negative
information helps to discipline borrowers, reducing problems of moral hazard.
worthwhile investment opportunities despite the guarantees they can provide. Even if there is no credit rationing, because interest rates rise to clear the market, firms suffer from credit constraints due to these inefficiencies. These problems can contribute to weak international financial links and an underdeveloped domestic financial market (Caballero and Krishnamurthy, 1999).
2.2. Empirical literature
Much of the literature on credit constraints faced by firms focuses on its effects on investment, which can be detected through the excess sensitivity of investment to liquidity (Schiantarelli, 1996, provides a survey of this literature). There is also a specific literature that looks at how bank relationships can contribute to ease liquidity constraints faced by firms. Hoshi, Kashyap and Scharfstein (1990), for instance, look at the associations of firms with banks in Japan, showing that the benefit of bank association for Japanese firms is that it reduces the excess sensitivity of investment to cash flow in times of financial distress.
We follow a different tack. Our approach resembles Petersen and Rajan (1994) in that we try to look more closely at the issue of credit availability in itself. The key insight in Petersen and Rajan is that the use of trade credit can be an indication of credit constraints. In their study of small business firms in the U.S., the average rate on bank loans is 1% per month, or 12% per year. They calculate that firms that do not take discounts for early
payment forsake a 2% discount to stretch the payment period 20 days more, equivalent to a 3% monthly interest rate, or a 44% annual interest rate. Accordingly, they use the percentage of discounts taken for early payment as an indication of firms that do not face credit constraints, because they have access to cheaper credit from the financial system. Conversely, the percentage of trade credit paid late is an indication of credit constrained firms.
If trade credit discounts taken is an indirect indicator of credit availability in banks, an
alternative is to try to assess credit availability in banks directly. This is meaningful if line of credit contracts, or loan commitment contracts, are an important source of loans. Melnik and Plaut (1986) state that loan commitment contracts are behind more than 70% of commercial and industrial loans in the U.S. They study the ex-ante tradeoffs between size of loan commitments, and other variables such as interest rate premium charged, and collateral offered. Since they concentrate on the ex-ante determinants of lines of credit contracts,
Putting together the approaches in Petersen and Rajan (1994) and Melnik and Plaut (1986), we propose the unused portion of pre-committed credit lines as a measure of firms that are not credit constrained. Unused credit lines can be interpreted as an intensive, not an extensive, measure of credit constraints. An extensive credit constraint is the case when no bank is willing ex-ante to sign a line of credit contract with a firm. All the firms in our sample have bank credit, so they do not face this type of constraint (except a few firms in our sample that only have write-offs). However, even those firms that are given a credit line face a maximum credit limit or commitment. This limit is potentially an intensive credit constraint. Firms that ex-post have unused credit lines are not credit constrained, but the lack of unused credit lines may provide direct evidence on firms that face intensive credit constraints. We also believe that unused credit lines may be a less ambiguous measure of credit availability than total debt figures that are often used in the literature.
As to the effect of banking relationships on access to credit, Petersen and Rajan (1994) show how their measures of lending relationships are related to less reliance on trade credit. They interpret this in the sense that firms with closer relationships face less credit constraints, having more access to cheaper bank credit. Later studies also find that relationships lead to more access to credit, using different measures of credit availability. Cole (1998) finds that a potential lender is more likely to extend credit to a firm with which it
has a pre-existing relationship. Machauer and Weber (2000) find that a firm obtains a higher proportion of financing from a bank with which it has a closer relationships, using as dependent variable the ratio of the total credit line at each bank relative to the total assets of the firm.
In relation to the effects of relationships on the cost of credit, using the interest rate paid on the last loan of each firm, Petersen and Rajan find that lending relationships affect the quantity of credit more than they affect the cost of credit. Their measure of number of
banks, that signals a weaker relationship, is related to a higher cost of credit, but the length of the relationship does not affect interest rates at all. On the contrary, also using the interest rate paid on the last loan, Berger and Udell (1995) find that borrowers with longer banking relationships pay lower interest rates. However, they restrict their analysis to lending under lines of credit. A recent study by D’Auria, Foglia and Marullo-Reedtz (1999) establishes that close relationships reduce the interest rate a firm is charged on uncollateralized overdraft
exclusively with one bank. A little bit of competition among banks reinforces the reduction in the firm’s interest rate, while increasing the number of banks still more leads to pay higher interest rates. We propose to look at a measure of the cost of bank credit faced by a firm at the margin. We recur to the most expensive type of loan, overdrafts. We pick the highest observed interest rate on overdrafts paid by a firm in the financial system. This account should be the last one used by a firm, which would attempt to exhaust cheaper sources of credit first.
3. Dataset
A database was assembled, drawing information mainly from the Central de Deudores del
Sistema Financiero (Center of Debtors of the Financial System) of the Banco Central de la
República Argentina (BCRA). As mentioned in the Introduction, we refer to all financial institutions as banks. The information on firms comprises incorporated firms that are “large debtors” or “principal debtors” of the financial system, which does not necessarily mean that they are large firms.
We put together a cross-section of interest rates and debt of firms with each individual bank for October 2000. This Section describes the main characteristics of this dataset. Previous researchers working with Central de Deudores, such as Berger, Klapper and Udell (2000), did not use the information on interest rates and on the balance sheets of
firms because they considered the information was too unreliable, if not altogether useless. To overcome the drawbacks in the underlying information, extensive preparatory groundwork was done before running the econometric estimates.
3.2 Bank liabilities
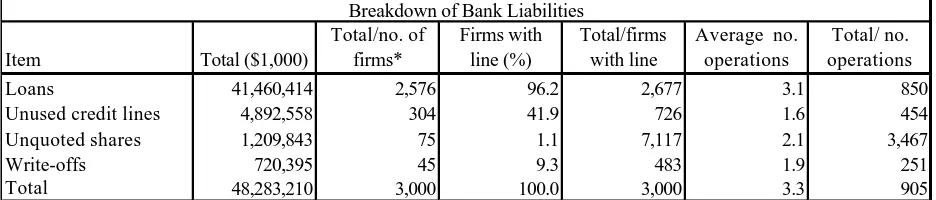
The information on the liabilities of each firm with the financial system covers four items: loans, unused credit lines, shares not quoted on the stock exchange, and write-offs. Though unused credit lines are a potential liability, we will simply call the aggregate figure “bank
liabilities”. This information on quantities is validated by the BCRA: the total for each item, added up over all the clients of each bank, has to agree with the amount reported by the bank to the BCRA on its balance sheet. If these totals do not coincide, the information is rejected.
Table 4 shows the liabilities for our complete sample of firms (including those that only have write-offs) for October 2000. The average number of operations refers to the
Table 4
Item Total ($1,000)
Total/no. of firms*
Firms with line (%)
Total/firms with line
Average no. operations
Total/ no. operations
Loans 41,460,414 2,576 96.2 2,677 3.1 850
Unused credit lines 4,892,558 304 41.9 726 1.6 454
Unquoted shares 1,209,843 75 1.1 7,117 2.1 3,467
Write-offs 720,395 45 9.3 483 1.9 251
Total 48,283,210 3,000 100.0 3,000 3.3 905
*16,095 firms with bank liabilities reported in October 2000. Source: Central de Deudores, BCRA.
Breakdown of Bank Liabilities
According to Información de Entidades Financieras published by the BCRA, liabilities in the whole financial system in September 2000 added up to 102 billion pesos, of which 36
billion corresponded to partnerships/sole proprietorships (5,162,305 cases) and 66 billion to corporations (116,960 cases). Our complete database of 16,095 firms adds up to 48 billion pesos in October 2000. These firms represent a little under 15% of the corporations, but over 75% of the debt of incorporated firms.
3.3. Interest rates on loans
Interest rates on each type of loan, as well as the average duration of these loans, is available since October 2000. The BCRA has not yet implemented a validation procedure similar to that applied to quantities, so interest rate figures are not very reliable. Appendix B describes how this information was processed. The validated interest rate information is presented in Table 7 (the total cases in the original database are listed in the last column).
Table 7
Total
Type of Loan Mean (%) Median (%) Std deviation Cases* cases**
Overdrafts 2.54 2.04 1.6 15,529 23,720
Discounted bills - guarantee A 2.22 2.17 0.4 20 21
Bills and promissory notes 1.28 1.19 0.5 13,465 19,517
House mortgages 1.04 1.02 0.2 77 103
Other mortgages 1.14 1.08 0.6 2,724 4,589
Car loans 1.41 1.46 0.3 509 660
Other pledges 1.27 1.20 0.9 2,530 5,279
Personal 1.82 1.75 0.7 530 1,198
Credit card 2.43 2.59 0.9 1,727 3,283
Interfinancial 4.97 0.75 19.9 132 216
To guaranteed public bank 0.91 0.90 0.1 7 7
Other loans 1.39 1.28 0.8 5,488 9,712
Other financial 1.07 1.00 0.5 1,282 7,327
Leases 1.25 1.28 0.3 481 1,323
Miscellaneous 1.09 0.99 0.8 47 59
Small personal 1.12 0.99 0.2 5 5
*Restricted to rates with montly values over 0.1.
**All observations, including rates <=0.1, as well as rates reported by banks that were excluded for misreporting figures. Source: Central de Deudores, BCRA.
[image:10.612.82.477.476.701.2]Bank overdrafts are, on average, the most expensive type of loans. We disregard information on inter-financial loans, because these rates are still badly misreported in the transformed sample, since they did not even reach 2% per month in the year 2000. Besides, this assistance does not qualify for our sample that targets non-financial firms. The only other rate that is close to overdrafts is the rate charged on credit cards.
3.4. Marginal cost of credit
Petersen and Rajan (1994) use the cost of the last loan to measure the price of credit. This could be interpreted as an attempt to capture the cost of loans at the margin. We explicitly try to isolate a measure of the cost of bank credit faced by a firm at the margin. To identify the marginal cost, we recur to the most expensive type of loan, overdrafts. We then pick the highest observed interest rate on overdrafts paid by a firm in the financial system. This account should be the last one used by a firm, which would attempt to exhaust cheaper sources of credit first.
Applying this definition, the marginal rate turned out to be slightly above 3% per month (with small fluctuations according to the specific sub-sample of firms used). We could have used instead the highest observed interest rate charged on any type of loan. However, in 85% of the cases of firms that use overdrafts, the highest rate is indeed the rate charged on overdrafts. As to the relevance of the interest rate on overdrafts, Table 5 shows that 65%
of the firms in our dataset used overdrafts in October 2000.
An advantage of only using overdrafts is that we have a homogeneous type of loan that reduces the influence of unobserved loan characteristics on the cost of credit. The rate charged on overdrafts can be reviewed monthly.
Since overdrafts are very short-term liabilities, they are overwhelmingly denominated in pesos. As the maturity lengthens, debt tends to be denominated in dollars. This is most clearly so for the debts with longest maturity, house mortgages.
Credit card lines are similar to overdrafts in several aspects. In particular, credit cards are subject both to pre-established rates and to credit limits characteristic of loan commitment contracts. We could have bunched both types of assistance together. However, we decided against doing that because they are not completely homogeneous lines. According to Table 5, the average size of operations with credit cards is substantially smaller than that of overdrafts, and their use by firms is much less widespread.
3.5. Access to additional credit
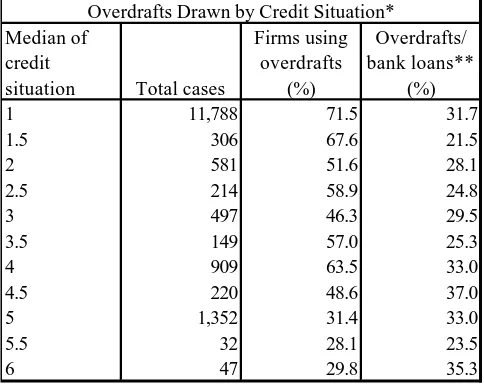
As to the first alternative, our conjecture was that overdrafts would be the last type of loan a firm would resort to in the financial system. Overdrafts are more expensive than other types of loans. Moreover, their cost at the margin resembles the trade credit paid late variable in Petersen and Rajan (1994), that was charged a rate of 3% per month. If trade credit paid late could indicate that the firm faced credit constraints, we thought that a high percentage of overdrafts over total bank loans could indicate that very same thing. However, we ran into a snag, as Table 9 shows. The first column presents the median of a firm’s credit situation in all banks. The credit situation for firms goes from 1 (the best credit standing) to 5 (the worst credit standing), while 6 is a technical category for delinquent loans with failed banks (cf. Appendix C).
Table 9
Median of credit
situation Total cases
Firms using overdrafts
(%)
Overdrafts/ bank loans**
(%)
1 11,788 71.5 31.7
1.5 306 67.6 21.5
2 581 51.6 28.1
2.5 214 58.9 24.8
3 497 46.3 29.5
3.5 149 57.0 25.3
4 909 63.5 33.0
4.5 220 48.6 37.0
5 1,352 31.4 33.0
5.5 32 28.1 23.5
6 47 29.8 35.3
*This refers to complete database of 16,095 firms. **This refers only to firms actually using overdrafts. Source: Central de Deudores, BCRA.
Overdrafts Drawn by Credit Situation*
Though the percentage of credit drawn through overdrafts is roughly constant across categories, the percentage of firms that actually use overdrafts tends to fall as the credit situation deteriorates. This seems to indicate that firms are cut off from overdrafts when they run into financial trouble. Unlike trade credit, whose supply might be thought of as pretty elastic, overdrafts are part of loan commitment contracts that are subject to a prior approval process. This illustrates why the use of overdrafts is an ambiguous indicator of credit rationing. Even if it is the most expensive source of credit in the financial system, the firms in worst shape have less access to it. In this sense, overdrafts have problems similar to leverage indicators discussed in Section 4.
constrained. Firms in good condition would tend to use overdrafts little, while firms in bad shape would tend to exhaust their available credit. Since overdrafts have a limit, and could be expected to be the last source of credit that a firm would resort to, once that limit is hit one would expect the firm to be credit constrained in the financial system.
However, we realized that, at core, Petersen and Rajan (1994) used trade credit discounts taken as a shadow indicator of credit availability in banks in general. From the start, we had such a measure of credit availability in our hands. Though we had initially thought in terms of the unused portion of authorized overdrafts, banks provide detailed information to the central bank on all unused credit lines that are part of loan commitment contracts. This perspective also ties in with the ideas in Melnik and Plaut (1986) on credit constraints having to do with the ex-post usage of credit beyond the amounts agreed on beforehand in loan commitment contracts.
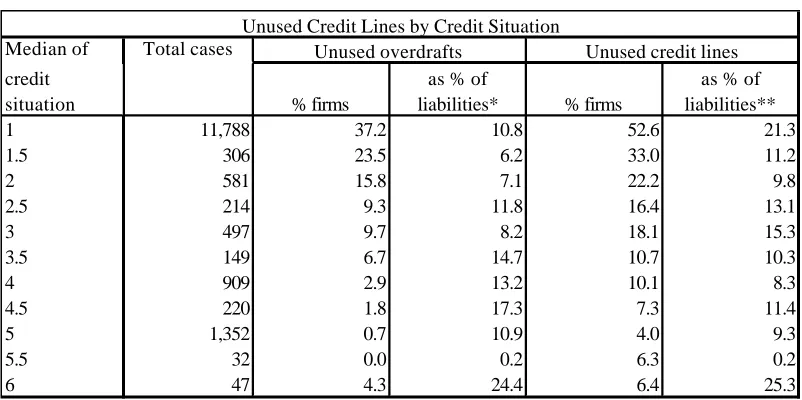
[image:13.612.80.481.427.627.2]As mentioned above, the BCRA requires banks to provision unused credit lines for credit risk unless the credit line is revocable at any time, so the figures of unused credit lines basically reflect loans backed by loan commitment contracts that have been granted but not drawn. The following table shows the behavior of unused overdrafts in columns three and four, while columns five and six refer to total unused credit lines, that includes unused overdrafts.
Table 10
Median of Total cases credit
situation % firms
as % of
liabilities* % firms
as % of liabilities**
1 11,788 37.2 10.8 52.6 21.3
1.5 306 23.5 6.2 33.0 11.2
2 581 15.8 7.1 22.2 9.8
2.5 214 9.3 11.8 16.4 13.1
3 497 9.7 8.2 18.1 15.3
3.5 149 6.7 14.7 10.7 10.3
4 909 2.9 13.2 10.1 8.3
4.5 220 1.8 17.3 7.3 11.4
5 1,352 0.7 10.9 4.0 9.3
5.5 32 0.0 0.2 6.3 0.2
6 47 4.3 24.4 6.4 25.3
*This refers only to firms that actually have unused overdrafts. **This refers only to firms that actually have unused credit lines. Source: Central de Deudores, BCRA.
Unused Credit Lines by Credit Situation
Unused overdrafts Unused credit lines
For example, column five shows that 53% of firms with a median credit standing of 1
at hand, and these represent a larger share of their bank liabilities. Unused overdrafts follow approximately the same pattern, but they are less representative of available sources of funds in banks. For that reason, our final measure of credit availability was unused credit lines as a percentage of liabilities with the financial system.
4. Econometric evidence
Our goal here is to see what can be learned on the high cost and the limited access of firms to credit in Argentina from the cross-sectional variation among firms. We try to measure the cost and the availability of bank credit at the margin. Our methodology is inspired by Petersen and Rajan (1994). Besides some differences in the right-hand variables that in particular extend the study to see the impact of credit history, we use different left-hand variables, which can be related to the ideas of loan commitment contracts in Melnik and Plaut (1986).
The cost of credit is captured by the marginal interest rate that a firm has to pay on overdrafts. As to the access to credit, we start by running some regressions based on leverage similar to those commonly used in the literature. However, high leverage is inherently ambiguous because they may indicate either a firm with high credit availability or a firm in financial distress. We then propose an alternative approach to detect credit constrained firms based on the proportion of outstanding credit lines.
In each case, we first run regressions for different subsets of information, to see if more restrictive validation criteria lead to more precise estimates. Naturally, a more restrictive validation criterion leaves fewer observations, hopefully of better quality for the problem analyzed. So there is an implicit trade-off when restricting the sample where degrees of freedom are sacrificed to obtain more relevant observations.
We are interested in evaluating how information affects credit conditions. If banks can screen between good and bad credits more easily, this should reduce the problem of
lemons, improving the access to credit of good firms. Do close relationships matter? It seems they do, reducing the cost of credit and increasing the access to credit. We interpret that firms with closer ties to financial institutions not only share a lot of information with banks, they also show they are good credits. Otherwise, if the firm were bad, the bank would want to turn away from the relationship once it got to know the firm better.
Does credit history matter? It seems to matter, but whereas the negative effect on the
Public information also seems to matter, since the credit history in other financial institutions impacts the access to credit of a bank’s client. We also control for characteristics of a firm from financial statements, as well as for characteristics of banks and loans, and, when possible, for the industrial sector to which the firm belongs.
4.1 Overdraft rate at marginal bank
In the interest rate regression, our dependent variable is the interest rate paid by firms on their overdraft account. We consider that this account is the informative account. In case a firm uses more than one overdraft account, the paper uses the overdraft account that pays the highest interest rate. Using this definition, the marginal overdraft interest rate is on average slightly above 3% per month.
The fact that a firm can switch overnight from one account to another, or from one bank to another, canceling its outstanding overdrafts, allows to interpret the most expensive overdraft account used as the marginal account. As discussed in Section 3, the interest rate on overdrafts is an interest rate relevant for most of the firms with relationship with the financial sector, and it is used more often than any other single line. In those firms actually using overdrafts, it is almost always the highest recorded rate.
From an econometric perspective, the advantage of concentrating the analysis on the rate of a specific credit line is that we do not have to model the influence of line-specific
factors that affect the underlying rate. Those controls would be necessary if the analysis were to be made on the highest rate charged on any line. In addition, the characteristic that this account is priced monthly facilitates the estimation procedure, because there is no need to introduce extra variables to measure the underlying cost. The constant of the regression should capture it. The paper estimates the following regression function:
Highest overdraft interest rate = ββ0 + ββ1 Firm specific information + ββ2 Industry
dummies + ββ3 Loan and lender characteristics + ββ4 Credit history + ββ5
Measures of Relationships + εε
The columns of Table 12 display four different sets of firms. Regression one corresponds to the complete sample, while regression two applies a filter to eliminate problematic observations (roa=0, and cases where either assets or liabilities or net worth are between 0 and 1 thousand pesos). Regression three corresponds to registers where at least two sources agree on the information (validation criteria 1/2/3/5/7). Regression four also includes firms whose balance sheet information has been regularly updated by a bank (validation criterion 13). This information, though it cannot be crossed with other reports, seems to behave pretty much like the information that can be checked. Given the large heterogeneity of the sample considered, the possible presence of outliers that can seriously affect least squares estimates cannot be discarded in advance. We also estimated all models using robust methods. We used Huber’s biweight function based on Cook’s distance (see Wilcox, 1997, for details). The robust estimates (not shown) are fairly similar to those obtained by OLS, so outliers do not affect the estimation significantly.
Though we are more confident in the samples of regressions three and four, the estimates in Table 12 are not very sensitive to the specific sample used. In the initial estimates, many coefficients in the first two regressions had signs significantly different from the last two regressions. Once more controls were put in place, the most noteworthy difference is that in the first two regressions lndebt/assets is not statistically significant, and
that roa has a negative sign (though it is never statistically significant).2 Please see Appendix D for a full description of the right-hand variables.
Table 12
2
Explanatory variables Complete sample Complete sample+ Reduced
sample+ +
Reduced
sample +++
roa 0.000 0.000 0.076 0.075
(-1.12) (-1.12) (1.06) (1.07)
lnassets -0.100 -0.125 -0.150 -0.129
(-9.18)*** (-8.72)*** (-6.85)*** (-6.98)***
lnsales/assets -0.246 -0.245 -0.189 -0.180
(-6.39)*** (-5.32)*** (-2.36)** (-2.68)***
lndebt/assets 0.011 0.154 0.624 0.452
(0.12) (1.41) (2.83)*** (2.45)**
sector 0 0.215 0.110 -0.160 0.020
(3.25)*** (1.40) (-1.15) (0.19)
sector 1 0.129 0.130 -0.004 0.110
(2.24)** (2.03)** (-0.04) (1.22)
sector 3 -0.033 -0.075 -0.434 -0.237
(-0.16) (-0.35) (-1.31) (-0.87)
sector 5 -0.059 0.010 -0.306 -0.244
(-0.29) (0.05) (-1.12) (-0.96)
sector 6 0.272 0.223 0.163 0.220
(3.78)*** (2.84)*** (1.38) (2.09)**
sector 7 0.110 0.066 -0.086 -0.003
(2.16)** (1.19) (-1.05) (-0.04)
sector 8 0.302 0.266 0.158 0.198
(5.65)*** (4.55)*** (1.76)* (2.54)**
situation 2 0.652 0.539 0.511 0.577
(6.32)*** (4.71)*** (2.98)*** (3.72)***
situation 3 0.252 0.258 0.002 0.084
(2.62)*** (2.44)** (0.01) (0.56)
situation 4 0.422 0.501 0.538 0.475
(5.87)*** (6.23)*** (4.66)*** (4.45)***
situation 5 0.228 0.121 0.170 0.205
(2.22)** (0.97) (0.95) (1.23)
situation 6 0.811 0.994 0.698 0.767
(2.55)** (2.41)** (1.69)* (1.90)*
lnbounced/liabilities 0.048 0.049 0.072 0.066
(5.42)*** (4.88)*** (4.62)*** (4.67)***
unwarranted/overdrafts 0.896 0.903 0.893 0.963
(10.19)*** (9.09)*** (5.49)*** (6.90)***
foreign bank=1 0.198 0.153 0.165 0.146
(5.09)*** (3.54)*** (2.51)** (2.55)**
public bank=1 0.110 0.213 0.295 0.261
(1.27) (1.99)* (1.70)* (1.63)
wholesale bank=1 -1.000 -1.005 -0.989 -1.011
(-11.33)*** (-10.62)*** (-7.99)*** (-8.90)***
bank's market share -8.779 -9.118 -9.484 -8.724
(-15.54)*** (-14.56)*** (-9.84)*** (-10.36)***
liabilities bank/system -0.690 -0.647 -0.653 -0.646
(-11.21)*** (-9.27)*** (-5.39)*** (-6.45)***
no. banks 0.069 0.084 0.092 0.090
(9.06)*** (10.11)*** (8.45)*** (8.89)***
no. credit lines -0.129 -0.136 -0.133 -0.142
(-7.23)*** (-6.84)*** (-4.38)*** (-5.37)***
_cons 3.525 3.646 3.617 3.396
(24.65)*** (20.68)*** (12.73)*** (14.33)***
Number of observations 8548 7010 3112 3963
F 63.44 55.34 25.91 33.52
Prob > F 0 0 0 0
R-squared 0.1569 0.1653 0.1735 0.1755
Adj R-squared 0.1544 0.1623 0.1668 0.1703
Root MSE 1.58 1.5859 1.6279 1.5897
Estimation method OLS OLS OLS OLS
+
Excludes roa=0 and balance sheets with problems. + +
Validation criteria 1/2/3/5/7 in Appendix A. +++
Validation criteria 1/2/3/5/7/13 in Appendix A.
Note: t-statistics in parenthesis. 1, 2 and 3 asterisks indicate significance at 10%, 5% or 1%.
Interest Rate Regressions: Different Sub-samples
significantly associated with the amount of assets (lnassets), and the sales/assets ratio
(lnsales/assets), while it is positively and significantly related with the firm’s debt/assets ratio
(lndebt/assets). As to credit history, the cost of credit is positively related to a worse credit
situation (situation*) and to bounced checks in the marginal bank (lnbounced/liabilities). However, in the case of credit situation the coefficients are not always significant, and they do not increase with the deterioration of the credit situation. Relationship variables show that the cost of credit is negatively and significantly associated with debt concentration in the marginal bank (liabilities bank/system), and to the number of accounts in the marginal bank
(no. credit lines), but it is positively and significantly related to the number of banks (no.
banks). While Table 11 shows that the number of banks increases with the size of liabilities
in the financial system, the regressions control for the size of firms (lnassets), so an effect of size can be ruled out. Other significant controls show that less collateral
(unwarranted/overdrafts) leads to pay higher interest rates. Marginal banks that are
wholesale (wholesale bank) or large (bank’s market share) charge lower interest rates, and marginal banks that are foreign (foreign bank) charge higher interest rates.3
We want to comment in more detail the effects of credit history. The variable on bounced checks is measured as the ratio in the marginal bank between the amount in bounced checks from January to September 2000, and liabilities. There are five dummy
variables on credit situation of each firm. Situation 1 is omitted, so it acts as the benchmark. Although not all parameters are significantly different from zero in the four estimates, all of the coefficients are positive. This indicates that firms with poor credit situation tend to pay higher interest rates. What’s more, if only a dummy for credit situation 1 is included, it is negative and statistically significant (we do not show the regression for space considerations). The interest rates do not increase as the credit situation worsens to situation 4, which corresponds to firms under debt rescheduling proceedings, or situation 5,
which corresponds to firms filing for bankruptcy. Since situation 6 is a technical category that represents arrears with financial institutions that went broke, it cannot be ranked as worse than either situation 4 or 5. These results may be interpreted as an indication of credit rationing. As the risk of default increases, beyond a certain point it makes no sense to increase the interest rate further. Rather, banks will simply cut back the amount of credit, as we discuss below.
As to the relationship variables, the variable liabilities bank/system is an indication of how deep the marginal bank’s involvement in the firm is. An increase in this variable means that the bank has a higher stake in the firm. This higher exposition assumed by a bank also
3
generates the right incentive to monitor the firm carefully. On the other hand, it could possibly indicate that the firm does not have access to other banks. In this case the parameter of this variable should have a positive sign, signaling the firm’s risk. According to the result of Table 12, the effect of debt concentration in the marginal bank is explained by the first hypothesis.
A second variable to control for relationships, no. credit lines, is the number of accounts the firm is using in the marginal bank. Each type of bank account generates different information. Although not all accounts are informative, we consider the total number of accounts as a proxy for informative accounts. The results from the regressions show that firms with more accounts are charged lower interest rates.
A third variable for relationships, no. banks, does not have a straightforward sign. The issues are similar to the variable liabilities bank/system.4 On the one hand, this variable could signal that a firm wants to diversify its financing sources to not be a captive client of a single bank. If this is the case, an increase in the number of banks should reduce the interest rate. On the other hand, this variable could signal that the relationship is weaker, in which case an increase in the number of banks should go hand in hand with an increase in the interest rate paid. The interest rate paid could also rise if more banks signaled that the marginal bank can not monitor as effectively the firm, or also if it signals that the main bank
cut the firm’s access to credit, forcing it to seek other lenders. According to the results in Table 12, firms that operate in more banks are charged higher interest rates, so it signals either weaker relationships, or moral hazard and quality problems. Taking into account the quantity effects to be discussed below, the additional effects of the variable no. banks may indeed be an indication of firms that need to resort to finance at another bank because they are cut off by their main lender.
4.3. Proportion of unused credit lines in main bank
To avoid the problems that leverage presents as a measure of availability of credit, we turn to unused credit lines in the financial system. In principle this indicates not how much credit a firm has used, but rather how much it has available through loan commitment contracts.
We started to work with unused credit lines at the system level. However, we prefer to focus here on an alternative formulation where the dependent variable is the portion of unused credit lines in the main bank, i.e. the bank where the largest share of liabilities are
concentrated. The characteristics of the lender correspond to the main bank, except for the
4 Note that the number of banks (no. banks) is not completely independent from the concentration of business in the marginal
few cases two banks were tied in first place, when we included both. This allows a better estimation of the effect of the relationship variables, since variables taken from the main bank are weaker explaining available credit lines on a system-wide basis, and it makes no sense to define some of our relationship variables in terms of the whole system.
Our hypothesis was that unused credit lines indicated a firm that was not credit constrained, while the opposite meant a firm that was. Therefore, the estimation should consider both zeros and the non-zero unused credit lines, because both are informative. The formulation to capture the access to credit is the amount of unused credit lines granted by financial institutions to firms is thus:
Unused Credit Line in Main Bank = ββ0 + ββ1 Firm specific information + ββ2 Industry
dummies + ββ3 loan and lender characteristics + ββ4 Credit history + ββ5
Measure of relationships + εε0
We used a standard two-part selection model.5 The model was estimated by both full information maximum likelihood and the Heckman two-step procedure. On one hand, the likelihood function for the normal selection model is well known to be numerically difficult to
handle, which calls for two-stage type methods. On the other hand, as in the case of this paper, when the selection equation shares many explanatory variables with the regression equation, the identification of the second stage of Heckman’s method may suffer from a very high multicollinearity between the explanatory variables in the regression equation and the additional regressor included to correct for the selection bias. We used both methods to handle this issue and compare estimation results. We show the results of the Heckman
two-step procedure, but estimates using both methods do not differ substantially (see Nawata and Nagase, 1996, for more details on estimating selection models). Consistent standard errors for the selection model are computed as in Greene (1997, p. 981).
Table 15 presents the results of the regression equation, while the selection equation is relegated to Appendix E1.
Table 15
5
Explanatory variables Complete sample Complete sample+ Reduced sample++ Reduced sample +++
roa 0.003 0.002 0.119 0.140
(0.88) (0.48) (1.14) (1.78)*
lnassets 0.063 0.083 0.096 0.090
(5.16)*** (11.05)*** (7.78)*** (8.81)***
lnsales/assets 0.117 0.147 0.100 0.105
(4.50)*** (5.50)*** (2.10)** (2.73)***
lndebt/assets -0.096 -0.130 -0.279 -0.253
(-1.80)* (-2.32)** (-2.25)** (-2.54)**
sector 0 -0.045 0.000 -0.022 -0.047
(-0.94) (-0.01) (-0.29) (-0.86)
sector 1 -0.269 -0.222 -0.222 -0.219
(-4.25)*** (-6.44)*** (-3.71)*** (-4.47)***
sector 3 0.104 0.145 0.286 0.204
(1.03) (1.37) (1.71)* (1.43)
sector 5 -0.055 -0.085 -0.042 -0.065
(-0.54) (-0.80) (-0.29) (-0.48)
sector 6 -0.026 -0.007 0.002 -0.036
(-0.59) (-0.16) (0.03) (-0.62)
sector 7 -0.083 -0.092 -0.070 -0.092
(-1.67)* (-2.89)*** (-1.42) (-2.20)**
sector 8 -0.068 -0.069 -0.063 -0.081
(-1.42) (-2.14)** (-1.25) (-1.90)*
situation 2 -0.299 -0.259 -0.286 -0.257
(-5.17)*** (-4.58)*** (-2.78)*** (-2.81)***
situation 3 -0.457 -0.461 -0.663 -0.617
(-5.58)*** (-5.61)*** (-4.44)*** (-4.61)***
situation 4 -0.774 -0.790 -0.845 -0.802
(-7.20)*** (-10.20)*** (-6.97)*** (-7.17)***
situation 5 -0.773 -0.730 -0.804 -0.778
(-5.73)*** (-7.05)*** (-5.01)*** (-5.39)***
situation 6 -0.606 -0.720 -0.388 -0.395
(-2.85)*** (-2.89)*** (-1.51) (-1.56)
lnbounced/liabilities -0.040 -0.047 -0.047 -0.038
(-3.61)*** (-4.29)*** (-2.24)** (-2.26)**
guarantees/liabilities 0.427 0.429 0.475 0.475
(8.25)*** (8.27)*** (5.30)*** (6.10)***
foreign bank=1 -0.012 -0.022 0.007 -0.003
(-0.40) (-0.86) (0.16) (-0.08)
public bank=1 0.069 0.061 0.081 0.057
(2.15)** (1.74)* (1.32) (1.11)
wholesale bank=1 0.247 0.259 0.293 0.303
(5.38)*** (5.18)*** (4.24)*** (4.75)***
bank's market share 0.029 0.032 0.032 0.035
(5.84)*** (9.09)*** (5.86)*** (7.31)***
liabilities bank/system 0.214 0.197 0.238 0.187
- (3.20)*** (2.43)** (2.27)**
no. banks -0.027 -0.031 -0.030 -0.033
(-7.28)*** (-5.45)*** (-3.92)*** (-4.70)***
no. credit lines 0.132 0.129 0.124 0.115
(6.90)*** (12.91)*** (8.00)*** (8.73)***
_cons -1.394 -1.582 -1.646 -1.523
- (-16.50)*** (-10.74)*** (-11.82)***
Number of obs 15,822 11,772 4,426 5,860
Censored obs 11,679 8,242 3,078 3,998
Uncensored obs 4,143 3,530 1,348 1,862
Wald chi2 4,186 876 380 481
Prob > chi2 0.00 0.00 0.00 0.00
Log likelihood -8,313 -6,880 -2,629 -3,514
Estimation method Heckman sel. mod. Heckman sel. mod. Heckman sel. mod. Heckman sel. mod.
+
Excludes roa=0 and balance sheets with problems.
++
Validation Criteria 1/2/3/5/7 in Appendix A.
+++
Validation Criteria 1/2/3/5/7/13 in Appendix A.
Note: z-statistics in parenthesis. 1,2 and 3 asterisks indicate significance at 10%, 5% or 1%.
Unused Credit Ratio Regression Equations: Different Sub-samples
(lnsales/assets), and --in the last regression equation-- with the return on assets (roa), and it is negatively and significantly associated with the debt-to-assets ratio (lndebt/assets). At the main bank, a worse credit situation (situation*) is negatively and significantly associated to less credit availability, and the same happens with bounced checks (lnbounced/liabilities). The relationship variables show that credit availability is positively and significantly associated with more debt concentration in the main bank (liabilities bank/system), and with the use of more accounts at the main bank (no. credit lines), and it is negatively and significantly associated with the number of banks (no. banks). Finally, more collateral
(guarantees/liabilities), and having a main bank that is wholesale (wholesale bank) or large
(bank’s market share) is significantly related to more credit availability.
We want to clarify some issues related to the interpretation of these results. Petersen and Rajan divide firm characteristics into investment opportunities, which should reduce credit availability, and measures of cash flow, which should increase it. They admit that the dividing line is not always clear, and the effect may be a priori ambiguous, e.g. return over assets and sales over assets can be considered either as measures of internal cash flow, or as measures of investment opportunities. However, these distinctions may not matter at all: if banks see this characteristic of larger investment opportunities, they may be willing to lend more. Indeed, as Galindo, Schiantarelli, and Weiss (2001) show, an efficient financial system
will try to channel funds to firms with more profitable investment opportunities. The proxies they use for investment opportunities are precisely return over assets and sales over assets, precisely the variables that Petersen and Rajan consider might reduce credit availability. As far as these investment opportunities are common knowledge to both parts, because they can be inferred from the accounting statements of firms, this should increase the supply of funds coming from profit maximizing financial institutions. Hence, these arguments should lead one to expect return over assets and sales over assets to unambiguously increase the
availability of credit, exactly what happens in our estimates.
A possible stumbling block with our conjecture is that good firms with a lot of cash might not have unused credit lines simply because they do not need them, so they do not apply for line of credit contracts in the first place. In this regard, large firms immediately come to mind, since they are identified in the literature with good quality firms. By the way, it is known that larger firms are firms that are less likely to be credit constrained (Schiantarelli,
domestic financial system because of their access to cheaper credit abroad. This seems to support our conjecture that firms that are not credit constrained have unused bank credit available.
It remains to see if this result is robust in other datasets. For instance, if our measure of unused credit lines is introduced into the interest rate regressions, it is significantly and negatively related to marginal interest rates. This is sensible if one thinks that firms that are cut off from credit in their main bank have to go shopping to other banks that are more expensive. However, using data from the Italian Centrale dei Rischi, which distinguishes between banks loans granted and bank loans drawn, D’Auria, Foglia, and Marullo-Reedtz (1999) find the opposite. The share of loans drawn is negatively related to the rate of interest, which means that firms with less unused credit lines pay lower interest rates. A difference between their study and ours is that we look at the interest rate in the marginal bank, whereas they explain the interest rate at each bank, and see the effect of unused credit lines available in that same bank. However, a priori we would also have expected a firm to exhaust its cheaper sources of funds in a bank first, so it is hard to make sense of their results on the cost of credit. In summary, though the proportion of unused credit lines in total bank liabilities might be easier to replicate for a wider number of countries than the indirect measures drawn from trade credit by Petersen and Rajan (1994), it remains to be
seen if unused bank credit turns out to be a sensible indicator of credit availability, as seems to be the case for the firms in our sample from Argentina.
5. Implications of this study
We built a cross-section of data for October 2000 to study the variation of both the cost of credit and the access of firms to credit. We study in particular how banks use different pieces of private and public information to screen firms and overcome informational asymmetries in the credit market. Some private information is transferable, like balance sheet data. Private
information generated in relationships is not. We also consider public information available in
the Central de Deudores.
We use something very specific to measure the marginal cost of credit, the interest rate charged on marginal (most expensive) bank overdrafts. To measure access of firms to credit, our first intention was to use percentage of authorized overdrafts effectively drawn. The overdraft authorizations are a loan commitment contract or credit line. However, we then
the sense that firms that have exhausted their bank commitments have to look for more expensive credit elsewhere.
We find that the cost of credit is smaller for a firm with a close relationship to the marginal bank, where a close relationship is linked to a large share of credit and a large number of accounts in the marginal bank, and to a small number of total banks. Firms with large assets, a high sales/assets ratio, and a low debt/assets ratio pay a lower interest rate at the margin. A good credit history (no debt arrears and no bounced checks) and collateral also reduce the marginal interest rate. Though credit history matters, as Greene (1992) emphasizes, it is not the only thing that matters. It does not wipe out the significance of the relationship variables, which are extremely important.
Using the proportion of unused credit lines at the main bank as a measure of firms that are not credit constrained, we find that a good credit situation increases the availability of credit, and that relationships are also very important to increase the access to credit. Our proxies for relationships might signal that banks have private information that reveals the firm is not a lemon, but rather a good credit (otherwise, why extend the firm more credit?). Our measure of unused credit lines is less ambiguous than traditional measures like leverage, which may indicate financial distress rather than availability of credit. Large assets, a high return over assets, a high sales/assets ratio, a low debt/assets ratio, a good credit
history, and collateral lead to higher credit availability.
The paper does not look at the macroeconomic determinants of credit constraints. Economy-wide credit constraints that reflect the doubts about the government's prospects are reflected in the baseline interest rate charged to firms. The baseline interest rate has a premium related to the interest rate spread between Argentine government bonds and U.S. government bonds. This spread, or country risk, was on average above 750 annual basis points in October 2000. A result from credit constraint theory is that a high probability of
default gives financial institutions an incentive to eliminate credit lines to the borrower. Since November 2000, the international capital market for Argentina is closed due the belief of international investors that Argentina will default on its debt. After that, the spread has fluctuated widely, reaching 3500 basis points in November 2001. This of course impacts on firms, which are mostly cut off from new credit. Hence, it is convenient to explore economy-wide determinants of credit constraints faced by firms, besides the individual determinants
stressed in this study. Our regressions do not capture this result because the estimation process is a cross-section for October 2000, but this might be possible looking also at data for January 2001, after international markets were closed.
information by lenders, limiting credit history to 5 years and limiting the access to the database. Our study shows in particular that a good median credit situation in the Central de
Deudores eases credit restrictions. A policy that restricts disclosure may end up hurting good
firms. References
Akerlof, G. 1970. “The market for lemons: quality uncertainty and the market mechanism.”
Quarterly Journal of Economics. 113: 79-119.
Allen, F. 2001. “Do financial institutions matter?” Journal of Finance. 56: 1165-1175.
Berger, A., Klapper, L., and Udell, G. 2000. “The ability of banks to lend to informationally opaque small businesses.” Mimeo, Federal Reserve Board.
Banco Central de la República Argentina, September 2000, Información de Entidades
Financieras.
Burdisso, T., D’Amato, L., Escudé, G., and McCandless, G. 2001. “How much do SMEs borrow from the banking system in Argentina?” Mimeo, Banco Central de la República Argentina.
Caballero, R. 2000. “Macroeconomic volatility in Latin America: A conceptual framework and three case studies.” Economía. 1:31-107.
Caballero, R., and Krishnamurthy, A. 1999. “Emerging markets crises: An asset market
perspective”. Mimeo, MIT.
Claessens, S., Demirgüç-Kunt, A., and Huizinga, H. 2001. “How does foreign entry affect domestic banking markets?”. Journal of Banking and Finance. 25: 891-911.
Cole, R. A. 1998. “The importance of relationships to the availability of credit”. Journal of
Banking and Finance. 22: 959-977.
D’Auria, C., Foglia, A., and Marullo-Reedtz, P. 1999. “Bank interest rates and credit relationships in Italy.” Journal of Banking and Finance. 23: 1067-1093.
Diamond, D. 1984. “Financial intermediation and delegated monitoring.” Review of Economic
Studies. 51: 393-414.
Diamond, D. 1991. “Monitoring and reputation: the choice between bank loans and directly placed debt.” Journal of Political Economy. 99: 688-721.
Freixas, X. and Rochet, J-C. 1998. Microeconomics of Banking. Cambridge, MA, United States: MIT Press.
Galindo, A., Schiantarelli, F., and Weiss, A. 2001. “Does financial liberalization improve the allocation of investment? Micro evidence form developing countries”. Mimeo.
Greene, W. 1992. “A statistical model for credit scoring.” Mimeo, New York University. Greene, W. 1997. Econometric Analysis, 3rd edition. Prentice Hall.
Hoshi, T., Kashyap, A., and Scharfstein, D. 1990. “The role of banks in reducing the costs of financial distress in Japan.” Journal of Financial Economics. 27:67-88.
Mayer, C. 1994. “The assessment: Money and banking: theory and evidence.” Oxford
Review of Economic Policy. 10: 1-13 .
Machauer, A., and Weber, M. 2000. “Number of bank relationships: An indicator of competition, borrower quality, or just size?” Mimeo, Johann Wolfgang Goethe-Universität.
Melnik, A. and Plaut, S. 1986. “Loan Commitment Contracts, Terms of Lending, and Credit Allocation.” Journal of Finance. 41: 425-435.
Nawata, K. and Nagase, N. (1996), “Estimation of sample selection bias models”,
Econometric Reviews, 15: 387-400.
Petersen, M. and Rajan, R. 1994. “The benefits of lender relationships: Evidence from small business data.” Journal of Finance. 49: 3-37.
Schiantarelli, F. 1996. “Financial constraints and investment: Methodological issues and international evidence.” Oxford Review of Economic Policy. 12: 70-89.
Sharpe, S. 1990. “Asymmetric information, bank lending and implicit contracts: A stylized
model of customer relationships.” Journal of Finance. 45: 1069-1087.
Stiglitz, J. and Weiss, A. 1981. “Credit Rationing in Markets with Imperfect Information.”
American Economic Review. 71: 393-410.
Wilcox, R. 1997. Introduction to Robust Estimation and Hypothesis Testing. New York: Academic Press.
Williamson, S. 1987. “Costly monitoring, loan contracts, and equilibrium credit rationing.”