CONTRIBUTIONS TO SOCIAL SECURITY IN ARGENTINA, CHILE AND URUGUAY: DENSITIES, TRANSITIONS AND DURATION
ALVARO FORTEZA, IGNACIO APELLA,
EDUARDO FAJNZYLBER, CARLOS GRUSHKA, IANINA ROSSI AND GRACIELA SANROMÁN
RESUMEN
Los programas de pensiones latinoamericanos tienen baja cobertura. Utilizando paneles de registros administrativos de Argentina, Chile y Uruguay, caracterizamos las historias de contribución de la población. Construimos tres indicadores: densidad de cotización, tasas de transición y duración de los períodos de contribución y no contribución. Los datos obtenidos son preocupantes. La densidad de cotización promedio es baja y bastante heterogénea a través de la población. Los períodos de contribución son cortos y las interrupciones frecuentes. Las tasas de transición son altas a edades tempranas y tienden a caer a lo largo de la vida, indicando gran rotación entre los jóvenes.
Clasificación JEL: H55, J14, J26
Palabras Clave: Densidad de cotización, historia laboral, pensiones. ABSTRACT
Pension programs in Latin America have low coverage. We use large panel databases coming from administrative records of Argentina, Chile and Uruguay to characterize the histories of contribution of the population. We compute three indicators: density of contribution, transition rates and duration of the spells of contribution and no contribution. The picture that emerges is worrisome. The density of contributions is low on average and pretty heterogeneous across the population. The spells of contribution are short and interruptions are frequent. Transition rates are higher at early ages and tend to decline later in life, indicating high turnover among young individuals.
JEL Classification: H55, J14, J26
CONTRIBUTIONS TO SOCIAL SECURITY IN ARGENTINA, CHILE AND URUGUAY: DENSITIES, TRANSITIONS AND DURATION
ALVARO FORTEZA, IGNACIO APELLA,
EDUARDO FAJNZYLBER, CARLOS GRUSHKA, IANINA ROSSI AND GRACIELA SANROMÁN1
I. Introduction
One of the main flaws of pension systems in most developing countries is their inability to cover all the population (Gill, et al 2003; Holzmann and Hinz, 2005; Forteza et al. 2009a). In Latin America, social security coverage is not only low but it also does not show clear signs of improvement (Rofman et al. 2008b). Furthermore, in recent years, several scholars have shown that most participants in contributory pension programs in Latin America are only partially covered, in the sense that they actively contribute only a small part of the time they are supposed to contribute, so they are not fully eligible to receive social security benefits (see, among others, Bertranou and Sánchez, 2003; De Biase and Grushka, 2003; Lagomarsino and Lanzilotta, 2004; Berstein et al 2006; Bucheli et al. 2008). In the present paper, we use individual records of social security programs in Argentina, Chile and Uruguay to provide a comparative analysis of contribution histories in these three countries.
The individual records of contribution are a key component of the reforms that introduced individual savings accounts to the pension schemes in Latin America. Yet, their ability to make the system more transparent and in so doing, to better-protect the working poor in old age is neither widely known nor fully understood.
1 Alvaro Forteza ([email protected], corresponding author: Departamento de Economía,
Facultad de Ciencias Sociales, Constituyente 1502 piso 6 cp 11200, Montevideo, Uruguay), Ianina Rossi ([email protected]) and Graciela Sanromán ([email protected]) are researchers at the Departamento de Economía, Facultad de Ciencias Sociales, Universidad de la
República, Uruguay. Eduardo Fajnzylber is assistant professor at the School of Government of
the Universidad Adolfo Ibáñez, Chile. The article was prepared while Mr. Fajnzylber was Head of the Research Department of the Studies Division at the Chilean Pension Supervising Authority
(Superintendencia de Pensiones). Ignacio Apella ([email protected]) is researcher at the
In Argentina and Uruguay before the reforms, the main social security program administrations had almost no record of individual contributions and could not check whether workers had accumulated the years of contribution legally required to access a pension. Benefits were hence granted on a very informal basis, often appealing to the testimony of witnesses. Not surprisingly, many people managed to receive a contributory pension even when they had not contributed the required number of years. In the Chilean case, even if individual records were available before the 1980 reform, they were distributed among a number of different institutions with heterogeneous contents, formats and integrity.
Systems are gradually being built to populate work history records and administrators are increasingly gaining the capacity to authenticate individual records of contribution. Nevertheless, as the region advances fiscally, a large portion of workers risk not adapting to the new conditions and ending up with a very low pension or no pension at all.
In this paper, we characterize the empirical distributions of the densities of contribution, the duration of the spells of contribution and no contribution and the transitions into and out of contributing in the main social security programs in Argentina, Chile and Uruguay. We compute not only average densities but also how densities vary with several characteristics of the individuals. This is important because of the significant heterogeneity that can be identified across the population. Densities of contribution do not provide information about the dynamics of social security coverage though. We shed some light on the dynamics of the process computing the duration of the spells of contribution and no contribution and the rates of transition between these two states. As in the case of densities, we characterize the empirical distribution of the spells. So we provide a picture of the average densities of contributions and the frequency of interruptions. By applying the same methodology and using the same type of data in the three countries we are in a position to compare these countries. To the best of our knowledge, this is the first comparative study of this topic.
II. Institutional Organization of Social Security and Aggregate Statistics
A. Design of social security
Pension programs in the region have undergone profound reforms in recent decades. Chile led the introduction of mandatory individual savings account in 1981. The traditional defined-benefit pay-as-you-go program (DB-PAYG) was phased out. Argentina and Uruguay followed in the nineties introducing mixed programs that combined traditional DB-PAYG and savings accounts. The three countries introduced new changes in recent years. Chile and Uruguay maintained the basic architecture, but introduced a series of adjustments –wider and more ambitious in the Chilean than in the Uruguayan case- mostly geared to strengthening social protection. Argentina was more radical, and in 2008 eliminated the individual savings accounts.
1. Argentinean system
The enactment of Law No. 24241 in 1994 created the Sistema Integrado de Jubilaciones y Pensiones (SIJP) (Integrated Pension System). The SIJP included two regimes: one public, financed on a pay-as-you-go (PAYG) basis and managed by the Administración Nacional de la Seguridad Social (ANSES) (National Administration of Social Security), and the other based on individual capitalization managed by private companies (AFJP).2
In exchange for managing the workers’ mandatory savings, the AFJPs received a fee proportional to the workers’ wage. All workers older than 18 years had to contribute to the SIJP, but they had the option of choosing between the traditional PAYG and the individual capitalization regime. In addition, the parameters were gradually adjusted. The minimum retirement age was increased from 55 to 60 years for women and from 60 to 65 years for men. The minimum number of years required to access a pension was increased from 20 to 30 years.
The newly designed scheme was (partially) financed by an individual contribution equivalent to 11 percent of employee income (or presumed income for the self-employed) and an employer contribution of 16 percent. The public segment was financed by a series of specific resources drawn from general tax revenues.
2 Except for one firm,
The Argentinean pension system has two tiers. The first tier consists of a flat benefit granted to all who are insured and meet the required age and years of contribution. This benefit, called the Prestación Básica Universal (PBU), is administered by ANSES. The second pillar depends on the exercised option (i.e., the regime chosen). The PAYG regime grants an additional benefit, called the Prestación Adicional por Permanencia (PAP), equivalent to 0.015 times the average wage of the last 10 years per every year contributed to the public regime after 1994. The capitalization regime grants an annuity, called the Jubilación Ordinaria (JO), based on the accumulated balance. Workers who made contributions before 1994 are entitled to the Prestación Compensatoria (PC), which is a compensatory benefit computed like the PAP. The PC, like the PBU, is independent of the regime chosen by the affiliate.
Without yet changing the basic architectural design, the system was amended several times between 2003 and 2007. Affiliates to private pension funds were allowed to switch back to the PAYG pillar; the DB substituted the DC pillar as the default option for new affiliates; individuals with the minimum retirement age but insufficient contributions were allowed to credit unpaid past periods of contributions as self-employed with generous facilities to pay the emerging debt3; benefits paid by the PAYG pillar were increased; and the fees of the AFJP were tapped. In 2008, a more radical reform began, when the Argentinean government passed a law that eliminated the individual accounts pillar. Affiliates to the APFJP were transferred with their funds to the public pillar, so that ANSES administers now the whole system.
2. Chilean System
The current Chilean pension system can be deconstructed into three main pillars: a poverty prevention pillar, a contributory pillar and a voluntary pillar.
The poverty prevention pillar, before the 2008 reform, was based on two components: an assistance pension (the Pensión Asistencial or PASIS) and the minimum pension guarantee (MPG). PASIS is a non-contributory means-tested
3 This procedure, baptized as moratoria, was probably the most important of these reforms in
benefit. The MPG is a minimum contributory pension for individuals who contributed for at least 20 years to the individual capitalization scheme but were not able to finance a minimum amount for retirement. Together, these two programs corresponded to the main government policies aimed at avoiding old-age poverty, and were financed by general revenue. The reform of 2008 replaced these two programs with the New Solidarity Pillar (NSP), providing (i) a basic pension to the 60 percent poorest with no contribution and (ii) a supplement to the 60 percent poorest that self-finance a small pension. For individuals over a certain age, a provision of the reform ensured the option to choose between the MPG and the NSP.4
The contributory pillar, previously based on a dispersed number of PAYG schemes, was drastically reformed in 1980 to create a unique national scheme that is based on individual accounts managed by professional firms, the Administradoras de Fondos de Pensiones (AFPs).5 Funds cannot be withdrawn until retirement, meaning any point after the legal retirement age (65 years for men and 60 for women) or in early retirement if they have accumulated sufficient funds in their account and they receive a minimum replacement rate. Upon retirement, the individual can choose between buying an annuity from an insurance company and receiving a programmed withdrawal stream from the AFP (or different combinations of these two options). In both cases, benefits are actuarially calculated as a function of the individual’s lifetime accumulated savings, the potential beneficiaries and (age- and gender-specific) life expectancy.6
4 See Rofman et al. (2008a) for a detailed description of the 2008 Chilean reform. 5 Only the armed forces, military and police remained in their previous PAYG schemes.
6 To be more precise, pension under the Chilean scheme are calculated by dividing the current
To complement the compulsory savings made in the contributory scheme, tax incentives are provided for individuals to make additional voluntary contributions in a wide set of financial products.
3. Uruguayan System
The first old-age, survival and disability (OASDI) insurance programs were set up in the 19th century in Uruguay. These programs expanded their coverage and scope in the following decades, becoming almost universal in the 1950s. In 1967, a public institution called Banco de Previsión Social (BPS) was created to administer the social security system. Since then, BPS has administered the largest retirement programs in the country, covering public servants, private workers (with some exceptions), rural workers and domestic workers. Some categories of workers have their own special pension schemes: bank employees, notaries, self-employed university graduates, armed forces personnel and police force personnel. Contributors to the BPS represented 89 percent of the total number of contributors to all social security institutions in the country in 2001 (Ferreira-Coimbra and Forteza 2004).
Before the social security reform initiated in 1996, the BPS retirement programs were financed on a PAYG basis through payroll contributions paid by employers and employees and transfers from the central government. Contribution was also mandatory for self-employed workers, who were subject to minimum declared earnings. The 1996 reform modified the main parameters of the BPS programs and introduced an individual savings accounts pillar administered by private firms.
As a general rule, workers whose earnings are below a threshold are exclusively affiliated to the PAYG pillar. However, they can opt to deposit half of their personal contributions into individual savings accounts. Workers whose earnings are over this threshold must contribute to both pillars. For the amount below the threshold, they contribute to the PAYG public system and from there up to a certain ceiling, also established by law, they must contribute to individual accounts. There is no mandatory contribution for earnings over the established maximum. Employer contributions go exclusively to the PAYG pillar.
The minimum retirement age was fixed at 60 for men and women, which meant an increase of five years for the latter. Also, the minimum number of years of contribution required to access an ordinary pension was raised from 30 to 35. These two requirements were initially the same for the two pillars, but in 2001 a partial reform allowed workers aged 65 years or more to stop contributing to the savings accounts pillar and receive an annuity, regardless of their count of years of contribution. Workers can receive a special “advanced-age” pension served by the solidarity pillar (jubilación por edad avanzada). Eligibility for this program was restricted to individuals who are 70 years old or above and have contributed no less than 15 years. Workers with hazardous occupations and other special categories have a special bonus added to the count of years of contribution.
The replacement rate was also modified in the 1996 reform, making it more sensitive to both the retirement age and years of contribution, in order to induce longer working-lives. The replacement rate was set equal for both genders, ranging from 50 to 82.5 percent, depending on the years of contribution and the retirement age. The average wage used in the benefit formula was modified to include a longer period of contribution. In addition, there is an extra bonus for low-income workers who choose to contribute to individual savings accounts.
It is worth noting that contributors are also entitled to unemployment insurance, a disability pension, sickness and maternity subsidies, family allowances and health care. In all these programs, benefits are conditioned on compliance with eligibility requirements and as a general rule, the self-employed receive fewer benefits.
This system is financed by employer—employee payroll contributions and general taxes. In the 1996 reform, employee contributions were set at 18 percent of monthly earnings, while employer contributions were set at 17.5 percent of total payroll. Over the years, the government introduced exemptions to employer contributions and in 2007, in the context of a tax reform, some of the exemptions were lifted and the general employer contribution rate for social security was reduced to 12.5 percent. Self-employed contributions are based on a minimum declared monthly income.
In 2008 a law was passed that loosened the eligibility conditions for contributory pensions. In the ordinary pension program, the number of years of contribution required to access a pension was reduced to 30, i.e. to the pre-1996 reform figure. Lower replacement rates were settled for workers with shorter histories of contributions, with a minimum at 45 percent. In the “advanced-age” old-age program, the minimum eligibility age was reduced from 70 to 65. Workers claiming this benefit at 65 must have contributed at least 25 years. This figure is reduced in 2 years per year of postponement of retirement up to 70, when workers may receive the benefit with 15 years of contribution.
B. Aggregate statistics
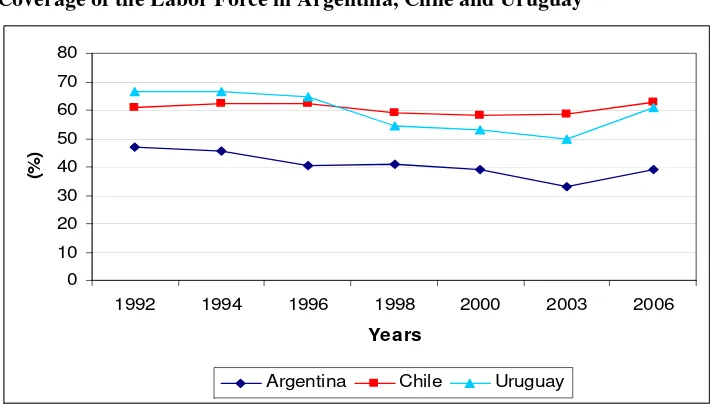
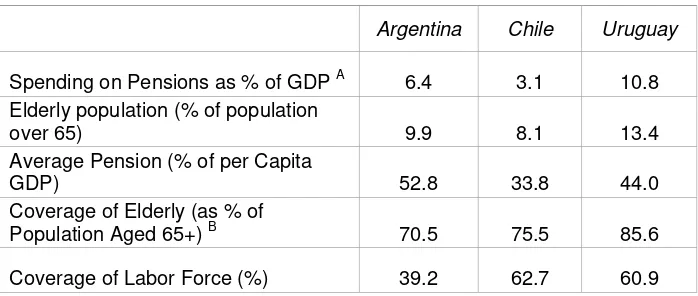
The size of the pension system measured by the expenditure in pensions as a percentage of GDP varies widely in these three countries. In 2006, it ranged from 3 percent in Chile to almost 11 percent in Uruguay (Table 1). By Latin American standards, coverage of the elderly is comparatively large in the three countries, particularly so in the case of Uruguay. Coverage of the labor force was in 2006 in the order of 60 percent in Chile and Uruguay, and 40 percent in Argentina. In the same year, the average pension represented roughly half of per capita GDP in Argentina, 44 percent in Uruguay and about one third of per capita GDP in Chile.
Since the early nineties, no noticeable improvement in the coverage of the labor force has occurred in any of the three countries (Figure 1). Furthermore, coverage experienced a decline in Argentina and Uruguay between 1992 and 2002-3 and only in recent years has there been some recovery, partially explained by the business cycle. In Chile, coverage of the labor force has remained virtually stagnant.
III. Work History Records
A. Argentinean data
The SIJP information is based on (i) the sworn statements (Declaración Jurada) of employers that are required before depositing the social security contributions of employees and (ii) payments made by the self-employed (independent and monotributistas workers).7
As in other countries, the work history records in Argentina were designed taking into account only the immediate operational needs of the social security administration. Because of this, the records are relatively poor in terms of socio-demographic information (DNPSS 2003). Nevertheless, the database provides some basic information about all those who contributed to the SIJP. The original database includes sworn statements covering a 90-month period between July 1994 and December 2001, following more than 8 million workers (or affiliates) who made at least one contribution to the SIJP since 1994. Of this population, the Social Security Secretariat randomly selected a sample of 10,000 registered workers who were still alive and active in December 2001.8 Pension rights are based on employer statements, not actual contributions. To organize the data, the following matrix was established: a Unique Code of Tax or Labor Identification (CUIT/L) associated the record to a worker; one row was introduced for each worker, equaling 10,000 rows; and, a column represented one month, thus 90 columns. To designate a contribution made within a given month, a “1” populated the respective cell; if no contribution was made, a “0” was entered. Hence, the sum across a row determines the worker’s accumulated contributions in the window of observation. The database also contains some information regarding characteristics of the individuals: age, type of worker (classified into three categories: employee, self-employed and mixed), taxable income, pensions regime (PAYG or capitalization) and jurisdiction of residence. This data is available only in December 2001, so the database is cross-section regarding these variables.
B. Chilean data
We had access to the Base de Historias Previsionales de Afiliados Activos, Pensionados y Fallecidos (Affiliates Pension Histories database, HPA),
7 The
monotributo is a simplified regime. The contributions in this regime go entirely to the
public program.
8 Unfortunately, this sampling procedure may introduce some biases linked to attrition: workers
populated with individual contribution records, for a representative sample of participants (representative of all participants in 2001) in the pension system from 1981 to 2006.9 The HPA includes the complete contribution history (in
the AFP system) for a sample of approximately 24,000 individuals, representative of the stock of active affiliates, retirees and deceased affiliates of the system in July 2001.10 In addition, the dataset also includes information on
the recognition bonds held by the sampled individuals.11
C. Uruguayan data
We used a random sample of the work history records collected in December 2004 by the Unidad de Historia Laboral (Labor History Unit) of the Banco de Previsión Social (ATYR-BPS). Workers in the sample contributed at least one month between April 1996 and December 2004. The sample has almost 70,000 individuals.
The records are organized in five databases. The first database provides personal information: date of birth, sex and country of birth. Job profiles comprise the second, particularly the date of initiation of activity and the explicit end of the link between the worker and the firm. A third reports monthly information about the contributions, wages and some characteristics of the job. A separate database contains information about benefits, including the date of retirement. Finally, the fifth database contains information about contributions sent to administrators of pension funds (AFAP).
Like the Chilean records of work histories, these databases provide detailed information about monthly contributions to social security, gender, age, and sector of activity. Unfortunately, we do not yet have a survey of socio-economic characteristics of contributors to social security for Uruguay. Hence,
9 The sample was originally drawn as the basis for the Social Protection Survey, a panel
instrument that was taken in 2002, 2004, 2006 and 2008 for a large fraction of the individuals in the sample. The Social Protection Survey was inspired by the American Health and Retirement Survey. For more information on the Chilean version, see www.proteccionsocial.cl.
10 Upon initial contribution, the individual is considered an “affiliate”.
11 The recognition bonds are obligations assumed by the State to those individuals who
we lack some important socio-economic characteristics like education and characteristics of the families. However, it is worth noticing that the availability of a longitudinal sample with many time periods allows us to estimate the effect of time invariant characteristics in a parsimonious way.
IV. Densities of contribution, durations and transitions
A. Densities
The density of contribution is the ratio of the count of effective to potential months of contribution. The individual must be alive, not retired (though not necessarily active) and no younger than 18 years old for a month to be considered as a potential month of contribution.
The average densities of contribution in the windows of observation are 56, 51 and 60 percent in Argentina, Chile and Uruguay respectively (Table 2). The median contribution densities are a bit higher. So a typical affiliate to these social security programs contributes no much more than half of the time. When he turned 60, he would have contributed on average 23, 22 and 25 years, in Argentina, Chile and Uruguay respectively.
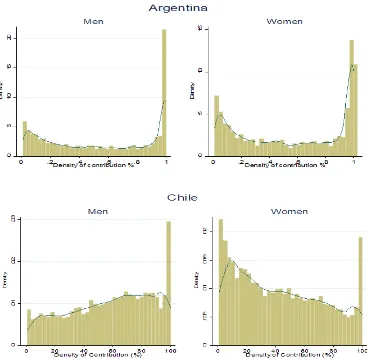
Individuals in the three databases show considerable diversity regarding densities of contribution (Figure 2). The Argentinean and to a lesser extent the Uruguayan sample present strongly asymmetric and bimodal distributions for both men and women, with the two modes close to zero and one. A similar pattern emerges among Chilean women, but men show a monotonically increasing distribution with a large mode at 100 percent. Similar patterns have been reported in previous studies (see among others, De Biase and Grushka 2003; Farall et al. 2003; Bertranou and Sánchez 2003; Bucheli et al. 2008; Lagomarsino and Lanzilotta, 2004; Bravo et al. 2006; Berstein et al. 200612).
In Argentina and Uruguay, men and women present similar contribution densities (Table 2). In Chile, men have considerably higher contribution densities than women. This is consistent with the level of labor force participation among Chilean women, considered relatively low for the region, given the economic development level of the country.
12 Arenas et al. (2006) find a bimodal distribution for Chilean men as well, but they work with
Densities are particularly low at early ages (Table 3). Average densities at 20 range between 30 in Chile and 39 percent in Uruguay. As expected, densities increase as workers mature and, in the three countries, mature workers contribute in the order of twice as much as they contribute when they are in their early twenties.
Densities of contribution negatively correlate with income levels (Table 4). In order to avoid the circular reasoning of finding low densities for workers whose low average income is due to a few periods of contribution, we calculated the average earnings over periods in which individuals reported strictly positive earnings.13 We found consistently higher densities of
contribution in higher income quintiles. In Argentina and Uruguay, workers in the poorest quintile contribute about two thirds of the time workers in the richest quintile do. This gap is even bigger in Chile.
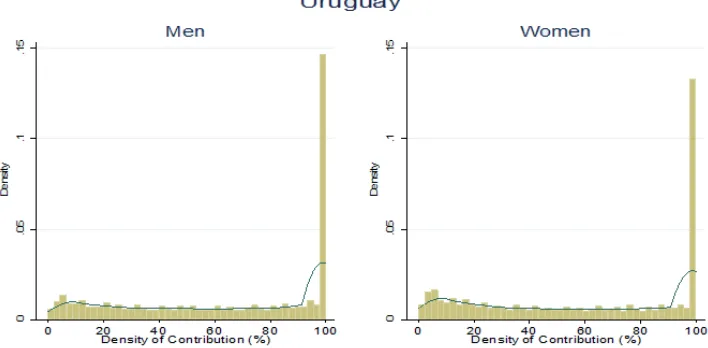
Densities have evolved differently in Argentina, Chile and Uruguay and among sexes in the periods we could observe. The comparison should be made with some caution, for the periods covered by our databases differ and the macroeconomic conditions in the three countries were not the same in these periods. As expected, the business cycle seems to have impacted on contribution densities in the three countries (Figure 3). Years in which the unemployment rate was high exhibit comparatively low densities. But in the case of Chile there is a positive trend in contribution densities, particularly among women, that seems to go beyond the short run fluctuations. In turn, the fall in contribution densities of Argentinean men might also respond to other factors apart from the cycle. More data will be needed to formally separate trends from short run fluctuations, though.
There are small differences between the two pillars of the Argentinean mixed system, as the affiliated to the individual accounts pillar contributed 55 percent on average and the affiliated to the PAYG pillar contributed 57 percent.
13 In the cases of Chile and Uruguay, we used the estimated individual effects of labor income
Only in the case of Argentina could we distinguish between dependent and self-employed workers. Average densities were 68 and 62 percent among dependent and self-employed workers, respectively.
In the case of Uruguay, we could distinguish between public and private sector workers. As expected, public sector workers have significantly higher densities of contribution than private sector workers.14 While public workers
contributed about 86 percent of the time, private sector workers contributed about 58 percent of the time. Contributions spanning the entire period ranged from 67 percent for public employees to 22 percent for private employees. A considerable number of individuals classified as public employees, nevertheless, present low densities of contribution. This is partly because workers classified as public employees may actually spend as much as half of their working life as private employees. Also several groups of public workers have special regimes by which they compute more than one year of contribution per year of effective contribution (teachers, workers handling radioactive products, etc.), so they need less periods of contribution to access a pension.
B. Duration
Durations should be analyzed with caution, for there is significant censoring of the spells in the social security databases. Many spells have already begun when we first observe them and many others have not finished yet when we cease to observe them, either because the window of observation is closed or because the individual is no longer observed. In this paper, we characterize the spells in the databases just as they are, without any statistical treatment to account for censoring. While this is obviously a limitation of the analysis, we think it is convenient to look first at the raw data as it comes.15
Due to the different lengths of the windows of observation, the maximum duration that can be observed in our databases are 90, 288 and 105 months in Argentina, Chile and Uruguay, respectively. Because of this, we will not push
14 We consider a public worker to be anyone who worked in the public sector at least half of the
total time during which contributions were made. According to this criterion, we identify 58,617 (85 percent) as private and 10,380 (15 percent) as public sector workers in the database.
15 Provided with this characterization, in a companion paper we estimate duration models that
the comparative perspective so much in our characterization of spell durations as we did regarding densities.
Table 5 and Table 6 summarize statistics on the duration of the spells of contributing and not contributing to the Argentinean SIJP. The spells last on average only 12 months. There are no large differences between sexes, regime (PAYG/capitalization), or type of worker (employed, self-employed). In turn, the duration of the spells of contribution (lack of contribution) consistently increase (decrease) with income level. The distribution of the spells duration is strongly skewed to the right: the median is much smaller than the mean duration. While the average duration was 12 both for the spells of contribution and no contribution, the median duration of the spells of contribution in the whole population was only six months, and the median duration of the spells of no contribution was only seven months. About 40 percent of the spells of both contributing and not contributing lasted less than six months. In summary, most contributors to the Argentinean SIJP show frequent interruptions in their contribution status.
In the Chilean sample, the spells of contribution last on average 28.3 months while the spells of no contribution last on average 22.7 months (Table 7 and Table 8).16
Spell durations show much diversity across individuals in Chile. Spells of contribution among men and women are very similar in duration, yet women show longer spells of no contribution. This is, once again, probably associated with Chilean women withdrawing from the formal labor force to care for children. Like in Argentina, the distribution of contribution spells is highly skewed to the right, with the median being only seven months. This large difference can only be explained by a small number of long spells (21 percent exceed 36 months). The average duration consistently increases with income level (ranging from 16.7 months in the first quintile to 54.1 months in the upper quintile). Unlike in Argentina, and rather surprisingly, the average and median spells of no contribution remain relatively constant between the second and the richest quintile. About 43 percent of the spells of contribution and 37 percent of the spells of no contribution lasted less than six months.
16 To construct these measures, care was given to avoid false interruptions in contribution spells,
Table 9 and Table 10 summarize the information about the duration of the spells of contribution and no contribution in the Uruguayan sample. On average, the spells of contribution last 33 months and the spells of no contribution last 20 months. Women have longer spells of contribution on average than men, but they also have longer spells of no contribution. Therefore, men seem to have higher turnover than women in Uruguay. Public sector workers have much longer spells of contribution and shorter spells of no contribution than private sector workers.
Like in Argentina and Chile, the distribution of duration is skewed to the right in the Uruguayan social security system. For contribution, the median duration is only 13 months (while the mean is 33) and for no contribution, it is 10 (while the mean is 20). About one third of all spells of contribution and no contribution lasted less than six months.
C. Transitions
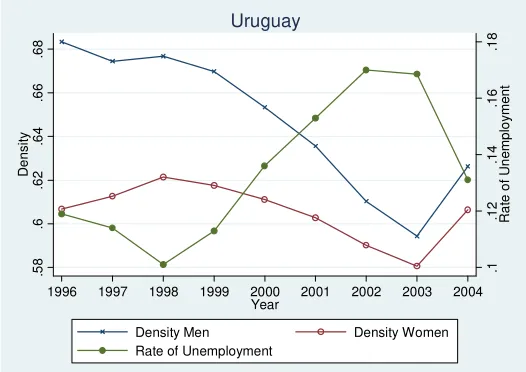
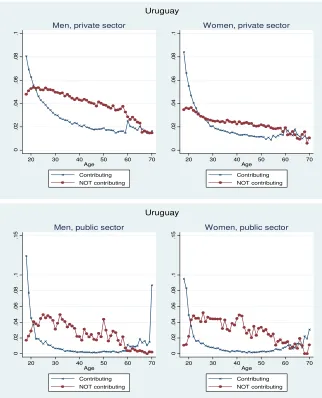
We present in Figure 4 the average transition rates by age in the three countries. The transition rates out of contributing peak at early ages. Workers below 20 have monthly probabilities of leaving the state contributing as high as 15 percent in Argentina and about 10 percent in Chile and Uruguay.17 In all cases, these probabilities decrease with age and reach minimums at around 40 years of age. This decline of the probabilities of stopping contributions with age is to be expected, since young individuals tend to change jobs and spend time out of the labor market more often than mature individuals.
In some but not in all cases, the transition rates out of contributing rise at advanced ages. This pattern would be the expected one if death and retirement were computed as transitions out of contributing, but not if these events were treated as censored observations. Since our goal was to characterize workers contribution behavior conditional on not retiring and not dying, we did not compute a transition when we observed that a worker died or retired. In this view, it is not so clear why transition rates out of contributing rise at these ages. One possible explanation is that we could not always identify retirement or even death. It is worth noticing also that the number of observations is comparatively low at advanced ages, so the error is higher.
17 Uruguayan public employees show higher transition rates, but these figures should be taken
The transition rates out of contributing are strikingly high in Argentina. At no age, the average transition rates fall below 5 percent per month among men and only at 68 it falls below 4 percent per month among women. The rates of transition out of contributing tend to be smaller in Uruguay than in Argentina and Chile. As expected, the transition rates out of public employment in Uruguay are particularly low, but they are also low in the private sector compared to the rates we found in Argentina and Chile.
The average transition rates out of not contributing do not show the same age patterns across countries. Argentinean workers aged between 18 and 55 years have probabilities of making a transition from not contributing to contributing in the order of 5 percent per month. These probabilities fall at more advanced ages. Chilean workers show maximum transition rates out of not contributing at 20. At this age, the probability that a Chilean worker starts contributing in any month is about 7 to 8 percent for men and about 5 percent for women. The transition rates fall at higher ages. Uruguayan workers also show maximum transition rates out of not contributing at around 20 in the private sector and a bit later in the public sector. The maximum average transition rates out of not contributing by age are close to 5 percent per month in Uruguay.
V. Concluding Remarks
The picture that emerges from our study is worrisome. In the three countries, the density of contributions is low on average and pretty heterogeneous across the population. In the periods covered by our study, working-age Chileans registered in the social security system contributed about half of the time, and Argentineans and Uruguayans a bit more (55 and 60%, respectively). With these densities, the expected number of years of contribution that the average worker would have accumulated at 60, if he had started working at 18, would be between 22 years in Chile and 25 years in Uruguay (with Argentina in between).
Average densities are not too different between men and women in Argentina and Uruguay, but Chilean women show much smaller densities than Chilean men.
In the periods spanned by our databases -1994 to 2001 in Argentina, 1981 to 2006 in Chile, and 1996 to 2004 in Uruguay-, we observe a steady improvement in Chile and deteriorations in Argentina and Uruguay. In the three countries, contribution densities fluctuated along the business cycle and it is not clear to what extent the decline in densities observed in Argentina and Uruguay respond to a temporary phenomenon.
In the three countries, the spells of contribution exhibit frequent interruptions. On average, the spells of contribution lasted only 12 months in Argentina, 28 months in Chile and 33 months in Uruguay. Low income workers tend to have more frequent interruptions. Transition rates out of contributing are high at early ages and tend to reach a minimum at about 40 years old. Transition rates out of not contributing peak at early ages and then tends to decline. Argentina shows strikingly high transition rates, which is consistent with the short spells of contribution.
In sum, the three countries present low densities of contribution, frequent interruptions and short durations. Densities are particularly low and interruptions are particularly frequent among low income workers. We are not aware of similar studies for other Latin American countries, but taking into account that Argentina, Chile and Uruguay are among the countries with higher social security coverage, we expect other countries in the region to have even lower densities. What is less obvious is whether these lower densities are also associated with shorter spells of contribution, i.e. with more frequent interruptions.
References
Arenas de Mesa, A., M. C. Llanes, and Fidel Miranda Bravo (2006). “Protección social efectiva, calidad de la cobertura, equidad y efectos distributivos del sistema de pensiones en Chile”. Serie: Financiamiento del Desarrollo 172, CEPAL.
Berstein, S., G. Larraín and F. Pino (2006). “Chilean Pension Reform: Coverage Facts and Policy Alternatives”. Economía 6(2): 227–279.
Berstein, S. (2010). “The Chilean Pension System”. Santiago: Chilean Pensions Supervisor (El Sistema Chileno de Pensiones. Santiago: Superintendencia de Pensiones), available at: www.spensiones.cl
Bertranou, F. and A. Sánchez. (2003). “Características y Determinantes de la Densidad de Aportes a la Seguridad Social en la Argentina 1994-2001.” In Historias Laborales en la Seguridad Social. Buenos Aires: Ministerio de Trabajo, Empleo y Seguridad Social.
Bravo, D., J. Behrman, O. Mitchell, and P. Todd. (2006). Encuesta de Protección Social 2004. Presentación General y Principales Resultados. Santiago: Subsecretaría de Previsión Social, available at http://www.proteccionsocial.cl/documentos2004.htm.
Bucheli, M., A. Forteza and I Rossi. (2008). “Work Histories and the Access to Contributory Pensions: The Case of Uruguay.” Journal of Pension Economics and Finance (Published online by Cambridge University Press 18 Aug 2008 http://journals.cambridge.org/action/search).
Corbo, V. and K. Schmidt-Hebbel. (2003). “Efectos Macroeconómicos de la Reforma de Pensiones en Chile.” In Desafíos de los Sistemas de Pensión en América Latina, Federación Internacional de Administradoras de Fondos de Pensiones, available at www.fiap.cl.
De Biase, M. and C. Grushka. (2003). “Historias Previsionales y la Regularidad de los Afiliados al SIJP.” In Historias Laborales en la Seguridad Social. Buenos Aires: Ministerio de Trabajo, Empleo y Seguridad Social.
Seguridad Social. Buenos Aires: Ministerio de Trabajo, Empleo y Seguridad Social.
Farall, R., D. Aisenberg, M. Bourquin, E. Caviglia, F. Dabusti, S. Mychaszula, H. Pena, A. Sanmiguel and D. Zagaglia. (2003). “Estudio sobre la Frecuencia de los Aportes en el SIJP. Una Primera Aproximación hacia las Historias Laborales.” In Historias Laborales en la Seguridad Social. Buenos Aires: Ministerio de Trabajo, Empleo y Seguridad Social.
Ferreira-Coimbra, N. and A. Forteza (2004). “Protección Social en Uruguay: Financiamiento, Cobertura y Desempeño, 1990–2002”. Santiago: International Labor Organization.
Forteza, A., L. Lucchetti, and M. Pallares-Miralles. (2009a).“Measuring the Coverage Gap”. In: R. Holzmann, D. A. Robalino and N. Takayama (eds): Closing the Coverage Gap. The Role of Social Pensions and Other Retirement Income Transfers. Washington DC, The World Bank.
Forteza, Alvaro; Ignacio Apella; Eduardo Fajnzylber; Carlos Grushka; Ianina Rossi and Graciela Sanroman. (2009b). “Work Histories and Pension Entitlements in Argentina, Chile and Uruguay”. SP Discussion Papers Nº 0926, World Bank.
Gill, Indermit, Truman Packard, and Juan Yermo (2003). “Keeping the Promise of Old Age Income Security in Latin America”. Washington: World Bank. Holzmann, Robert and Richard Hinz (2005). “Old Age Income Support in the 21st Century: an International Perspective on Pension Systems and Reform.” The World Bank.
Lagomarsino, G. and B. Lanzilotta (2004). “Densidad de Aportes a la Seguridad Social en Uruguay. Análisis de su Evolución y Determinantes a Partir de los Datos Registrales de Historia Laboral (1997–2003)”. Equipo de Representación de los Trabajadores en el BPS, Montevideo.
Rofman, R., E. Fajnzylber and G. Herrera (2008a). “Reforming the Pension Reforms: The Recent Initiatives and Actions on Pensions in Argentina and Chile.” Washington DC: World Bank.
Figure 1
Coverage of the Labor Force in Argentina, Chile and Uruguay
0 10 20 30 40 50 60 70 80
1992 1994 1996 1998 2000 2003 2006
Years
(%
)
Argentina Chile Uruguay
Figure 2
Figure 2
Distribution of the Density of Contributions (cont.)
Notes: Contributions to the Argentinean SIJP between July 1994 and December 2001, the Chilean AFP program between 1981 and 2004 and the Uruguayan BPS between April 1996 and December 2004.
Figure 3
Evolution of contribution densities and rates of unemployment
.1 .1 2 .1 4 .1 6 .1 8 R a te of U n e m pl o y m e n t .4 6 .4 8 .5 .5 2 .5 4 De nsi ty
1994 1995 1996 1997 1998 1999 2000 2001
Year
Density Men Density Women
Rate of Unemployment
Argentina .0 5 .1 .1 5 .2 .2 5 Ra te o f Un e m p lo y ment .2 .3 .4 .5 .6 De ns it y
1980 1985 1990 1995 2000 2005
Year
Density Men Density Women
Rate of Unemployment
Figure 3
Evolution of contribution densities and rates of unemployment (cont.)
.1
.1
2
.1
4
.1
6
.1
8
R
at
e o
f
U
ne
m
pl
oy
m
e
n
t
.5
8
.6
.6
2
.6
4
.6
6
.6
8
De
n
s
it
y
1996 1997 1998 1999 2000 2001 2002 2003 2004
Year
Density Men Density Women
Rate of Unemployment
Uruguay
Figure 4 Transition rates 0 .02 .04 .06 .08 .1 .15
20 30 40 50 60 70
Age Contributing NOT Contributing Men 0 .02 .04 .06 .08 .1 .15
20 30 40 50 60 70
Age Contributing NOT Contributing Women Argentina 0 .0 2 .0 4 .0 6 .08 .1 .15
20 30 40 50 60 70
Age Contributing NOT Contributing Men 0 .0 2 .0 4 .0 6 .08 .1 .15
20 30 40 50 60 70
Age Contributing NOT Contributing Women
Figure 4
Transition rates (cont.)
0 .0 2 .0 4 .0 6 .0 8 .1
20 30 40 50 60 70
Age Contributing NOT contributing
Men, private sector
0 .0 2 .0 4 .0 6 .0 8 .1
20 30 40 50 60 70
Age Contributing NOT contributing
Women, private sector
Uruguay 0 .02 .04 .06 .08 .1 .15
20 30 40 50 60 70
Age Contributing NOT contributing
Men, public sector
0 .02 .04 .06 .08 .1 .15
20 30 40 50 60 70
Age Contributing NOT contributing
Women, public sector
Uruguay
Notes: Contributions to the Argentinean SIJP between July 1994 and December 2001, the Chilean AFP program between 1981 and 2004 and the Uruguayan BPS between April 1996 and December 2004.
Table 1
Aggregate Pension Statistics in Argentina, Chile and Uruguay (2006)
Argentina Chile Uruguay
Spending on Pensions as % of GDP A 6.4 3.1 10.8
Elderly population (% of population
over 65) 9.9 8.1 13.4
Average Pension (% of per Capita
GDP) 52.8 33.8 44.0
Coverage of Elderly (as % of
Population Aged 65+) B 70.5 75.5 85.6
Coverage of Labor Force (%) 39.2 62.7 60.9
Notes: A Contributory old-age pensions: Uruguay includes old-age, survival and disability;
Chilean calculations include contributory pensions (old-age, disability and survivorship) paid from both the PAYG and the AFP systems; B Argentinean coverage may have increased after the
Pension Inclusion Program implemented by the government in 2007.
Table 2
Densities of contribution by sex
Argentina Chile Uruguay
Mean densities
Men 55.0 57.9 62.4
Women 56.9 43.0 64.2
Total 55.9 51.4 60.2
Median densities
Men 55.6 61.3 69.5
Women 61.2 39.2 73.3
Total 56.7 52.2 65.7
Notes: Contributions to the Argentinean SIJP between July 1994 and December 2001, the Chilean AFP program between 1981 and 2006 and the Uruguayan BPS between April 1996 and December 2004.
Source: Authors’ computations based on the work history records of social security.
Table 3
Contribution densities by age
Age Argentina Chile Uruguay
20 34.7 29.9 39.1
35 69.2 55.3 67.6
50 68.0 63.6 73.8
Notes: Contributions to the Argentinean SIJP between July 1994 and December 2001, the Chilean AFP program between 1981 and 2006 and the Uruguayan BPS between April 1996 and December 2004.
[image:30.595.125.395.476.556.2]Table 4
Contribution densities by income level
Argentina Chile Uruguay
Poorest Quintile 44.1 34.9 46.6
2nd Quintile 51.4 46.3 59.5
3rd Quintile 54.5 52.2 64.1
4th Quintile 58.6 59.8 68.6
Richest Quintile 67.7 64.9 73.3
Notes: Contributions to the Argentinean SIJP between July 1994 and December 2001, the Chilean AFP program between 1981 and 2006 and the Uruguayan BPS between April 1996 and December 2004.
Table 5
Argentina. Duration of Spells of Contribution in Sample, July 1994 to December 2001
Characteristics Mean Median
Percentage of Spells in Sample with Durations... < 6
Months
6-12 Months
12-24 Months
24-36 Months
>36 Months
Total 11.8 6 43.8 23.6 16.4 6.8 9.5
Sex
Men 11.6 6 44.9 23.3 16.0 6.5 9.5
Women 12.3 7 40.8 24.4 17.5 7.8 9.5
Regime
PAYG 11.3 6 45.8 23.3 15.9 6.3 8.8
Capitalization 13.8 8 35.1 24.9 18.7 9.1 12.3
Type of Worker
Employed 13.1 7 39.0 25.0 17.1 7.3 11.6
Self-Employed 11.9 7 42.5 21.9 19.1 8.2 8.3
NA 6.0 3 66.5 18.8 10.5 3.0 1.3
Income Bracket
Poorest Quintile 8.4 5 55.2 22.6 13.5 5.0 3.8
2nd Quintile 10.9 6 45.0 23.6 18.0 7.0 6.4
3rd Quintile 13.0 8 37.4 24.6 19.6 8.3 10.2
4th Quintile 14.9 8 32.5 26.0 18.4 8.8 14.4
Richest Quintile 18.8 12 22.8 26.2 18.7 9.1 23.2
Note: The sample window is 90 months. Only spells within the observation window were computed. Each income bracket includes the minimum of the interval.
Table 6
Argentina. Duration of Spells of No Contribution in Sample, July 1994 to December 2001
Characteristics Mean Median
Percentage of Spells in Sample with Durations... < 6
Months
6-12 Months
12-24 Months
24-36 Months
>36 Months
Total 12.4 7 39.5 22.5 20.6 9.4 8.1
Sex
Men 12.2 7 40.0 22.7 20.7 9.2 7.6
Women 13.1 8 38.7 21.8 20.2 10.0 9.3
Regime
PAYG 12.3 7 39.2 22.7 20.9 9.4 7.8
Capitalization 13.1 7 41.1 21.1 18.9 9.2 9.8
Type of Worker
Employed 9.8 6 46.6 22.7 19.4 7.1 4.1
Self-Employed 9.9 6 45.2 23.2 20.1 7.8 3.7
NA 23.0 20 11.5 20.9 24.6 18.3 25.0
Income Bracket
Poorest Quintile 11.3 7 39.5 24.0 22.5 8.7 5.4
2nd Quintile 10.2 6 43.3 24.4 20.4 8.2 3.8
3rd Quintile 10.1 6 45.0 23.1 19.8 8.0 4.1
4th Quintile 8.9 5 51.1 22.0 17.8 5.8 3.4
Richest Quintile 7.2 4 60.5 18.8 14.3 4.1 2.4
Note: The sample window is 90 months. Only spells within the observation window were computed. Each income bracket includes the minimum of the interval.
Table 7
Chile. Duration of Spells of Contribution in Sample, 1981 to 2006
Characteristic
s Mean Median
Percentage of Spells in Sample with Durations...
< 6 Month
s
6-12 Months
12-24 Months
24-36 Months
>36 Months
Total 28.3 7.0 42.6 17.3 12.8 6.3 21.0
Sex
Men 28.4 8.0 42.0 17.4 13.4 6.4 20.8
Women 28.0 7.0 43.7 17.2 11.7 6.1 21.3
Income Bracket Poorest
Quintile 16.7 5.0 54.0 18.3 11.4 4.8 11.4
2nd Quintile 21.6 7.0 43.3 19.3 14.0 6.8 16.6
3rd Quintile 25.7 8.0 40.7 18.3 14.0 7.0 20.0
4th Quintile 35.7 10.0 36.2 16.0 13.3 6.9 27.6
Richest
Quintile 54.1 15.0 33.5 12.2 10.4 6.2 37.6
Note: The sample window is 288 months. Only spells within the observation window were computed. Each income bracket includes the minimum of the interval.
Table 8
Chile. Duration of Spells of No Contribution in Sample, 1981 to 2006
Characteristic
s Mean Median
Percentage of Spells in Sample with Durations...
<6 Months
6-12 Months
12-24 Months
24-36 Months
>36 Months
Total 22.7 8.0 36.8 23.3 14.3 7.4 18.1
Sex
Men 17.8 7.0 40.8 24.2 14.6 7.1 13.3
Women 30.6 11.0 30.4 22.0 13.9 7.9 25.9
Income Bracket Poorest
Quintile 27.1 10.0 30.6 24.2 15.7 8.0 21.5
2nd Quintile 22.5 8.0 36.5 24.0 14.0 7.8 17.8
3rd Quintile 20.7 8.0 38.4 24.1 14.4 7.0 16.1
4th Quintile 20.4 8.0 40.2 22.3 14.2 7.2 16.1
Richest
Quintile 21.7 8.0 41.0 20.9 12.9 6.6 18.7
Note: The sample window is 288 months. Only spells within the observation window were computed. Each income bracket includes the minimum of the interval.
Table 9
Uruguay. Duration of Spells of Contribution in BPS Sample, April 1996 to December 2004
Characteristics Mean Median
Percentage of Spells in Sample with Durations...
<6 Months
6-12 Months
12-24 Months
24-36 Months
>36 Months
Total 33.2 13 31.5 15.3 13.0 6.8 32.8
Sex
Men 31.4 12 33.5 15.7 13.0 6.5 30.7
Women 35.7 16 28.6 14.7 13.0 7.2 35.8
Sector
Public 67.8 96 11.7 7.6 7.0 3.4 67.9
Private 29.1 11 33.8 16.2 13.7 7.2 28.7
Income Bracket
Poorest Quintile 24.4 8 42.6 15.8 12.1 5.8 23.2
2nd Quintile 30.4 13 30.7 17.0 14.8 7.8 29.2
3rd Quintile 31.8 14 28.9 17.1 14.9 7.4 31.2
4th Quintile 35.3 17 27.2 15.3 13.7 7.5 35.6
Richest Quintile 46.8 30 27.4 10.1 8.6 4.9 47.9
Note: The sample window is 105 months. Only spells within the observation window were computed. Each income bracket includes the minimum of the interval.
Table 10
Uruguay. Duration of Spells of No Contribution in BPS Sample, April 1996 to December 2004
Characteristics Mean Median
Percentage of Spells in Sample with Durations...
<6 Months
6-12 Months
12-24 Months
24-36 Months
>36 Months
Total 17.6 7.0 45.6 16.7 12.9 7.8 17.3
Sex
Men 14.7 5.0 53.5 14.9 11.6 6.8 13.4
Women 22.9 11.0 30.8 19.9 15.3 9.7 24.6
Sector
Public 15.7 6.0 47.0 19.9 12.2 7.7 14.1
Private 17.7 7.0 45.5 16.5 12.9 7.8 17.4
Income Bracket
Poorest Quintile 21.5 9.0 40.9 15.0 13.0 8.3 23.0
2nd Quintile 17.8 7.0 44.1 16.5 14.1 8.1 17.4
3rd Quintile 15.4 6.0 49.5 16.3 12.7 7.5 14.2
4th Quintile 15.1 5.0 50.4 16.7 12.1 7.4 13.7
Richest Quintile 17.7 8.0 42.4 21.0 12.0 7.8 17.3
Note: The sample window is 105 months. Only spells within the observation window were computed. Each income bracket includes the minimum of the interval.