Web Services over the UMV: Unified Visualization Model
M. Luj´an Ganuza* Sergio R. Martig
Silvia M. Castro
Departamento de Ciencias e Ingenier´ıa de la Computaci´on VyGLab
Laboratorio de Investigaci´on en Visualizaci´on y Computaci´on Gr´afica Universidad Nacional del Sur
Avenida Alem 1253
Argentina, CP 8000, Bah´ıa Blanca, Buenos Aires {mlg, srm, smc}@cs.uns.edu.ar
Abstract
Visualization is the science of transforming data or information into images, engaging the human visual sensory apparatus, as well as the processing power of the human mind. The result is a simple and effective medium for communicating complex information. In other words is the science of representing data in a visual form in order to achieve communication or understanding. Together with the growing demand of visualizing big volumes of data is growing the trend of developing Distributed Environments of Visualization. Therefore arises the necessity to design an architecture that allows desktop visualization using distributed resources which could be combined to solve the problem in an efficient way. In this context we present a new approach, that combines the visualization pipeline, the UVM (Unified Visualization Model) and the Web Service Concept.
Keywords: Visualization, Web Services, UVM, Visualization Pipeline, Graph Visualization, GIS Visualiza-tion, Mobile Devices.
1.
INTRODUCTION
Visualization is the science of transforming data or information into images, engaging the human visual sensory apparatus, as well as the processing power of the human mind. The result is a sim-ple and effective medium for communicating comsim-plex information. In other words is the science of representing data in a visual form in order to achieve communication or understanding.
With databases rapidly increasing in size, the visualization of such data sets can became computer-intensive and complex, producing visualizations that could turn out to be difficult to understand and to analyze for the user without relying on the appropriate visual support. This ever growing amount of available information is extremely useful and exciting, but generates cognitive overload and even anxiety, especially in occasional or novice users. While computational power has increased exponen-tially, the ability to interact with useful information has only increased incrementally. In this context the more significant Visualization contribution is to make the exploration of huge data sets easier.
Together with the growing demand of Visualization of big volumes of data is growing the trend of developing Distributed Environments of Visualization. The basic idea consists of distributing the
*
original visualization pipeline across a distributed system, more precisely, Internet and The Grid, maintaining the traditional visualization pipeline concept by providing an ability o divide a visualiza-tion into its components parts and then build upon by allowing each of the parts to be deployed on an appropriate resource. To achieve such a system is necessary to rely on an architecture according to it. Therefore arises the necessity to design an architecture that allows desktop visualization using distributed resources which could be combined to solve the problem in an efficient way.
In this context we present a new approach, that combines the visualization pipeline, the UVM (Unified Visualization Model) and the Web Service Concept.
2.
UNIFIED VISUALIZATION MODEL: UMV
The“Unified Visualization Model”[29, 28] was developed to create an unified conceptual frame-work, independent from the data domain. This model takes under consideration the characteristics of all visualization areas. The unified model focuses on the visualization processes as well as in the data stages along de whole process.
In this model, the user’s interactions play a central roll, because is the user who interacts with the visualization and, based on his/her interpretations of the visual representation, modifies the image to steer the calculation, remap the data representation in order to better understand its structure, or create a new representation which highlights a particular feature.
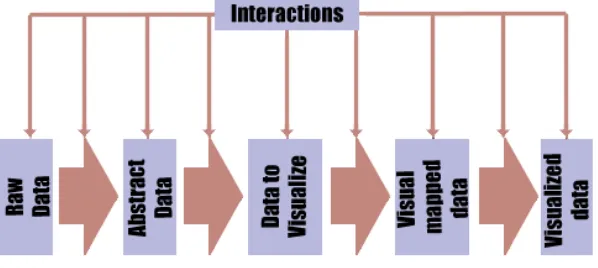
The Unified Visualization Model consist of stages along a flow, representing the transformations of data. Each stage is a data stage and the edges are the transformations to move from one stage to the next.
[image:2.595.148.447.510.644.2]The unified model considers five stages and four transformations as can be seen on figure 1. The transformations and the stages along this flow are a reflection of the user interaction on the visualization process. A brief description of the stages and transformation in the Unified Visualization Model is presented as follows[8]:
Figura 1: Visualization Pipeline
Stages
Raw data:Data from the application domain.
Data to visualize:Data that will be visualized. It can be a subset of the “Abstract data”
Visual mapped data:Data to be visualized along with all the necessary information for its visual representation.
Visualized data:This is the result from the visualization process. This is the starting point for the user to begin his/her visual exploration and navigation process.
Transformations
Raw data to Abstract Data:This transformation allows the user to select the data he/she wants to visualize. After the selection, the data moves from the data domain representation to an inner and manageable structure.
Abstract data to Data to be Visualize:From the “Abstract data” stage the user will select all the data that will be visualized.
Visual Mapping:This transformation allows the user to specify how he/she wants to vi-sualize all the data in the previous stage. All the necessary structures to support the spatial substrate, the visual elements and their attributes are created from this transformation.
Visualization Transformation: This transformation allows the creation on screen of all the data in the “Visual Mapped Data”. This will usually include the application of some visualization technique that supports all the restrictions imposed in the “Visual Mapping” transformation.
3.
VISUALIZATION USING WEB SERVICES
The basic premise behind Web Service is that a piece of code is made available to remote machine, using specific protocols over the Internet. The Service part of Web Service relates to the idea of providing access to functionality without having to download or install the code, and the Web part refers to the mean through which the functionality is accessed. The Web Service Concept is based on the concept of Simple Oriented Architectures (SOA) and allows software components, including objects and processes of different systems, to be expose as services.
Our goal is to develop a Distributed Visualization Model applying Web Services on different stages of the visualization process. The basic idea consists of distributing the original visualization pipeline across a distributed system, more precisely, Internet and The Grid, maintaining the tradi-tional visualization pipeline concept by providing the ability to divide a visualization process into its components parts and then build upon by allowing each of the parts to be deployed on an appropriate resource. To achieve such a system is necessary to rely on an architecture according to it. Therefore arises the necessity to design an architecture that allows desktop visualization using distributed re-sources which could be combined to solve the problem in an efficient way. Besides is desirable to achieve an extensible and collaborative architecture.
Nowadays several projects are being developed aiming to achieve a distributed visualization envi-ronment orientated to Web Services [6][4][22][5][24]. There is anyway a task that presents a serious trouble. This task consists of the ability of providing fluid interactions between the web services and the client. Until the moment none concrete solutions has been presented to solve this problem.
3.1. Visualization over the UVM
and reflects both data stages and the transformations that make possible the evolution of data throw the Visualization pipeline. Using this model as reference, a distributed model is presented where the implementation of the stages and the interactions are based on Web Services. The fist approach of distributing the pipeline across a distributed system consists in convert each stage of the pipeline on a Web Service (see figure 2). This task may sound easy, but it can turn out to be extremely complicated. This first attempt gave place to the following Web Services, which try to cover all the stages of the original UVM pipeline. The figure 3 illustrates the whole distributed architecture.
Data Service
Interactive Services AD
Filtering Service DTV
Interactive Services DTV
Visual Mapping Service
Rendering Service
3.1.1. Data Service
The Data Service convert the Raw Data Set to an Abstract Data Set. The raw data could be pre-sented in diverse formats, as tables, records sets, etc. In the MUV project the raw information is stored on a XML file. The abstract data generated represent a transitional state, a manipulable intern but still not visual format. This Service works transforming the raw information into Entities Tables and Rela-tion Tables. Furthermore, Metadata Tables will be generated, which provide descriptive informaRela-tion, useful to the visualization process. In other words, the Data Service returns an Abstract Data Set, which will be explored by the client. Finally, this distributed architecture counts with a Data Base Server. Besides sending the Abstract Data Set to the client, the Data Service also stores this set on the Data Base Server, which will generate an unique identifier to this set called DBSID (Data Base Server Identifier). After the set is stored on the Server, the identifier is sent to the client, who will use it to address this set any time he needs it.
3.1.2. Interactive Services AD
The Interactive Services AD constitute a family of Web Services commended to implement the interactions that the client could make over the Abstract Data Set. These interactions depend on the nature of the data set, the application domain and the format in which the data is presented.
3.1.3. Filtering Service DTV
Figura 2: Web Services over the UVM
3.1.4. Interactive Services DTV
The Interactive Services DTV constitute a family of Web Services commended to implement the interactions that the client could make over the Data To Visualize Set.
3.1.5. Visual Mapping Service
In some point of the process is necessary to associate visual elements to data elements, allowing these data to be shown on the screen. This service is in charge of creating all the necessary structures to support the spatial substrate, the visual elements and their attributes. This service generates visual information and allows its manipulation.
3.1.6. Rendering Service
the service client who will be limited only to show it on screen. The Rendering Service implements de visualization technique indicated by the user. The visual mapping done by the Visual Mapping Service gives the set of applicable visualization techniques. It’s clear than in this step of the process many visualization techniques could be applied, giving place to different implementations of the Rendering Service, each developed to execute an independent visualization technique.
Figura 3: UVM Distributed Architecture
4.
APPLICATION: GRAPH VISUALIZATION USING WEB SERVICES
On the basis of all said above we are developing a Graph Visualization Application using Web Ser-vices. The selected programming language is JAVA, and the JWSDP package is used to develop Web Services. The JWSDP (Java Web Service Developer Pack, http://java.sun.com/webservices/download/ previous/webservicepack.jsp) is a free software development kit (SDK), a tool and library set for de-veloping Web Services, Web applications and Java applications with the newest technologies for Java. Basically the Application consists on a graph visualization tool where the processing load is on the server, and the user is constrained only to execute requests over a Data Set. This Data Set is also stored on the server side.
4.1. The goal of the application
which interactions are necessary interactions on a useful and effective Visualization. We pretend to achieve an application interactive enough to supply a valid interaction schema, in other words, we aspire that the application allows the user not only the generation of the rendered image, but also different ways of interaction over the view with the goal of exploring the data on an effective way.
To achieve such an application the following tasks are considered very important.
Define which interactions are necessary and which are not on an effective graph visualization. This assignment allows an equitable relation between interactivity and computational cost.
Classify the selected interactions stating which ones are applied over the view and which others over the data. This is important because on this property depends how much is necessary to go back in the pipeline.
As the data set is stored on the server side, all queries and interactions over the Data Set require net traffic, involving low performance on the distributed system in general. We said that all the processing load is on the client, so the interactions done by the user over the view also involve net traffic. As the client doesn’t count with software or hardware support to create the visualization, he only gets an image from the server and interacts over this image making requests to the server. All this lead on a very slow system.
Particularly in this case we assume as a first approach that all the web services described on section 3 are located on the server machine or they could be spread over different machines on a distributed system.
5.
FUTURE WORK
In this area, we focus on two projects: continue working on the Graph Visualization Application explained in section 4 and develop a GIS Visualization Project using mobile devices. We present now a brief description of this two Projects.
5.0.1. Future work on the Graph Visualization Application
After finishing the first prototype we pretend to explore different ways to distribute the processing load. One alternative consists on moving the processing load that used to be on the server to the client, either using a piece of code installed on the work station of the user or some code downloaded from the server (a java applet, for example). The general goal is to achieve an balance between the processing load distribution that allows the developing of an effective and interactive application.
5.1. GIS Visualization using mobile devices
Geographical Information System (GIS) introduce methods and environments to visualize, ma-nipulate, and analyze geospatial data. This kind of systems requires seamless integration and sharing of spatial data from a variety of providers[3], so the web services seam to be an appropriate tool to achieve interpretability across users and providers.
Figura 4: Graph Visualization Application Schema
(Mobile Geographical Information System), a new research area dedicated to the visualization, analy-sis and manipulation of geospatial data using mobile devices. Both traditional GIS Systems and Mobil GIS Systems create new opportunities and challenges to the users providing information accord their necessities.
These two subjects (GIS and Movile GIS) have already been tackled at our Research Laboratory “Laboratorio de Investigaci´on y Desarrollo en Visualizaci´on y Computaci´on Gr´afica” (VYGLab) [9, 10, 11]; next step consists on define a Mobile GIS Visualization System using Web Services. The system is planned to follow the client-server model, where the client could be any mobile device and the server is accessed across the Internet.
Is clear that in this scenario different processing load distribution could be taken into account, where is going to be the Data Set stored or where the rendering process will be done constitute two important decisions that determine the final performance of the whole system. Then we need to state which components are provided by the server and which are on the client. From this task the following classification has been arisen:
Figura 5: GIS Client-based and Server-based Visualization Model
This approach works as follow: The client makes a request to the data server asking for a data set. The Server returns the data solicited and the client starts the process of visualizing these data. After that, all interactions over this visualization that do not require new data are done in the client. If some additional data is needed, the client will have to call another web service to the Data Server asking for the corresponding data. As all the processing load is on the client, the interaction schema results very fluid, because once the client got the Data Set from the Server he works locally showing, exploring and managing the view.
Server-based Visualization Although the mobile communication technology is in constant growing the mobile devices still don’t reach the processing capabilities of moderns work sta-tions, whereby the Client-based Visualization schema could not result appropriate on environ-ments with mobile devices with low processing power. With this kind of device in mind the Server-based Visualization approach arose.
In this new model, the client only makes requests to the server, and shows on screen the jpg im-age that the server returns. The server is in charge of doing all the rendering process, requesting the Data Set indicated by the user to a Data Base Server.
On this approach, the processing load is on the server, so as been said is not a restriction to the mobile devices to have processing power, but the interaction schema became very slow. This fall of performance lies on the communication costs necessaries to make any change on the view. As the client only shows an image, any time he wish to interact with this view will have to call a Web Service which force the Server to redo the rendering process taking into account the new specifications. Once the rendering is done, the server returns a new jpg image to the client.
In figure 4 both approaches are illustrated.
other words, we pretend to achieve a balanced model with some part of the rendering process located on the server, and the other part on the client. The idea is lo get an approach with a fluid interactions schema and low communication cost, all this using mobile devices with low processing power.
6.
ACKNOWLEDGEMENTS
This work was partially supported by the projects “Herramienta de visualizaci´on para la explo-raci´on de datos” (PGI 24/ZN12) and “Representaciones Visuales e Interacciones para el an´alisis visual de grandes conjuntos de datos” (PGI 24/N020), Science and Technology Department of the Universi-dad Nacional del Sur (SECyT, UNS).
REFERENCIAS
[1] Gustavo Alonso, Fabio Casati, Harumi Kuno, and Vijay Machiraju. Web Services: Concepts, Architecture and Applications. Springer Verlag, 2004.
[2] Cheong S. Ang, David C. Martin, and Michael D. Doyle. Integrated control of distributed volume visaulization through the world-wide-web. InVIS ’94: Proceedings of the conference on Visualization ’94, pages 13–20, Los Alamitos, CA, USA, 1994. IEEE Computer Society Press.
[3] G.C.Fox A.Sayar, M.Pierce. Developing gis visualization web services for geophysical applica-tions.
[4] K. Brodlie and J. Wood. Volume graphics and the internet, 2000.
[5] I.J. Grimstead, N. J.Avis, D.W. Walker, and R.N.Philp. Resource-aware visualization using web services. 2004.
[6] R.B. Haber and D. A. McNabb. Visualization idioms: A conceptual model for scientific visual-ization systems. InVisualization in Scientific Computing. 1990.
[7] A. Kee. Visualization over www using java. Master’s thesis, 1996.
[8] Sergio Martig y Silvia Castro Mart´ın Larrea. Semantic based visualization: A first approach. 2008.
[9] Silvia Castro y Sergio Martig Maximiliano Escudero. Modelos de terrenos y gis para disposi-tivos m´oviles. 2006.
[10] Silvia Castro y Sergio Martig Maximiliano Escudero. Visualizaci´on de terrenos en dispositivos m´oviles. 2007.
[11] Silvia Castro y Sergio Martig Maximiliano Escudero. Visualizaci´on progresiva de terrenos en dispositivos m´oviles. 2008.
[12] Corporation. MSDN Microsoft. Fundamentos de los servicios web, http://www.microsoft.com/. 2003.
[14] M. E. Newman. The structure of scientific collaboration networks. Proc Natl Acad Sci U S A, 98(2):404–409, January 2001.
[15] Mark O’Neill. Web Service Security. 2003.
[16] Rima Patel Sriganesh Ramesh ˜Nagappan, Robert Skoczylas. Developing Java Web Services.
[17] P. Rheingans and C. Landreth. Perceptual principles for effective visualizations, 1995.
[18] Bernice E. Rogowitz, Lloyd A. Treinish, and Steve Bryson. How not to lie with visualization.
Comput. Phys., 10(3):268–273, 1996.
[19] N. Holliman S. Charters and M. Munro. Visualization on the grid: A web service approach, 2004.
[20] Martin K. Schroeder W. and Lorensen B. The visualization toolkit: An object-oriented approach to 3d graphics. Prentice Hall PTR, 1996.
[21] S. H. Strogatz. Exploring complex networks. Nature, 410(6825):268–276, March 2001.
[22] Malcolm Munro Stuart M. Charters, Nicolas S. Holliman. Visualisation on the grid: A web service approach. 2005.
[23] W3C. Gu´ıa breve de servicios web, [http://www.w3c.es/divulgacion /guiasbreves/serviciosweb]. 2006.
[24] Yunsong Wang. Visualization web service. Master’s thesis, 2003.
[25] Mark Waterhouse. Web services architect review. 2002.
[26] Jason Wood, Helen Wright, and Ken Brodlie. Collaborative visualization. InVIS ’97: Proceed-ings of the 8th conference on Visualization ’97, pages 253–ff., Los Alamitos, CA, USA, 1997. IEEE Computer Society Press.
[27] Zuo Xiaqing and Li Qingquan. The deliver and visualization of geospatial information in mobile gis. 2005.
[28] Sergio Martig y Silvia Castro. Interacciones b´asicas en el modelo unificado de visualizaci´on. In
CACIC 2006, Congreso Argentino de Ciencias de la Computaci´on, pages 747–760, 2006.
[29] Sergio Martig y Silvia Castro y Pablo Fillottrani y Elsa Est´evez. Un modelo unificado de visual-izaci´on. InProceedings 9oCongreso Argentino de Ciencias de la Computaci´on., pages 881–892,