Keywords:
• X-ray diffraction • texture
• primary extinction • secondary extinction • microstructure Information on the article: received: January 2013, reevaluated: April 2013, accepted: May 2013
Extinction Phenomenon in X-Ray
Diffraction Technique for Texture Analysis
Fenómeno de extinción en la técnica de difracción
de rayos X para el análisis de textura
Cadena-Arenas Antonio
Escuela Superior de Física y MatemáticasInstituto Politécnico Nacional, México E-mail: camiridena@hotmail.com
Kryshtab Tetyana
Escuela Superior de Física y MatemáticasInstituto Politécnico Nacional, México E-mail: kryshtab@gmail.com
Palacios-Gómez Jesús
Escuela Superior de Física y MatemáticasInstituto Politécnico Nacional, México E-mail: palacios@esfm.ipn.mx
Kryvko Andriy
Escuela Superior de Ingeniería Mecánica y Eléctrica, Zacatenco Instituto Politécnico Nacional, México
E-mail: kryvko@gmail.com
Abstract
Introduction
In poly crystal line materials, grains are rarely ran -domly distributed from the point of view of crystallo -graphic orientation. The preferred crystallo-graphic orientation, or texture, arises during the manufactu -ring processes owing to anisotropic properties of indi -vidual grains and in turn, it affects different material properties (Bunge, 1987) and the correct evaluation of texture is important for materials research. The com -mon method for quantitative texture analysis by X-rays diffraction (XRD) from a crystalline medium is based on the measurement of pole figures (PF) (Bun -ge, 1996; Kocks et al., 1998; Randle et al., 2000) that are characterized by pole densities (PD) obtained from the measured X-ray reflected intensities. The data of two-dimensional PFs are used for calculating a three-di -mensional representation of the orientation density in terms of the orientation distribution function (ODF).
Since the initial information to obtain a PF is the data of reflected intensities, the fact that in PF measure -ments the extinction phenomenon can be present should be taken in to account. Indeed, it has been shown that extinction is present in PF measurements, and specially in those of low index reflections (Krys -htab et al., 2004; Tomov, 2011; Palacios-Gómez et al., 2010) with X-ray as well as with neutron diffraction, and a brief proof of the presence of this phenomenon can be easily done by comparing the PDs from PFs for higher order reflections with those for the first order reflections; here only PDs in maxima of PFs have been analyzed. If this phenomenon is present, it cannot be avoided and it reduces PDs in PFs for the first order
reflection as compared to PDs in PFs for higher order reflections.
On the other hand, neither PFs nor ODFs contain information of microstructure details such as grain size and lattice perfection of grains. The conventional method for evaluation of microstructure in polycrysta -lline materials using XRD is based on the diffraction peak broadening (Warren, 1969; Langford, 1978) and ki -nematics cattering theory (Krivoglaz, 1996). It is impossi -ble to use this method in the case of real crystals with low dislocation density, where full-width at half maximum of the peak reaches the instrumental breadth (Authier et al., 1980). In such crystals the X-ray dynamic scattering pro -cesses come into being and lead to the extinction pheno -menon. The characteristics of extinction have been introduced into the kinematic theory in the form of two different phenomena (Darwin, 1922; Zachariasen, 1963) as the primary extinction, which depends on the size of coherently diffracting crystallites, and the secondary
ex-tinction, which depends on disorientation of crystalli
-tes. Therefore, the characteristics of extinction relate to the crystal microstructural feature and can be used for its evaluation.
An original technique for correction of the PD in the maximum of a PF and for the evaluation of grain mi -crostructure using the characteristics of the primary and secondary extinctions was proposed by (Kryshtab
et al., 2004), and was applied to an aluminum sample.
Whereas the problem of the separation of contributions of PD and extinction phenomenon in XRD measure -ments of textured materials, when primary and secon -dary extinctions are present simultaneously, cannot be solved exactly, some reasonable assumptions were pro
-Resumen
Un método para corregir densidades de polos (DP) por extinción primaria y
secundar-ia en máximos de figuras de polos (FP) medidos por difracción de rayos X, se extendió a todos los datos de las FP 111 y 200 de muestras de níquel con 75% laminación en frío y recocido posterior de 600°C durante 30 minutos. Las DP fueron corregidas, y los parámetros de extinción primaria y secundaria fueron calculados utilizando las DP medidas en FP para las reflexiones de primer orden con dos radiaciones (Cu Kα y Co Kα) y para las reflexiones de segundo orden con radiación de Cu Kα. Se calcularon tres funciones de distribución de orientación (FDO): la primera a partir de FP para reflex
-iones 111, 200 y 220, la segunda a partir de las FP 222, 400 (los segundos ordenes) y 220 (en ausencia de segundo orden) y la tercera con las FP para las reflexiones 111 y 200 corregidas por extinción y la FP 220 no corregida (en ausencia de segundo orden). Las diferencias esenciales entre las FDO obtenidas, indican la necesidad de tomar en cuenta el fenómeno de extinción en el análisis de materiales con textura. Los parámet
-ros de extinción obtenidos fueron utilizados para evaluar los datos de la microestruc
-tura para níquel en función de la orientación de los granos, que no es fácil obtener por métodos convencionales metalográficos.
Descriptores:
• difracción de rayos X • textura
posed in the above mentioned work. These assump -tions were used for a material (aluminum) that has the K-absorption edge distant from wavelengths of X-ray radiation commonly used for PFs measurements.
In the present work, for further development of the mentioned technique (Kryshtab et al., 2004) we extend the validation of the approximations for a material, na -mely nickel, whose wavelength of its K-absorption edge lies very close to the wavelengths used for PFs measurements. It is expected that not only PDs, but also the parameters of primary and secondary extinction can change throughout the PFs. The corrections of PDs in the whole PFs, particularly for 111 and 200 PFs were performed, and the determined parameters of the pri -mary and secondary extinction were used to estimate the grains microstructure. Changes of microstructure characteristics depending on grain orientations were also shown. Using the data of measured PFs, and of PFs partially corrected by this technique, three ODFs were calculated as follows: one from 111, 200 and 220 PFs (the first order reflections); another one from 400 and 222 PFs (the second order reflections) as well as 220 PF (the second order 440 reflection for this direction is ab -sent owing to wide Bragg angle with radiations used); and the last one from the corrected 111 and 222 PFs and not corrected 220 PF (it cannot be corrected by the applied method for lack of the second order reflection), respectively.
Experimental details
Samples of commercial nickel after 75% cold rolling with and without consequent annealing were used for PFs measurements by the XRD technique. A nickel sample after cold rolling was heated in a furnace at the heating rate of 10oC/min up to 600oC and held at this
temperature during 30 minutes. A nickel powder stan -dard sample was also measured with the same condi -tions of the textured samples for
PFs normalization, defocusing and background correction. For texture analysis a one-axis D8 Advance Bruker X-ray diffractometer with an Euler cradle and with two non-po -larized Cu Kα and Co Kα radiations was used. Pole figures for <111>, <100> and <110> crystallographic directions were measured for the first and second order reflections using a 5 × 5 deg (tilt and rotation) collection grid. The samples were
oscillated along the direction of
ro-lling with amplitudes of 4-6 mm in order to average over a significant number of diffracting grains. Measu -rement duration for weak second order reflections was several times longer as compared with the duration for low index reflections. Data analysis was performed using the pop LA (preferred orientation package – Los Alamos) texture package. The WIMV algorithm was used to convert the normalized PFs data to complete ODF data.
In order to get the information about grain size and shape distribution, metallographic studies were carried out on the face of one of the edges of a sample, after polishing and etching it with a mixture of HNO3 acid diluted with H2O (2:1) at room temperature, and using
the optical microscope OLIMPUS model PM3 with a Hitachi camera KP-D50.
Results and discussion
The images of the cross-section microstructure of Ni samples after the rolling and subsequent annealing at 600oC are shown in Figure 1.
After the cold rolling the grains have heteroge -neous sizes and elongated shape with a length of up to 500 µm in the rolling direction and 80 µm in the trans -versal direction. The annealing process results in changes of grains shape and size. Grains become al -most equiaxial with a length up to 70 µm. Taking into account the grains size and the absorption coefficients of the radiations used, the X-ray beam was reflected from the grains of the sample surface. Therefore, osci -llation amplitudes of 4-6 mm were chosen to include as many grains as possible along the rolling direction of samples for PFs measurements. The presence of tex -ture in the samples studied was confirmed by the com -parison of peak intensities distribution in XRD patterns measured with Cu Kα- radiation and the si -mulated one for Ni powder.
Pole figures for cold rolled nickel sample
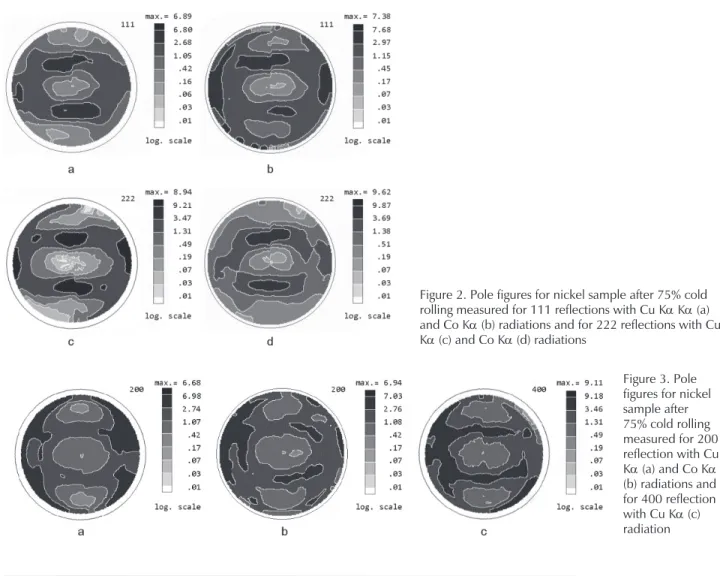
The normalized {111} PFs for the nickel sample after 75% cold rolling measured using Cu Kα and Co Kα- ra -diations for the first order 111 reflection and for the se -cond order 222 reflection are shown in Figure 2. We observed an insignificant difference between PDs in maxima of PFs measured for the same order reflection with different radiations and more essential difference between the PDs in maxima of PFs measured for the first and second order reflections. It should be noted that PDs in maxima of PFs measured for both reflec -tions with Cu Kα-radiation are somewhat less than the ones measured with Co Kα - radiation.
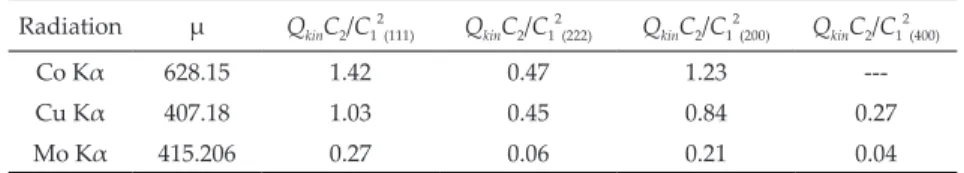
Similar results were also observed for the normali -zed {200} PFs measured using Cu Kα and Co Kα- radia -tions for the first order 200 reflection and for the second order 400 reflection (Figure 3). It should be noted that a 400 reflection with Co Kα-radiation was not measured owing to the wide Bragg angle for this reflection.
Smaller values of PDs obtained in the maxima of PFs for the first order reflections than those for the se
-cond order reflections for both crystallographic direc -tion sindicate the presence of extinc-tion phenomenon even in the Ni sample after common cold rolling.
Theoretical basis
The normalized PD (Pm) at a general point of the PF measured by XRD technique is defined as:
/
T P
m m m
P =I I (1)
Where T m I and P
m
I are the integrated intensities measu -red for the textu-red sample and for a powder standard sample of the same material, respectively.
Applying the theory of (Zachariasen, 1963) for the secondary extinction in mosaic crystals, it was shown (Kryshtab et al., 2004) that when primary and secon -dary extinction phenomena are present simultaneously, the measured PD for any point of the PF is:
2 2/ 1 m real
kin P P
g Q C C
em =
m + e (2)
Figure 2. Pole figures for nickel sample after 75% cold rolling measured for 111 reflections with Cu Kα Kα (a) and Co Kα (b) radiations and for 222 reflections with Cu Kα (c) and Co Kα (d) radiations
Where Preal is the true PD, ε is the primary extinction
coefficient, g is the secondary extinction coefficient, µ is the linear absorption coefficient, Qkin is the integrated
reflectivity per unit volume given by: 2
2 3
0 2 0 sin2
H kin
c
r F
Q
v
l =
θ (3)
Where r0 is the classical radius of the electron, vc is the
unit cell volume, λ is the radiation wavelength, θ0 the
diffraction angle, FH the structure factor, and C1 and C2
are polarization factors defined as:
( )
20
1 cos 2n 2
n
C = + θ , n = 1, 2. (4)
As one can see from Eq. (2), the measured PD depends on the values of the primary extinction coefficient, the secondary extinction coefficient and the extra term QkinC2/C12.
Let us now analyse how different factors can affect the measured PD.
(i) Preal is a constant value for a given crystallographic
direction <hkl> and certain point of the PF. This means that for every point of the pole figure Eq. (2) is also valid for different wave lengths and reflection orders with the same value of Preal.
(ii) The secondary extinction coefficient is a characteris -tic of the crystallites disorientation and for a given crystallographic direction and certain point of the PF is also a constant value. It does not depend on the order of reflection and radiation wavelengths used. However, the influence of the secondary extinction on Pm is equivalent to an extra term to the linearab
-sorption coefficient mand for different wavelengths and order reflection it is determined by the ratio bet -ween the values of m and QkinC2/C12. The calculated
values of the linear absorption coefficients mand ex-tra term of QkinC2/C12 for nickel for different wave
-lengths and reflections are listed in Table 1.
As one can see, the value of the extra term decreases for the second order reflections and its contribution in ab
-sorption part of intensity is less for Co Kα - radiation. Therefore, if only secondary extinction is present, the measured PD must be less in PF measured with Cu Kα - radiation as compared with PD in PF measured with Co Kα - radiation and also it must be higher for the second order reflection as compared with the one for the first order reflection. This is precisely what we observed in the measured PFs (Figures 2 and 3).
(i) The value of the primary extinction coefficient is not a constant; it depends on crystal perfection and can be evaluated within the framework of the dynamic diffraction theory (Pinsker, 1978). The primary extinction coefficient depends on the size of coherently diffracting crystallites (domains) l
and the extinction length Λ as:
( )( )
1tanh l l −
e = Λ Λ . (5)
For a given grain microstructure the coherent domain size for a given crystallographic direction and certain point of the PF is a constant value, but the extinction length depends on the reflection and wavelength of the radiation used. For the symmetrical Bragg (reflection) case and non-polarized radiation Λ can be calculated according to (Kryshtab et al., 2002) as:
0
1 ,
2 dync H
v d C r F
Λ = (6)
where r0 is the classical radius of the electron, vc is the
unit cell volume, d is the spacing of the lattice planes (hkl), Cdyn = (1 + cos 2θ)/2 is the polarization factor for
dynamical scattering, FH is the structure factor that
de-pends on the atomic scattering amplitude and on the dis
-persion corrections, which are determined by the ratio of
the K-absorption edge wavelength (for NilK= 0.149 nm) and the wavelength of the radiation used. The calculated values of extinction length for Ni samples, taking into account the structure factors with dispersion corrections and the temperature Debye factor (International Tables for X-ray Crystallography, 1992) for different reflections with the different radiations used, are listed in Table 2.
Radiation μ QkinC2/C12(111) QkinC2/C12(222) QkinC2/C12(200) QkinC2/C12(400)
Co Kα 628.15 1.42 0.47 1.23
---Cu Kα 407.18 1.03 0.45 0.84 0.27
Mo Kα 415.206 0.27 0.06 0.21 0.04
Table 1. Calculated values of the absorption coefficient μ(cm–1) and the extra term of QkinC2/C12 (cm–1) for nickel for CoKα-, CuKα-, and MoKα- radiations and
From Eq. (5) and Table 2 one can see that the influence of the primary extinction on measured PD is stronger in PF measured with Cu Kα - radiation as compared with PD in PF measured with Co Kα - radiation (lower value of PDCu) and this influence decreases considerably for the second order reflection. So, if we take into account only the primary extinction, the measured PD also must be less in PF measured with Cu Kα - radiation as compared with PD in PF measured with Co Kα - radia-tion and it should increase for the second order reflec
-tion as compared with the one for the first order reflection.
Therefore, the obtained results can be completely explained considering the presence of extinction phe -nomenon in PFs measurements.
Pole figures for annealed nickel sample
The normalized PFs for the nickel sample after a cold rolling and subsequent annealing at 600°C during 30 minutes measured using Cu Kα and Co Kα - radiations for the first order 111 reflection and for the second or -der 222 reflection are shown in Figure 4. For annealed nickel sample, once again, an insignificant difference between PDs in maxima of PFs measured for the same order reflection with different radiations with a lower
value of PD for PFs measured with Cu Kα - radiation was observed. At the same time the difference between the PDs in maxima of PFs measured for the second or -der reflection increased in about 2.5 times as compared to the PDs in maxima of PFs measured for the first or -der reflection.
Reflection ΛMo (μm) ΛCu(μm) ΛCo(μm)
111 0.496 0.679 0.735
200 0.621 0.903 1.035
220 1.140 2.163 2.777
311 1.553 3.411 2.754
222 1.699 3.404 2.760
400 2.330 3.417
-Table 2. Calculated values of extinction length (Λ) for different reflections from Ni with radiations used
Figure 4. Pole figures for nickel sample after 75% cold rolling and subsequent annealing at 600°C measured for 111 reflection with Cu Kα (a) and Co Kα (b) radiations and for 222 reflection with Cu Kα (c) and Co Kα (d) radiations
This shows a stronger influence of extinction pheno -mena on the measured diffracted intensities from the
textured annealed sample and consequently on mea
-sured PDs for this sample as compared with the sam-ple after a cold rolling. It should be noted that a
comparison of PDs in maxima of PFs measured only
for the first order reflection for the sample after a cold rolling (Pmax,roll = 7.38) and for the sample after a cold rolling and subsequent annealing (Pmax,ann = 5.0) can lead to the conclusion that the annealing results in a texture decrease for <111> direction. But the
compari-son of PDs in maxima of PFs measured for the second
order reflection, where the influence of extinction is weak, shows another result of the annealing, (Pmax,roll = 9.62 and Pmax,ann = 12.70), i.e. the annealing results in the texture increase for <111> direction. Therefore, in the case of a strong influence of extinction phenome -non on the measured PDs the interpretation of obtai -ned results can be incorrect.
The normalized PFs for the nickel sample after cold rolling and annealed at 600°C measured for the first or -der 200 reflection using Cu Kα - and Co K α - radiations and for the second order 400 reflection with Cu K α - radiation (400 reflection with Co Kα - radiation was not measured) are shown in Figure 5.
For this <100> crystallographic direction the diffe -rence between the PDs in maxima of PFs measured for the first and the second order reflections increased in about 2 times. A comparison of PDs in maxima of PFs measured for the first order reflection for the sample after a cold rolling, and for the sample after a cold ro -lling and annealing shows that the annealing results in an increase of texture in 1.4 times. At the same time, a comparison of PDs in maxima of PFs measured for the second order reflection, shows that texture increased in more than 2 times, that is more close to the real result.
For the second order reflections the extinction phe -nomenon is not completely excluded, (at least the se -condary extinction is present) and for the refinement of texture analysis data it is necessary to correct PFs ta -king into account the characteristics of the primary and secondary extinction. The applied XRD technique (Kryshtab et al., 2004) can be used to correct the PDs in PFs measured for nickel samples after the evaluation of validity of the proposed assumptions, since the nickel K-absorption edge is very close to the wavelength of the radiations used.
Evaluation of the assumptions
(i) The main assumption was used for the coefficient of the primary extinction (e), that for low index reflec
-tions this coefficient depends insignificantly on the wavelength used, and thus, the average value can be used for different wavelengths. This coefficient de -pends on the value of the extinction length, Eq. (5), which in turn depends on the structure factor, Eq. (6). The structure factor depends on the atomic
scat-tering amplitude, which for a given reflection is a
constant for different wavelength and also on the dispersion corrections, which are determined by the
ratio of the wavelengths of the K- absorption edge for the sample and the radiation used. Therefore, the variations of the extinction length for a given re -flection in dependence on the wavelength used should be examined for nickel sample. From Table 2 one can see that the extinction lengths for the first order reflections (111 and 200 reflections) do not change essentially for Co Kα and Cu Kα radiations, but for Mo Kα - radiation this difference is more than 25%. Thus, the first assumption is valid for Ni with the use of Co Kα- and Cu Kα - radiations.
(ii) The next important assumption of the proposed te -chnique, was that for the second order reflection the primary extinction coefficient (e) is equal to unity. As mentioned above, the ratio between the measu -red PDs in the maxima of PFs for the first (P(hkl)) and
the second (P2(hkl)) order reflections is less than 1/2 (the increase of PD for the second order reflection in more than 2 times). In the case when the secondary extinction is not taken into account (g = 0 in Eq. (2)), the ratio is connected with the primary extinction coefficient as:
. (7)
So, the value of e for the first order reflections is less than 0.5 and the ratio l/Λ is about 2 (International Ta
-bles for X-ray Crystallography, 1992). Taking into ac -count the calculated values of extinction length Λ for the first and the second order reflections (Table 2) and that the coherent domain size l is some constant value for a given grain microstructure and a given crysta -llographic direction, one can see that the ratio l/Λ for the second order reflections with Cu K α - radiation will decrease to 0.3-0.4 owing to the increase of ex -tinction length in about five times. For this value of ratio the value of the primary extinction coefficient e is about 0.96-0.95. Therefore, the approximation that the primary extinction coefficient approaches to the unit can be used for nickel samples in the case of Cu K α - radiation.
(hkl) 2(hkl)
Correction of pole figures and orientation distribu-tion funcdistribu-tion
Thereby, a system of three equations can be used for PDs correction in PFs for nickel samples, as it was
pro-posed by (Kryshtab et al., 2004) with the result:
( )
(
( ) 2 12)
hklCo kin Co cor Co
m Co
P m + eg Q C C = m eP
( )
(
( ) 2 12)
hklCr kin Cu cor Cu
m Cu
P m + eg Q C C =P m e (8)
( )( )
(
)
2 2
( ) 2 1 hkl
Cu kin Cu cor Cu
m Cu
P m +gQ C C =P m
In a system two equations for PDs measured for the
same first order reflection with Co Kα - and Cu Kα - ra-diations, and one equation for PDs measured for the
second order reflection with Cu Kα - radiation are used. In the equations Pm is the measured PD and Pcor is the
corrected PD, others symbols are defined in Eq. (2), (3) and (4).
Figure 6 shows the wholly corrected PFs for 111 and 200 reflections for the nickel sample after 75% cold ro -lling and annealing at 600°C. PDs were corrected in every point of the measured PFs, solving a system of
three equations (8).
The values of PDs in the maxima of normalized PFs measured for different reflection with Cu Kα - and Co
Kα - radiations as well as corrected ones for nickel sam -ples after cold rolling and cold rolled with subsequent annealing at 600°C are listed in Table 3.
In the corrected PFs the values of PDs in maxima increased. For example, the corrected PD in the maxi -mum of corrected PF for 111 reflection (Figure 6a) in -creased in 3.75 times and for 200 reflection (Figure 6b) it increased in 3.2 times as compared with the PDs obtai -ned in the PFs measured for the first order reflections with Cu Kα radiation (Figures 4a and 5a) indicating a stronger influence of extinction phenomenon on PF measurements for 111 reflection.
The data of normalized PFs measured for the first or -der 111, 200 and 220 reflections; measured for the second order 222 and 400 reflections and for 220 reflection (440 cannot be measured); and PFs corrected for 111 and 200 reflections and measured for 220 reflection (it was im -possible to correct 220 reflection for lack of 440 reflection for radiations used) were used for the calculation of three ODFs. The results are presented in Figure 7.
As one can see, not only the details somewhat chan -ged in calculated ODFs, but also the values of orienta -tion density increased in more than 1.5 times in ODF calculated from the PFs for second order reflections and in 2 times in ODF calculated from the corrected ones with respect to this value in ODF obtained from the PFs for first order reflections, which have the strongest in
-Sample Reflection (hkl) PDMCu PDMCo PDMcorr Rolled Ni 111 6.89 7.38 9.84
222 8.94 9.62
200 6.68 6.94 9.28 400 9.11
220 10.85 9.88
Rolled and 111 4.57 5.00 17.15 annealed Ni 222 11.74 12.7
200 9.78 11.49 31.64 400 20.13
220 8.11 8.45
Table 3. PDs in the maxima of PFs measured for different reflection with Cu Kα (PDMCu) and Co Kα
(PDMCo) radiations as well as corrected ones (PDMcorr) for
nickel samples after a cold rolling and cold rolled with subsequent annealing at 600°C
fluence of extinction phenomenon on the diffracted in -tensity. It should be noted that PF for 440 reflection, for which the influence of extinction phenomenon should decrease considerably, and corrected PF for 220 reflec -tion were not used for ODF calcula-tions by the above mentioned reasons, which leads to somewhat less value of orientation density with respect to the real one. The obtained results show that the use of only the first order reflections for PFs measurements, for which the presen -ce of extinction phenomenon is evident, can lead to an incorrect interpretation of the treatment process, as it was observed for <111> crystallographic direction, to a considerable decrease of PDs in PFs and the values of orientation density in ODFs.
Evaluation of grain microstructure
Solving system of equations (8) for correction of PDs, the coefficients of primary and secondary extinction are also calculated. The coefficients of the primary extinc -tion and the values of extinc-tion length for the given reflection and radiation (Table 2) were used for the eva
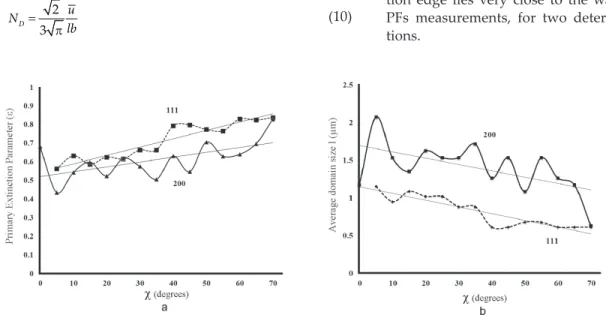
-luation of the average coherent domain size in depen -dence on grains orientation (each orientation of the sample at its inclination and rotation). In Figure 8 the calculated parameter of the primary extinction e and the evaluated average size of coherent domain l are pre-presented in dependence on the grains orientation, des -cribed by the sample tilt angle χ and averaged over the whole range of sample rotation φ, for 111 and 200 re -flections for nickel sample after 75% cold rolling and annealing at 600°C.
The domain size is determined as the average leng -th of -the coherently diffracting crystallite in -the direc -tion normal to the diffracting planes. As one can see from Figure 8, the domain sizes are larger for the <100> direction as compared to the ones for the <111> direc -tion and changed in dependence on the grain crystallo -graphic orientation in such a way that the size is larger in the grains with the diffracting planes parallel to ro -lling surface and continually decreases in grains with the diffracting planes inclined to rolling surface for the both above mentioned directions. It needs to be pointed out, that not every point of the PF gave acceptable solu
tions for system of equations (8), in particular, in the points of the PF, where measured intensities from the textured sample are low up to underground. Also, it must be mentioned that the observed variations in the calculated dependences apparently are not related to real changes in the parameter of the primary extinction and the evaluated average domain size, since the solu -tion of system of three equations (8) is obtained using the values of three PDs affected with measurement
errors that propagate with slight increments or decre -ments to Pcorr. One more reason that can generate these
variations is the texture inhomogeneity that affects the averaged value of PD at sample rotation φ, which was used for the calculations.
The evaluated average domain size (coherently dif -fracting crystallite) (Figure 8b), which was used for the calculation of dislocation density is almost a hundred times smaller than the real grain size (Figure 1b).
The determined values of the secondary extinction g
(Figure 9a) give us the possibility to calculate the avera -ge angle of domains disorientation ū (Figure 9b) assu -ming a Gaussian distribution of the domains (Ivanov et al., 1983) that can be observed in many cases, according to:
u 1 / 2 2= πg. (9)
Within the framework of the mosaic crystal model it is possible to calculate the dislocation density ND in
do-main boundaries using the calculated values of l and ū as (Larson et al., 1969):
2 3
D u
N
lb
=
π (10)
where b is the magnitude of Burgers vector. For nickel that has the f.c.c. structure, the absolute value of Bur -gers vector for perfect dislocations is taken as b = (a/2) [110] (a = 0.3523 nm is the lattice constant). The calcu -lated dislocation densities ND in domain boundaries in
dependence on grains orientation for rolled and an -nealed Ni sample are shown in Figure 9c. Figures 8 and 9 include only acceptable results for the values of e and g.
This difference appears in the grain with some amount of dislocations not only in domain boundaries, but also with individual dislocations in the grain. The -refore, the dislocation density in domain boundaries is
somewhat overestimated owing to this reason. The mo
-del of the mosaic crystal used does not take into account this situation and, unfortunately, a complete theory for the estimation of the dislocation density at their
hetero-geneous distribution does not exist. This is the subject of further investigations.
Conclusions
In the present work the influence of extinction pheno -menon on the data of PFs measurements for the first order reflections is demonstrated.
The evaluation of the approximations used in the applied XRD technique for quantitative texture analy -sis, when extinction phenomenon is present, demons -trated their validity for PD correction and determination of the primary and secondary extinction coefficients for a textured material, whose wavelength of the K-absorp -tion edge lies very close to the wavelengths used for PFs measurements, for two determined X-ray radia -tions.
It was shown that even in the measurements of PFs for a sample with common cold rolling the extinction phe -nomenon can be present.
The correction of PDs, taking into account the ex -tinction phenomenon, was performed in whole PFs measured for 111 and 200 reflections. A comparison of ODFs calculated using PFs, strongly affected, slightly affected and corrected for extinction, presents differen -ces, which show the necessity to take into account the extinction phenomenon for the refinement of quantita -tive texture analysis by XRD.
The characteristics of microstructure and their de -pendences on grains orientations with respect to sam -ple surface for different crystallographic directions, determined from the coefficients of the primary and the secondary extinctions, can be used for the evaluation of microstructure modification in grains at technological processes.
Acknowledgements
The authors would like to thank the CONACyT in Mexico for financial support of this work by the pro
-jects N 83425 and N 83781.
References
Authier A., Balibar F., Epelboin Y. Theoretical and Experimental Study of Interbranch Scattering Observed near a Dislocation Line in X-Ray Topography. Physica Status Solidi (b), volume 41 (issue 1), 1980: 225-238.
Bunge H.J. Physical Versus Mathematical Aspects in Texture Analysis. Textures and Microstructures, volume 25, 1996: 71-108.
Bunge H.J. Three-Dimensional Texture Analysis. International
Ma-terials Reviews, volume 32, 1987: 265-291.
Darwin C.G. XCII. The Reflexion of X-Rays from Imperfect Crys
-tals. Philosophical Magazine Series 6, volume 43 (issue 257), 1922: 800-829.
International Tables for X-Ray Crystallography, Dordrecht, Bos
-ton, London, Kluwer Acad. Publ, volume III, 1992.
Ivanov A.N., Klimanek P.I., Skakov Yu.A. Use of the Extinction Effect to Analyze the Dislocation Structures of Crystals. Soviet Physics Crystallography, volume 28 (issue 1), 1983: 58-61. Kocks U.F., Tomé C.N., Wenk H.R. Texture and Anisotropy. Cam
-bridge, UK, University Press, 1998, pp. 126-158.
Krivoglaz M.A. X-Ray and Neutron Scattering in Nonideal Crystals, Berlin - Heidelberg - New York, Springer Verlag, 1996, pp. 101-136, 225-233.
Figure 9. Calculated parameter of the secondary extinction g (a), average angle of disorientation of domains
ū (b) and dislocation density ND in domain boundaries
Kryshtab T., Palacios-Gómez J., Mazin M., Gómez-Gasga G. Phe
-nomenon of Extinction in Textured Materials Analysis as a Source of Both Physical Error and Information on Microstruc
-ture Characteristics. Acta Materialia, volume 52 (issue 10), 2004: 3027-3034.
Kryshtab T.G., Palacios Gómez J., Mazin M.O. Phenomenon of Primary and Secondary Extinction in Textured Material.
Re-vista Mexicana de Física, volume 48 (issue 2), 2002: 100-106. Langford J.I. A Rapid Method for Analysing the Breadths of Dif
-fraction and Spectral Lines Using the Voigt Function. Journal
of Applied Crystallography, volume 11, 1997: 10-14.
Larson J.A., Corey C.L. Extinction Changes During Annealing of Copper. Journal of Applied Physics, volume 40 (issue 7), 1969: 2708-2712.
Palacios-Gómez J., Walter J.M., Jansen E., Kryshtab T. Evidence of Extinction in Strongly Textured High-Purity Copper. Journal
of Applied Crystallography, volume 43 (issue 1), 2010: 38-41. Pinsker Z.G. Dynamical Scattering of X-Rays in Crystals,
Springer-Verlag, New York - Berlin - Heidelberg, 1978, pp. 48-55, 213-228. Randle V. and Engler O. Introduction to Texture Analysis Macrotex-ture, Microtexture and Orientation Mapping, Amsterdam, Gor
-don and Beach Science Publisher, 2000, pp. 61-86.
Tomov I. Extinction in Textures: Nullifying the Extinction Effect.
Bulgarian Chemical Communications, volume 43 (issue 2), 2011: 325-333.
Warren B.E. X-Ray Diffraction, Addison-Wesley, Publishing Co., New York, 1969, pp. 251-314.
Zachariasen W.H. The Secondary Extinction Correction. Acta
Crystallographica, volume 16 (issue 11), 1963: 1139-1145.
About the authors
Antonio Cadena-Arenas.He is Ph. D. candidate in the School of Physics and Mathematics, National Polytechnic Insti
-tute (IPN). He is Master of Science in Physics by the School of Physics and Mathematics, National Polytechnic Institute (IPN) (2007), has a Bachelor degree in Physics and Mathematics (2001) by the IPN. He taught at the se
-nior high school level education institute of the Federal District teaching physics and mathematics (2005). He currently works as professor in the School of Chemical Engineering and Extractive Industries ESIQIE-IPN, tea
-ching applied differential equations, vector calculus, precalculus and differential and integral calculus.
Jesús Palacios-Gómez.He studied BS in Physics and Mathematics at the School of Physics and Mathematics (ESFM), National Polytechnic Institute (IPN) and Doctorate in Natural Sciences at the Technical University of Aachen, Germany. He teaches at the School of Physics and Mathematics, National Polytechnic Institute (IPN) since 1969. Field of research: interaction of radiation with matter and the development of methods for studying diffraction structural materials; the extinction observed in X-ray diffraction and neutron measurement in polar figures textu
-red materials. He has published a paper a year internationally and attended on average one international and one national event per year. He has developed a set of practices XRD in condensed matter for final year students of the Bachelor in Physics and Mathematics. He is a member of the National System of Reserchers (SNI) in México.
Tetyana Kryshtab.She has worked for 33 years as a researcher in the area of Solid State Physics in characterizing the structure and microstructure (dislocations, point defects, residual stresses, etc.) Single crystals, polycrystals with texture, thin films and heterostructures with wells and quantum dots based semiconductor by X-ray diffraction. Her scientific career began at the Institute of Semiconductor Physics of the National Academy of Sciences of Ukraine, Kiev, Ukraine. Since 1999, she works at the School of Physics and Mathematics, National Polytechnic Institute (IPN) as Professor. She has published 116 articles in international and national journals indexed and ar
-bitrated, which have been cited 120 times, and 5 books specializing in radiation diffraction in solids. She has participated in over 70 international and national conferences and had over 150 confer on research projects. She assisted in the preparation of seven M. Sc thesis and 3 Ph. D. thesis. She is a level II member of SNI.
Andriy Kryvko. He obtained his Ph.D. in Mathematics at the National Polytechnic Institute IPN, Mexico City. He is a Bachelor in Actuarial Science by the University of Mexico; M. Sc. in Mathematics by the National Polytechnic Institute IPN, Mexico; BS in Physics and Mathematics by the National Polytechnic Institute (IPN), Mexico City, Mexico. AWARDS: Best average in 2007 in the Ph.D. program (Mathematics) IPN; Excellent performance and best average mastery in 2004, IPN. He has published 15 articles in international and national journals indexed and arbitrated. He is currently a research professor of the School of Mechanical and Electrical Engineering, IPN. Fields of study: ordinary differential equations, partial differential equations, asymptotic methods.
Citation for this article:
Chicago citation style
Cadena-Arenas, Antonio, Tetyana Kryshtab, Jesús Palacios-Gómez, Andriy Kryvko. Extinction Phenomenon in X-Ray Diffraction Tech-nique for Texture Analisis. Ingeniería Investigación y Tecnología, XV, 02 (2014): 241-252.
ISO 690 citation style