TítuloAnalysis of the chondrogenic potential and secretome of mesenchymal stem cells derived from human umbilical cord stroma
17
0
0
Texto completo
(2) tissues contain more stem cells with a higher in vitro expansion potential. Further, immune- privileged and immune-modulatory properties have been reported for UC-derived cells, which affords highly interesting approaches applicable for clinical use [7]. Importantly, because the UC is discarded after birth and the cells are easily accessible, the UC is a noncontroversial and noninvasive source of MSCs [8]. The Wnt family of signaling molecules is involved in chondrogenesis. Wnt proteins are distinguished by their capability to activate β-catenin into canonical Wnts (ie, Wnt3a) and noncanonical Wnts (ie, Wnt5a). The influence of Wnts on chondrogenesis is 2-fold and time dependent: at low levels Wnts promote chondroprogenitor differentiation, specifically through modulating Sox9 expression, and later at high levels they promote chondrocyte hypertrophy and subsequent endochondral ossification [9,10]. The regulation of chondrogenesis by Wnt signaling may depend on the environment of the cell or stage of differentiation [11]. Based on the role of Wnt signaling in cartilage development, it is not surprising that evidence indicating the involvement of Wnt signaling in the regulation of differentiated chondrocyte functions and cartilage disease is increasing. Although our current knowledge of the role of Wnt signaling in cartilage tissue is limited, a variety of Wnt signaling components may also regulate maintenance and destruction of cartilage tissue [12]. One challenge for the future is gaining a full understanding of the role of the Wnt signaling network in the maintenance of cartilage tissue and pathogenesis of joint disease. Lee et al. [13] performed a comparative proteome analysis of mesenchymal cells and chondrocytes to identify proteins differentially expressed during chondrogenesis. We used a proteomic strategy to study the secretome—proteins secreted into the medium during the differentiation process—of MSCs from UC stroma during their differentiation toward chondrocyte-like cells. Our previous work with a new model of chondrogenesis in vitro used to differentiate MSCs from synovium membrane [14] revealed high expression of collagen type II (COL2) by immunochemistry analysis and high amount of mRNA COL2 gene as early as 14 days in culture, demonstrating that it could be a good chondrogenesis model.. Materials and Methods Tissue collection Human UCs were obtained from cesarean sections performed on 23 healthy women in the Maternity Facility at Complejo Hospitalario Universitario A Coruña under the supervision of the hospital ethics committee. All tissues were obtained with fully informed consent and ethical approval by the supervisor of the Ethical Committee (CEIC) of Galicia. All women were between 26 and 35 years old. Isolation and culture of MSCs MSCs were isolated from UC stromal tissue by using a modification of the protocol developed by Messina et al. [15]. Briefly, the tissue was washed with phosphate-buffered saline (PBS) and cut in small pieces named explants, which were then incubated for three 5-min periods in an enzymatic cocktail containing 1.2 U/mL dispase and 112 U/mL type I collagenase (all from Sigma-Aldrich). The explants were cultured in Dulbecco’s modified Eagle’s medium (DMEM) with 10% fetal bovine serum, 1% penicillin, and 1% strep- tomycin (all from Sigma-Aldrich) and they adhered to the plastic plate. After 3 days, the explants were removed from the plate, leaving attached UC MSCs, which were cultured in monolayer in the same medium. When the cells reached 90% confluence, they were removed from the plate by using 2% trypsin (Sigma-Aldrich) in PBS and they were induced to differentiate toward mesodermal or ectodermal germinal lines. Chondrogenic differentiation MSCs at P1 were seeded into 96-well plates (Sarstedt) at 2x10⁴ cells per well in DMEM with 10% fetal bovine serum, 1% penicillin, 1% streptomycin, 1.5x10⁻⁴ M monothioglycerol, 5mg/mL ascorbic acid, and 6 mg/mL transferrin (all from Sigma-Aldrich) to facilitate spontaneous spheroid formation. Following this step, the medium was changed to chondrogenic medium composed of DMEM with 15% knockout serum (Gibco, Invitrogen), 5mg/mL ascorbic acid, 6 mg/mL transferrin, 10 mM dexamethasone, 1x10⁻⁷ M retinoic acid, and 1 ng/mL recombinant human transforming growth factor-β3 (TGF-β3) (ProSpec-Tany TechnoGene; Deltaclon). This medium was changed every 3 days. After 4, 7, 14, 28, and 46 days in the chondrogenic medium, the spheroids formed were collected, frozen, and stored.
(3) at -80ºC for posterior analyses. Control spheroids were grown under the same conditions, but in DMEM with 10% knockout serum (Gibco, Invitrogen), 1% penicillin, and 1% streptomycin (Sigma-Aldrich). Adipogenic and osteogenic differentiation MSCs at P1 were seeded in 96-well plates (Sarstedt) at 2x10⁴ cells per well in adipogenic or osteogenic commercial medium (Cambrex, Lonza), following the manufacturer’s instructions, to assess the mesodermal differentiation potential. The adipogenic cultures were stained with Oil Red O after 21 days in culture. Briefly, the culture plates were fixed in 10 mM sodium periodate, 2% paraformaldehyde, 75 mM L-lysine dihydrochloride, and 37.5 mM dibasic sodium phosphate (all from Sigma-Aldrich) at pH 7.4 for 15 min at room temperature, then air dried, and stained with a filtered solution of 0.3% Oil Red O to reveal lipid droplets. The osteogenic cultures were stained with Alizarin Red to assess calcium deposits after 21 days in culture. After fixation, cells were covered with Alizarin Red S 2% aqueous solution at pH 4.2 (Sigma-Aldrich) for 3 min. The cultures were then washed thoroughly with distilled water. Neuronal and myogenic differentiation Directed myogenic differentiation was performed following the method of Roura et al. [16], with some modifications. Briefly, cells were seeded in 96-well plates (Sarstedt) at 2x10⁴ cells per well in DMEM with 10% knockout serum, 1% penicillin, 1% streptomycin, 0.1 mM β-mercaptoethanol, and 40 ng/mL fibroblast growth factor; this medium was changed every 3 days. After 21 days in culture, the cells were fixed with 4% paraformaldehyde in PBS and immunostained with a monoclonal antibody against human myosin (1:20; Alexis Biochemical, Enzo Life Sciences AG). Neural differentiation was induced using the method of Kang et al. [17], with some modifications. The cells were seeded in 96-well plates (Sarstedt) at 2x10⁴ cells per well in DMEM with 10% knockout serum (Gibco, Invitrogen), 1% penicillin, 1% streptomycin, and 3 µL/mL of 5-azacytidine (Sigma-Aldrich). After 21 days in culture, the cells were fixed using 4% paraformaldehyde in PBS and immunostained with an anti- C-cadherin monoclonal antibody (1:25; Santa Cruz Biotechnology). Control spheroids were formed in the same way, culturing the cells in DMEM with 10% knockout serum (Gibco, Invitrogen), 1% penicillin, and 1% streptomycin, without further additives. FACS analysis Cells were fixed in 4% paraformaldehyde in PBS. After fixation, the cells were washed twice with PBS, permeabilized with PBS containing 0.1% Triton X-100 (Sigma-Aldrich) for 10 min, and then preblocked with 3% bovine serum albumin (BSA), or 2%–5% serum from the same species, in PBS. The following direct antibodies were used: phycoerythrin (PE) mouse anti-human CD34 (1:20; DakoCytomation); fluorescein isotiocyanate (FITC) mouse anti-rat CD44 (1:20; BD Pharmingen); FITC mouse anti-rat CD45 (1:20; BD Pharmingen); FITC mouse anti-human CD105 (1:100; Serotec); phycoerythrin Cy5.5 (PE-Cy5.5) mouse anti-human CD106 (1:20; Serotec); PE-Cy5.5-conjugated mouse anti-human CD90 (1:20; BD Pharmingen); PE-conjugated anti-human CD73 (1:20; BD Pharmingen); PEconjugated mouse anti-human CD166 (1:20; BD Pharmingen); R-PE mouse anti-human CD29 (1:100; BD Pharmingen), and the following primary antibodies were used: mouse anti-human Ki67 (1:20; Santa Cruz Biotechnology); mouse anti CD271 (1:20; Sigma-Aldrich); mouse anti-human CD117 (1:20; Serotec); Oct3/4 (Chemicon Inter- national, Millipore Iberica). For detection of primary anti- bodies not directly labeled, the cells were washed with PBS and then incubated with polyclonal rabbit anti-mouse IgD/PE Rabbit F(ab’)2 (1:1,000; DakoCytomation) for 30 min at room temperature. The stained cells were then washed twice with PBS and 10x105 cells were analyzed with a FACSAria flow cytometer (BD Bioscience). FACS data were generated by DIVA software (BD Bioscience). Negative control staining was performed using FITC-conjugated mouse IgG1k isotype, PE- conjugated mouse IgG1k isotype, and PE-Cy5.5-conjugated mouse IgG1k isotype (all from BD Pharmingen)..
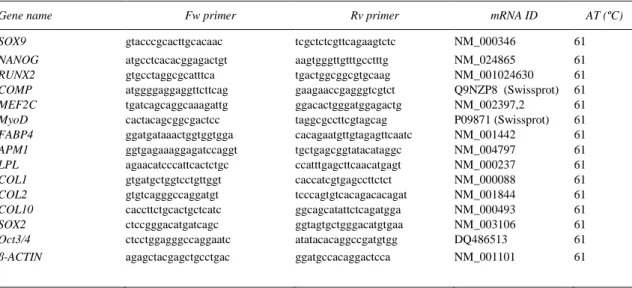
(4) RNA extraction and cDNA synthesis Total RNA was extracted from cells in culture using the Trizol L.S. reagent method (Invitrogen). Reverse transcription (RT) was carried out using the Superscript II system (Invitrogen). Total RNA (2 µg) was reverse transcribed in a 20 mL reaction volume containing Superscript II (200 units), random primers (25 µM), and dNTP (0.5 mM each) at 42ºC for 50 min. Real-time polymerase chain reaction analysis The reported sequences of genes for human SOX9, Nanog, Oct3/4, Sox2, MEF2C, MyoD, LPL, FAB4, AMP, ALP, OC, Runx2, and β-Actin were used for primer design. SOX9 were used to check the expression of the gene involved in early chondrogenesis stage. Nanog and Sox2 were used to check the expression of genes involved in no-differentiation stages. Genes for human MEF2C were employed to check for early neuronal differentiation, MyoD for myogenic differentiation, LPL, FAB4, and AMP for early and late adipogenic differentiation, and ALP, OC, and Runx2 to check early and late osteogenic differentiation. Details were shown in Table 1. The amplification program consisted of an initial denaturation at 92ºC for 2 min, followed by 40 cycles at 92ºC for 15 s, annealing at 61ºC for 30 s, and an extension at 72ºC for 15 s. Each polymerase chain reaction (PCR) analysis was done in duplicate, with each set of assays repeated 3 times. To minimize the effects of unequal quantities of starting RNA and to eliminate potential sources of inconsistency, the relative expression levels of each gene were normalized to β-actin using the 2-ΔΔCt method [18]. Control experiments did not include RT.. Table 1. Specific primers for real-time reverse transcriptase–polymerase chain reaction amplification, listed with their annealing temperature Gene name. Fw primer. Rv primer. mRNA ID. AT (ºC). SOX9. gtacccgcacttgcacaac. tcgctctcgttcagaagtctc. NM_000346. 61. NANOG RUNX2 COMP MEF2C MyoD FABP4 APM1 LPL COL1 COL2 COL10 SOX2 Oct3/4 β-ACTIN. atgcctcacacggagactgt gtgcctaggcgcatttca atggggaggaggttcttcag tgatcagcaggcaaagattg cactacagcggcgactcc ggatgataaactggtggtgga ggtgagaaaggagatccaggt agaacatcccattcactctgc gtgatgctggtcctgttggt gtgtcagggccaggatgt caccttctgcactgctcatc ctccgggacatgatcagc ctcctggagggccaggaatc agagctacgagctgcctgac. aagtgggttgtttgcctttg tgactggcggcgtgcaag gaagaaccgagggtcgtct ggacactgggatggagactg taggcgccttcgtagcag cacagaatgttgtagagttcaatc tgctgagcggtatacataggc ccatttgagcttcaacatgagt caccatcgtgagccttctct tcccagtgtcacagacacagat ggcagcatattctcagatgga ggtagtgctgggacatgtgaa atatacacaggccgatgtgg ggatgccacaggactcca. NM_024865 NM_001024630 Q9NZP8 (Swissprot) NM_002397,2 P09871 (Swissprot) NM_001442 NM_004797 NM_000237 NM_000088 NM_001844 NM_000493 NM_003106 DQ486513 NM_001101. 61 61 61 61 61 61 61 61 61 61 61 61 61 61. Fw, forward; Rv, reverse; AT, annealing temperature. Histological, immunofluorescence, and immunohistochemical analyses UC tissues were frozen at -80ºC until their immunoflu orescence analysis. Full-depth sections (4 mm) were cut using a cryostat and fixed in 4% (w/v) paraformaldehyde (Sigma-Aldrich) in PBS at pH 7.6. Immunofluorescence was performed by permeabilizing some sections with PBS containing 0.1% Triton X-100 for 10 min and then preblocking with 3% BSA or 2%–5% serum from the same species in PBS. The direct antibodies used were FITC mouse anti-rat CD44 (1:20; BD Pharmingen) or PE-Cy5.5– conjugated mouse anti-human CD90 (1:20; BD Pharmingen); 40 ,6-diamidino-2-phenylindole was used to counterstain the nucleus. Spheroids from UC-MSCs, following differentiation into chondrocyte-like cells, neuronal-like cells, and myogenic-like cells, were frozen in OCT embedding matrix (BDH Chemicals). Full-depth sections (4 mm) were cut using a cryostat and fixed in 4% (w/v) paraformaldehyde (Sigma-Aldrich) in PBS at pH.
(5) 7.6. Some sections were stained with hematoxylin and eosin, Safranin O, or Alizarin Blue (all from Sigma-Aldrich) to evaluate the distribution of matrix, proteoglycan, and polysaccharides, respectively. Other sections were immunostained with monoclonal antibodies against COL1 (1:1,000), COL2 (1:50), and COL10 (1:2,000) (all from Southern Biotechnologies) and used as previously described by Arufe et al. [14]. Biotinylated secondary antibodies were detected using a peroxidase-labeled biotin–streptavidin complex (Vectastain Elite kit; Vector Laboratories) with diaminobenzidine substrate (Vector Laboratories) (1:1,000). Human cartilage and skin were used as positive controls for detection of COL2, aggrecan, and COL1, respectively (data not shown). Normal mouse serum was used as a negative control, and the sections were not counterstained. Densitometry analysis AnalySIS Image Processing was used to quantify the expression of antibodies obtained by the immunohistochemical analyses of sections of the spheroids. Three 200-µm2 fields were quantified for each antibody; immunohistochemistry values in arbitrary units were assigned by the computer program. The values were expressed as the percentage of positive cells for each marker studied for immunohistochemistry analysis. All values were referenced to values obtained from stained sections of control spheroids cultured in DMEM. Control values for chondrogenesis were obtained using spheroids incubated only with secondary antibody during the immunohistochemistry analysis. Protein isolation and immunoblot analysis Immunoblot analysis was performed on 40 µg of total protein extracted from cells in culture, as previously described [19]. The blots were probed with antibodies directed against human β-catenin and glycerol-3-phosphate dehydrogenase (both from Sigma-Aldrich). A secondary anti-mouse antibody (Santa Cruz Biotechnology) was used to visualize proteins by using an Amersham™ ECL™ Western Blotting Analysis System (GE Healthcare, Amersham Biotechnology). Ideal concentrations for each antibody were empirically determined. Working concentrations were 1:1,000 of the recommended stock solutions. Secretome study Spheroids at 4, 7, 14, 28, and 46 days of chondrogenesis differentiation were washed in PBS and transferred to a well with only RPMI for 12 h. Proteins secreted from those spheroids into the medium were recovered, avoiding serum contamination. The medium containing the secreted proteins was filtered and concentrated using 10 kDa MWCO Amicon columns (Sigma-Aldrich). The concentrated medium (40 µL) was mixed with Laemmli protein loading buffer, and sodium dodecyl sulfate–polyacrylamide gel electrophoresis (SDS- PAGE) was performed using precast NuPAGE® NOVEX gels (Invitrogen) to ensure reproducibility in the separation of the proteins. The gels were stained with silver nitrate and the entire lane was divided into 16 sections (Fig. 7A). Each section was excised and in-gel digestion with trypsin was carried out following standard procedures. Each peptide mixture was cleaned and desalted with Poros R2 columns, injected using a trapping-column, and separated using a nanoLC system (Tempo; Eksigent, Applied Biosystems) in a C18 silica-based column with 300 Ǻ internal diameter (New Objective). Peptides eluted during a 50 min gradient up to 40% acetonitrile were mixed with α-cyano and deposited on a MALDI plate using an automatic MALDI spotter (Applied Biosystems). The mass spectrometry run for each fraction was analyzed in an ABI 4800 MALDI-TOF/TOF (Applied Biosystems) instrument and fragmentation— MS=MS—was done using a CID system (Applied Biosystems). Database searching was accomplished using ProteinPilot (Applied Biosystems) as the search engine for the latest SwissProt release (SP release 57.10, November 2009), with 512,205 entries. Only proteins with at least one specific (unused score = total score) human peptide identified with >99% confidence were considered for inclusion in the final list..
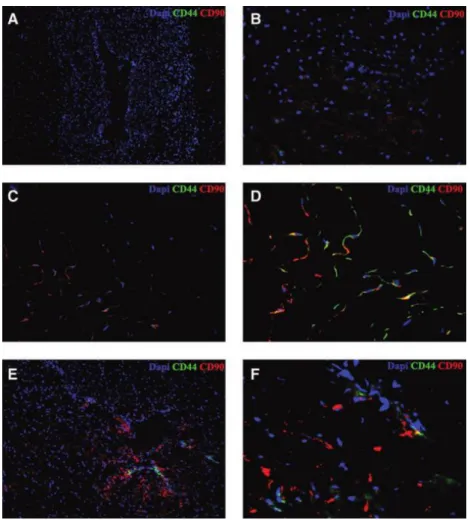
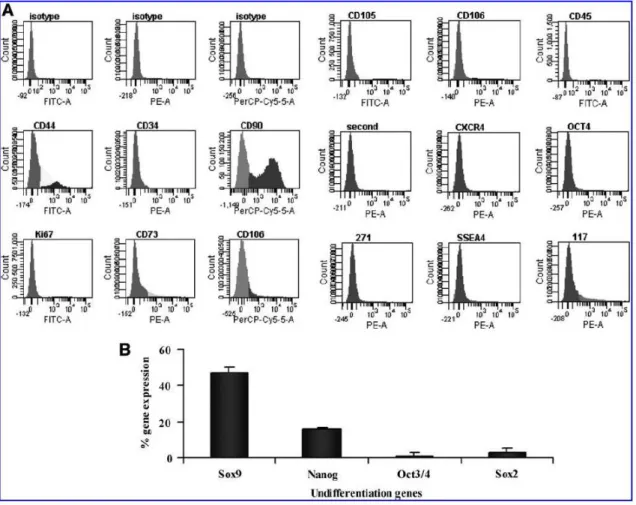
(6) Statistics All experiments were done in triplicate and a representative result is shown. Statistical analyses were performed using the Student’s t-test and analysis of variance using SPSS 16.0. P < 0.05 was considered statistically significant.. Results The expression of the MSC markers CD44 and CD90 was ascertained using immunofluorescence in cryosections of UC tissue, as shown in Fig. 1. Higher concentrations of CD44- and CD90-positive cells were found in the stroma (Fig. 1C, D) of the UC than in the regions around veins (Fig. 1A, B) or arteries (Fig. 1E, F). The colocalization of both antibodies occurred in the same cell (Fig. 1D).. FIG. 1. Detection of the mesenchymal stem cell (MSC) markers, CD44 and CD90, in umbilical cord tissue using immunofluorescence in 7-µm- thick cryosections. (A, B) Negative control. Region surrounding a vein stained with 40 ,6-diamidino-2-phenylindole. (A, 10x; B, 20x). (C, D) Detection of CD44 and CD90 in a region of Wharton’s Jelly. (C, 10x; D, 20x). (E, F) Detection of CD44 and CD90 in a region surrounding an artery (E, 10x; F, 40x).. Characterization of cells Characterization of MSC populations isolated from UCs was made using flow cytometry analysis before differentiation studies to determine their multipotency (Fig. 2A). A high percentage of MSCs were positive for CD90 (>40%), whereas a lower percentage of cells were positive for CD44 (27%), CD105.
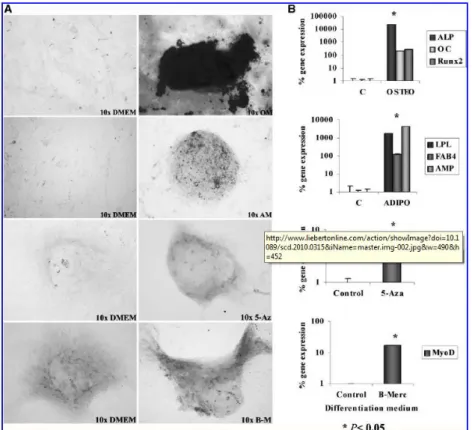
(7) (10%), and CD29 (9%). The remaining tested markers had <10% positive cells, with CD34 and CD45 <1% positive, essentially negative for those markers (Fig. 2A). The multipotency of the MSC population before differentiation was also tested by real-time RT-PCR for expression of the genes SOX9, Nanog, Oct3/4, and SOX2 (Fig. 2B). All measurements were compared with the gene expression of OCT3/4 in the MSC pool, because this gene had the lowest level of expression.. FIG. 2. Characterization of MSCs from umbilical cord stroma. (A) Characterization of MSCs from umbilical cord stroma using flow cytometry. The MSC markers are indicated at the top of each plot, the fluorochrome used is indicated at the bottom of the plot, and the percentage of positive cells for each marker is given in Table 1. (B) Characterization of MSCs by quantitative reverse transcriptase–polymerase chain reaction (RT-PCR). The percentage of gene expression is indicated on the y-axis and the genes are named on the x-axis. The expression of each gene was normalized to that of Oct3/4. FITC-A, fluorescein isotiocyanate A; PE, phycoerythrin; PerCP-Cy5, phycoerythrin Cy5.5. Multipotential capacity of MSCs After 21 days of osteogenesis differentiation, as described earlier, almost 100% of the cells seeded in the wells were positive for Alizarin Red stain (Fig. 3A). The genes OC and Runx2, which are involved in osteogenesis, were highly expressed, achieving levels of 10,000-fold more than the expression of the same genes in the DMEM-cultured control cells (Fig. 3B). After 21 days of adipogenesis differentiation, as described earlier, almost 100% of the seeded cells were positive for Oil Red O stain (Fig. 3A) and the expression of the LPL, FAB4, and AMP genes related to adipogenesis were very high, having levels of 1,000-fold more than the expression of the same genes in the control cells (Fig. 3B). Following ectodermal differentiation in medium with 5- azacitidyne for 21 days, as described earlier, 90% of the cells seeded in the well were positive for C-cadherin human antibody (Fig. 3A). MEF2C gene.
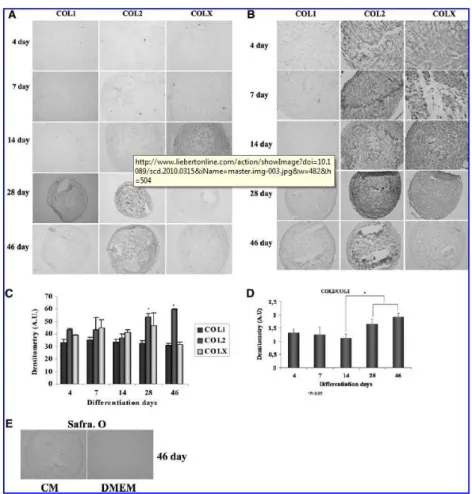
(8) expression related to neuronal differentiation was elevated 10-fold above the expression of the same gene in control cells (Fig. 3B). Subsequent to myogenesis differentiation in medium with β-mercaptoethanol for 21 days, 90% of the cells were positive for Myo D human antibody (Fig. 3A). Myo D gene expression, which is related to myogenesis, was 10-fold more than the expression of this gene in the controls (Fig. 3B).. FIG. 3. Differentiation of MSCs along mesodermal and ectodermal lineages. (A) MSCs from umbilical cord stroma were differentiated toward osteocytes (top panel) and adipocytes (middle upper panel), using commercial media (Cambrex). Some MSCs were also differentiated toward neuronal cells (middle lower panel) using DMEM with 5-azacytidine and other MSCs differentiated toward myocytes (lower panel) using DMEM supplemented with βmercaptoethanol. The cells were cultured for 21 days. Oil Red O and Alizarin Red were used to stain for adipocytes and osteoblasts, respectively. Immunohistochemistry to detect C-cadherin and MyoD were used to verify neurogenesis and myogenesis, respectively (magnification: 10x). (B) Quantitative RT-PCR testing for expression of genes involved in the mesodermal and ectodermal differentiation process. ALP, OC, and Runx2 (top panel) were significantly (P = 0.05) increased in MSCs cultured for 21 days in osteogenic differentiation medium compared with control MSCs cultured in DMEM. LPL, FAB4, and AMP (middle upper panel) were significantly (P = 0.05) expressed in MSCs differentiated for 21 days in adipogenic medium compared with controls. The expressions of MEF2C (middle lower panel) and MyoD (lower panel) were significantly increased (P = 0.05) in MSCs differentiated for 21 days in specific differentiation media, compared with control cells. OM, commercial medium for osteocytes; AM, commercial medium for adipocytes; 5-Az, DMEM plus 5-azacytidine; B-M, DMEM with b-mercaptoethanol; DMEM, Dulbecco’s modified Eagle’s medium. *P < 0.05 by the Student’s ttest. Chondrogenesis study The chondrogenesis study focused on the expression of COL2 and Col1 using immunohistochemistry of sections of spheroids (Fig. 4A, B). Hypertrophy in this particular chondrogenic model was also assessed by immunohistochemistry for COL10 (Fig. 4A, B). Densitometry, using AnalySIS Image Processing, quantified the expression of antibodies obtained using immunohistochemistry (Fig. 4C). The values derived from the control spheroids (Fig. 4A) were used as controls for the densitometry studies (Fig. 4C, D). Specifically, the MSC subpopulation showed a decrease in COL1 staining with time, with a.
(9) significant (P < 0.05) decrease after 14 days in chondrogenic medium; this level of COL1 staining was maintained after 14 days in culture. Staining for COL2 was present in the MSC population cultured in chondrogenic medium at all times points, increasing in intensity to reach peak staining at 28 and 46 days; these levels differed significantly (P < 0.05) from the other times studied. During chondrogenesis, staining for COL10 was maintained at the same level throughout (4–46 days), with no significant differences in its expression (Fig. 4B). The ratio of COL2/COL1 shown in Fig. 4D portrays the chondrogenic process. From day 14 to 46, an increase in the COL2=COL1 ratio was observed during the differentiation process, with the difference being significant (P < 0.05) be- tween day 14 and days 24 and 46 of differentiation.. FIG. 4. Analysis of chondrogenesis in spheroids engineered using MSCs derived from umbilical cord stroma after 4, 7, 14, 28, and 46 days in culture in chondrogenic differentiation media. (A) Immunohistochemistry analysis of control spheroids engineered from MSCs isolated from umbilical cord stroma after culture in control medium (DMEM, 10% knockout serum, 1% penicillin, and 1% streptomycin). (B) Immunohistochemistry analysis of spheroids engineered from MSCs of umbilical cord stroma after culture using a specific chondrogenic differentiation media (DMEM, 15% knockout serum, 5 mg/mL ascorbic acid, 6 µg=mL transferrin, 10 µM dexamethasone, 1x10⁻⁷ M retinoic acid, and 1 ng/mL recombinant human transforming growth factor-β3). (C) Plot representing arbitrary densitometry units for the expression of antibodies for collagen type I (COL1), collagen type II (COL2), and collagen type X (COL10). (D) Plot representing the densitometry study of the ratios of expression of the antibodies for COL1 and COL2 from day 4 to day 46 in culture. (E) Safranin O staining of spheroids engineered from MSCs of umbilical cord stroma after 46 days in culture using a specific chondrogenic differentiation media (on the right) and DMEM (on the left). All figures were at 20x magnification. (C, D) The AnalySIS Image Processing computer program was used to quantify the expression of different antibodies obtained by immunohistochemical analysis. The y-axis shows the mean normalized signal of triplicate spheroids at 4, 7, 14, 28, and 46 days of differentiation in chondrogenic medium. Similar results were obtained from 3 independent experiments. *P < 0.05 by the Student’s t-test..
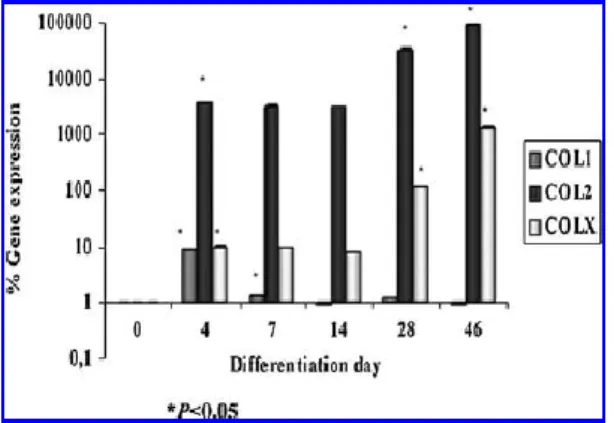
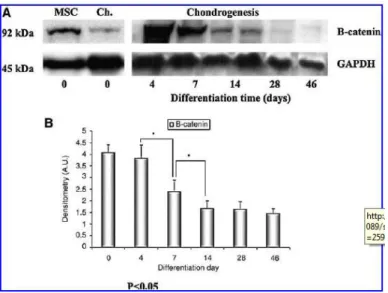
(10) The analysis of chondrogenesis by quantitative RT-PCR of gene expression of COL1, COL2, and COL10 is shown in Fig. 5A. There was a significant increase in COL1, COL2, and COL10 expression after 4 days in chondrogenic medium compared with day 0 (undifferentiated) (P < 0.05). After 7 days in chondrogenic culture, only COL1 expression showed a significant decrease from day 4 (P < 0.05). Significant increases of the expression of COL2 and COL10 were observed at days 28 and 46 compared with previous days (P < 0.05).. FIG. 5. Expression of mRNA during chondrocyte-like cell differentiation in spheroids engineered using MSCs derived from umbilical cord stroma after 4, 7, 14, 28, and 46 days in culture in chondrogenic differentiation medium. Seven spheroids were isolated for nested quantitative RT-PCR. No signal was observed without reverse transcription or when the first 21 cycles were carried out with a primer set for a different gene, indicating that the positive signals originated from the corresponding transcripts. Essentially the same results were obtained from 3 independent experiments. The graph shows the quantification of COL1, COL2, and COL10 mRNA expression, using the software Image Quant 5.0 for PC. The y-axis shows the mean normalized signal of triplicate spheroids at 0, 4, 7, 14, 28, and 46 days in chondrogenic differentiation media. *P < 0.05 by the Student’s t-test. β-Actin was used as housekeeping gene. Wnt pathway during chondrogenesis During chondrogenesis, the differential expression of the main protein of the Wnt signaling pathway, β-catenin, was performed using western blots (Fig. 6). The results revealed that β-catenin expression decreased during chondrogenic differentiation. This decrease was significant between days 4 and 7 (P < 0.05) and between days 7 and 14 (P < 0.05) in chondrogenic medium..
(11) FIG. 6. Wnt signaling during chondrocyte-like cell differentiation in spheroids engineered using MSCs derived from umbilical cord stroma after 4, 7, 14, 28, and 46 days in culture in chondrogenic differentiation media. (A) Western blot detection of β- catenin from the total protein of spheroids formed from MSCs before differentiation (MSC) and from chondrocytes obtained from normal human cartilage used as a positive control (Ch.). (B) The AnalySIS Image Processing pro- gram was used to quantify the expression of β-catenin and GAPDH obtained by western blot. The y-axis shows the mean normalized signal of triplicate spheroids at 4, 7, 14, 28, and 46 days in chondrogenic differentiation medium. Essentially similar same results were obtained from 3 independent experiments. *P < 0.05 by the Student’s t-test. Secretome study during chondrogenesis Secretome analysis using one-dimensional (1D) SDS-PAGE coupled to nanoLC MALDI_TOF/TOF identified a total of 342 proteins at different time points of chondrogenesis by MSCs from human UC stroma. To assess serum contamination from previous media incubations in this study, media collected at 1 h after introducing the spheroid into the well (day 0) was included in this analysis. Only BSA and vimentin were identified at day 0 (data not shown), both with low scores, showing that exhaustive spheroid washing avoids serum contamination. Two hundred nine of the identified proteins were directly linked to extracellular processes and 133 proteins were linked to other cellular processes relating to nuclear and cytoplasm compartments. The percentage of identified proteins involved in the chondrogenesis process constituted 17% of the total proteins detected at 4 days of chondrogenic differentiation; this value increased with further culture in chondrogenic medium: 57.5% at 7 days, 55.17% at 14 days, 62% at 28 days, and 64.9% at 46 days (Fig. 7B). All of the proteins related to the chondrogenic differentiation process are included in Table 2: chitinase-3–like protein, which is a cartilage-specific protein, metalloproteinase inhibitors 1 and 2, which are collagenase inhibitors, fibronectin, which binds cell surfaces, and other proteins including collagen. They were detected at 4 days of differentiation and continued to be detectable throughout the 46 days of chondrogenesis, with one exception. Fibronectin, which is involved in cell adhesion, cell motility, opsonization, wound healing, and maintenance of cell shape, was not found at 46 days of differentiation. There were several other proteins detected in the secretome from the spheroids after 46 days in chondrogenic culture medium, including biglycan, a matrix constituent of the deep zone of cartilage, and stromelysin-1, which degrades fibronectin, laminin, gelatins of type I, III, IV, and V; collagens III, IV, X, and IX, and cartilage proteoglycans. All 342 identified proteins by this method were divided into metabolic process categories using the Pathway Studio 6.0 Software (Ariadne Genomics) and the results are shown in Fig. 7C. Only the percentage of those proteins related to chondrogenesis increased throughout the differentiation process, while the proteins related to cell organization initially increased, then decreased at 28 days of differentiation and increased again at 46 days. The remaining metabolic process categories involved in.
(12) signal transduction, protein synthesis, proteolysis, metabolism, energy production and stress and redox process, essentially maintained the same percentage of proteins throughout the differentiation process.. FIG. 7. Secretome analysis using one-dimensional sodium dodecyl sulfate–polyacrylamide gel electrophoresis coupled to nanoLC MALDI-TOF/TOF of MSCs derived from umbilical cord stroma after 4, 7, 14, 28, and 46 days in culture in chondrogenic differentiation medium. (A) One-dimensional sodium dodecyl sulfate–polyacrylamide gel electrophoresis: the total secreted protein from spheroids formed at 4, 7, 14, 28, and 46 days of chondrogenic differentiation were separated and divided into 16 fractions for digestion with trypsin to enable later separation by nanoLC and identification by MALDI- TOF/TOF. (B) The percentage of secreted proteins involved in chondrogenesis is represented compared with the total secretome during the differentiation process. The numbers at the top of the plot indicate the total proteins identified. (C) The plot represents the percentages of the proteins from the total secretome that are involved in the principal metabolic pathways during the chondrogenic process.. Discussion Human UC cord tissue is an excellent source for noncontroversial stem cells. Schugar et al. demonstrated in situ characterizations identifying and localizing a panel of markers expressed by MSCs, including CD44, CD105, CD73, and CD90 [6]. In our study, immunofluorescence analysis revealed that CD44 and CD90 were present within the same cell, and that these cells possessing both markers were abundant in the stroma of the human UC (Fig. 1) and were maintained during in vitro culture (Fig. 2A). Our populations of MSCs isolated from UC stroma also possessed an abundance of MSC markers in their membranes [6]..
(13) Table 2. Secretome Analysis Using One-Dimensional Sodium Dodecyl Sulfate–Polyacrylamide Gel Electrophoresis Coupled to NanoLC MALDI_TOF/TOF at Different Time Points of Chondrogenesis by Mesenchymal Stem Cells from Human Umbilical Cord Stroma SwissProt accession no.. Day 4 P02751 P01033 P16035 Q15582 P08253 P02452 P08123 P36222 P09486 P07585 P27797 Day 7 P02751 P01033 Q15582 P24821 P13611 P08123 P02452 P09382 P51884 P36222 P02461 P03956 P24821 Day 14 P36222 P02751 P01033 P13611 Q15582 P98160 P08253 P07585 P08123 P23142 P09486 P51884 P12111 P24821 Day 28 P02751 P24821 Q15582 P07585 P08253 P02452 P13611 P23142 P01033 P09486 P51884 Q15063 P36222 P02461 Day 46 P24821 P02452 P08253 P51884 P23142 P03956 Q99715 P08254 Q15582 P36222. ProteinPilot unusued score. % Coverage. Fibronectin Metalloproteinase inhibitor 1 Metalloproteinase inhibitor 2 TGF-β–induced protein ig-h3 72-kDa type IV collagenase Collagen alpha-1(I) chain Collagen alpha-2(I) chain Chitinase-3–like protein 1 SPARC Decorin Calreticulin. 44.58 19 4 10 5.52 17.44 2.72 2.66 2.14 2 2. 24.4 64.3 20 14.5 7.3 44.5 11.3 22.2 9.6 10.6 4.3. Fibronectin Metalloproteinase inhibitor 1 TGF-β–induced protein ig-h3 Tenascin Versican core protein Collagen-alpha-2(I) chain Collagen alpha-1(I) chain Galectin-1 Lumican Chitinase-3–like protein 1 Collagen alpha-1(III) chain Intersticial collagenase Tenascin. 36.39 9.08 2 13.65 34.12 4.21 3.79 2.89 2.1 2.03 2.02 2 13.65. 23.4 48.8 6.4 13.9 15.2 13.5 23.8 22.2 6.5 15.1 15.3 5.8 13.9. Chitinase-3–like protein 1 Fibronectin Metalloproteinase inhibitor 1 Versican core protein TGF-β–induced protein ig-h3 Basement membrane-specific heparin sulfate proteoglycan 72-kDa type IV collagenase Decorin Collagen-alpha-2(I) chain Fibulin SPARC Lumican Collagen-alpha-3(VI) chain Tenascin. 2.03 96.17 2 34.12 16.92 11.39 7.37 6.59 5.59 4.13 2.03 2 2 59.86. 15.1 45.7 20.6 15.2 38.8 18.4 25.3 25.1 28.8 14.9 16.2 9.2 4.8 32.9. Fibronectin Tenascin TGF-β–induced protein ig-h3 Decorin 72-kDa type IV collagenase Collagen-alpha-1(I) chain Versican core protein Fibulin-1 Metalloproteinase inhibitor 1 SPARC Lumican Periostin Chitinase-3–like protein 1 Collagen alpha-1(III) chain. 54.83 54.52 33.1 16.5 12.08 11.47 9.1 6.4 5.7 4.12 4 2.57 2.43 2. 27.3 28 45.4 33.4 33 37.4 7.7 15.1 39.6 16.2 17.8 17.9 25.3 10.1. Tenascin Collagen-alpha-1(I) chain 72-kDa type IV collagenase Lumican Fibulin-1 Intersticial collagenase Collagen alpha-(XII) chain Stromelysin-1 TGF-β–induced protein ig-h3 Chitinase-3–like protein 1. 84 24.92 20 16.09 15.25 12.99 11.26 10.03 10 6.01. 36 59.1 28.6 29.3 20.8 38.6 11.5 24.9 15.52 23.8. Name.
(14) P01033 P14543 P13611 P51884 P09382 P27797 P09486 P24593 P16035 Q12841 P98160 Q15063 P21810 Q07507. Metalloproteinase inhibitor 1 Nidogen-1 Versican core protein Lumican Galectin-1 Calreticulin SPARC Insulin-like growth factor-binding protein 5 Metalloproteinase inhibitor 2 Follistatin-related protein 1 Basement membrane-specific heparan sulfate proteoglycan Periostin Biglycan Dermatopontin. 6 4.01 4.01 4.01 4.01 4 4 4 4 3.71 3.4 2.48 2 2. 20.08 6.6 5.4 20.4 34.8 16.1 13.9 16.9 30.5 18.2 4.1 14 22 14.9. Only those proteins involved in chondrogenesis from the UniProt web database and identified with at least one specific human peptide with confidence >99% were included in the list (unused score = total score = 2).. The multipotency of MSCs from human UC stroma was confirmed by their ability to differentiate into different cell types such as neurons, myocytes, and adipocytes (Fig. 3). Robin et al. [20] found that perivascular cells purified from skeletal muscle and nonmuscle tissues were myogenic in culture and in vivo. Regardless of their tissue origin, long- term cultured perivascular cells retained myogenicity, exhibited osteogenic, chondrogenic, and adipogenic potential, expressed MSC markers, and migrated in a culture model of chemotaxis. The pluripotency of our MSCs was also examined through the expression of genes involved in the undifferentiated stage, such as Nanog, Oct3/4, and SOX2 (Fig. 2B). Bhattacharya et al. [21] indicated that these genes, previously identified as ‘‘stemness’’ genes in undifferentiated human embryonic stem cell lines, slowed down modulation in differentiated cells, whereas the expression of several other genes was induced during cell differentiation. We included SOX9 (Fig. 2B) as an undifferentiated gene because SOX9 is a transcription factor with a high-mobility group DNA-binding domain. SOX9 activates chondrocyte-specific marker genes such as COL2, COL1, and aggrecan and is expressed in all chondroprogenitors and chondrocytes, except for hypertrophic chondrocytes [22]. The expression of SOX9 indicates that our MSCs isolated from UC stroma had chondrogenic potential. Chondrogenic differentiation was achieved following the direct chondrogenic differentiation in vitro protocol developed by our group [14]. We measured the production of specific chondrogenic markers at 4, 7, 14, 28, and 46 days of culture in chondrogenic medium. Immunohistochemistry and quantitative RTPCR analysis measured the expression of COL1, COL2, and COL10 in the spheroid formed during the chondrogenic process. Because spheroids first appear in our model after 2 days in culture in differentiation medium, the measurement of the expression of COL1, COL2, and COL10 in the spheroids was begun at 4 days. We found the expression of COL1, COL2, and COL10 in the spheroids as early as 4 days of chondrogenic differentiation. COL2 and COL10 both increased their expression over time; the expression of COL1 decreased after 4 days of differentiation. Thus, the COL2/COL1 ratio increased over time (Fig. 4D), adding a more consistent assessment of our chondrogenic model. Our differentiation protocol has similarities to that of Johnstone et al., published in 1998, for the development of an in vitro cartilage model based on micromass culture [23]. Penolazi et al. [24] found that the osteoblastic potential of UC MSCs was not influenced by the baby’s gender or mode of delivery. However, the highest degree of osteoblastic potential has been shown by MSCs, with high basal levels of RUNX-2 isolated from UCs from the heaviest full-term babies [24]. MSCs isolated from UCs represent a promising source for the repair of hard tissue such as cartilaginous tissues. Im et al. [25] tested the hypothesis that the inhibition of the Wnt pathway promotes chondrogenesis by human MSCs. They concluded that, for early chondrogenesis, both Dickkopf- related protein 1 and secreted frizzled-related protein 1 (sFRP-1) increased glycosaminoglycan synthesis, as well as the gene and protein expressions of SOX9 and COL2, more prominently by sFRP-1 than by Dickkopfrelated protein 1. However, after 21 days of in vitro chondrogenic culture with TGF-b3, sFRP-1 treatment did not further increase the gene expression of SOX9 and COL2. The overall results of this study suggest that, although the inhibitors of the Wnt pathway promote early chondrogenesis from MSCs, they do not ultimately enhance cartilage tissue engineering from MSCs. Our results indicate that β-catenin expression decreases during chondrogenic differentiation, adding new information about its role in mammalian cell chondrogenesis in concordance with Liu et al. [11]. They described that the inhibition of Wnt signaling was necessary during the early stages of mammalian chondrogenesis and described for the first time that β-catenin is found at low values in the cells during the chondrogenesis process. This finding adds a new role for Wnt signaling during the mammalian chondrogenesis process..
(15) Stem cells have been widely studied for their suitability for use in tissue repair therapies. However, differences in function and differentiation potential exist between distinct stem cell populations. Whether those differences are due to donor variation, cell culture, or an intrinsic property remains elusive. The existence of these differences, however, indicates a need for effective differentiation protocols tailored to each stem cell type [26]. Our in vitro chondrogenic model was also validated by mass spectrometry; we were able to identify typical cartilage proteins secreted during the differentiation process with the chondrogenic medium, but not with the DMEM, in which no expression of COL2 was seen in the spheroid. To our knowledge, this is the first time that 1D-SDS-PAGE coupled to nanoLC MALDI-TOF/TOF has been used to analyze the secretome of MSCs isolated from human UC cord stroma. This qualitative technique is suitable for analyzing complex samples such as secretomes. We found that the majority of proteins secreted during the differentiation process were involved in chondrogenesis. Chondrogenic differentiation resulting from spheroid formation is an excellent method for obtaining chondrocyte-like cells from MSCs derived from human UC stromal tissue. Some of these proteins at 4 days of differentiation culture include Decorin, which binds to COL1 and 2, fibronectin, and TGF-β, forms a ternary complex with microfibrillarassociated protein 2 and elastin, and interacts with dermatopontin; and Calreticulin, which increases cell proliferation. Some of these proteins at 7 days of differentiation culture include Lumican, which is located in the extracellular matrix (ECM) of human articular cartilage at all ages, although its abundance is far greater in the adult; and Galectin-1, which regulates apoptosis, cell proliferation, and cell differentiation, binds β-galactoside and an array of complex carbohydrates, and inhibits CD45 protein phosphatase activity and, therefore, the dephosphorylation of Lyn kinase. At 14 days of differentiation we found Fibulin, which may play a role in cell adhesion and migration along protein fibers within the ECM and could be important in certain developmental processes as well as contribute to the supramolecular organization of ECM architecture, particularly to those of basement membranes; Decorin; and Lumican. Proteins seen at 28 days were Periostin, which induces cell attachment and spreading, plays a role in cell adhesion, and may play a role in ECM mineralization; Decorin; Lumican; and Chitinase. At 46 days we found Dermatopontin, which enhances TGF-β1 activity and inhibits cell proliferation, accelerates collagen fibril formation, and stabilizes collagen fibrils against low-temperature dissociation; and Nidogen-1, which is widely distributed in basement mem- branes and tightly associated with laminin, COL4, and perlecan. Nidogen-1 has a role in cell–ECM interactions. Several types of collagens were also found by MS, although we found no COL2, the one collagen specific to cartilage tissue. This could be because all the identified peptides are C- terminal peptides, which has very high homology among the different collagens. The N-terminal part of the protein is more specific for each collagen type, but identification of N-terminal peptides using MS is challenging because of inherent limitations of the technique. Through 1D-SDS-PAGE coupled to nanoLC MALDI-TOF/TOF used to analyze the secretome during the chondrogenic process, several glycos-aminoglycans were found, including fibronectin, which was present in the chondrogenic process from day 4 through 46, tenascin, present in the chondrogenic process from day 7 through 46, and basement membrane-specific heparan sulfate proteoglycan, present in the chondrogenic process from day 14 through 46. Chitinase-3–like protein 1, a cartilage- specific protein that was found in our model throughout differentiation time, demonstrated the efficacy of our model. Hayes et al. [27] described biglycan and decorin as matrix constituents of cartilage; their presence further corroborates our results. Our model of chondrogenesis is a dynamic model where we found proteins that degrade collagen, such as stromelysin-1, at the end of our differentiation culture. All these findings demonstrate that MSCs from UC stroma are multipotent cells able to differentiate into mesodermal and ectodermal lineages. The defined chondrogenic medium and the spheroid model are useful to obtain chondrocyte-like MSCs from the UC stroma. Various techniques, including immunohistochemistry, RT-PCR, and 1D-SDS-PAGE coupled to nanoLC MALDI-TOF/TOF, yielded evidence of protein and gene expressions characteristic of native cartilage.. Acknowledgments The authors thank Mrs. María José Sánchez Dopico and Mrs. Purificación Filgueira Fernández for technical assistance and Esther Rendal for supplying the UC stroma. This work was supported by SERGAS PS07=86. Author Disclosure Statement The authors declare that they have no competing interests..
(16) References 1. Friedenstein AJ, RK Chailakhjan and KS Lalykina. (1970). The development of fibroblast colonies in monolayer cul- tures of guinea-pig bone marrow and spleen cells. Cell Tissue Kinet 3:393–403. 2. Oh W, DS Kim, YS Yang and JK Lee. (2008). Immunological properties of umbilical cord blood-derived mesenchymal stromal cells. Cell Immunol 251:116–123. 3. Zheng C, S Yang, Z Guo, W Liao, L Zhang, R Yang and ZC Han. (2009). Human multipotent mesenchymal stromal cells from fetal lung expressing pluripotent markers and differentiating into cell types of three germ layers. Cell Transplant 18:1093–1109. 4. Crisan M, S Yap, L Casteilla, CW Chen, M Corselli, TS Park, G Andriolo, B Sun, B Zheng, L Zhang, C Norotte, PN Teng, J Traas, R Schugar, BM Deasy, S Badylak, HJ Buhring, JP Giacobino, L Lazzari, J Huard and B Peault. (2008). A perivascular origin for mesenchymal stem cells in multiple human organs. Cell Stem Cell 3:301–313. 5. Majore I, P Moretti, R Hass and C Kasper. (2009). Identification of subpopulations in mesenchymal stem cell-like cultures from human umbilical cord. Cell Commun Signal 7:6. 6. Schugar RC, SM Chirieleison, KE Wescoe, BT Schmidt, Y Askew, JJ Nance, JM Evron, B Peault and BM Deasy. (2009). High harvest yield, high expansion, and phenotype stability of CD146 mesenchymal stromal cells from whole primitive human umbilical cord tissue. J Biomed Biotechnol 2009: 789526. 7. Kita K, GG Gauglitz, TT Phan, DN Herndon and MG Jeschke. (2010). Isolation and characterization of mesenchymal stem cells from the sub-amniotic human umbilical cord lining membrane. Stem Cells Dev 19:491– 502. 8. Sarugaser R, D Lickorish, D Baksh, MM Hosseini and JE Davies. (2005). Human umbilical cord perivascular (HUCPV) cells: a source of mesenchymal progenitors. Stem Cells 23: 220–229. 9. Day TF, X Guo, L Garrett-Beal and Y Yang. (2005). Wnt/beta-catenin signaling in mesenchymal progenitors controls osteoblast and chondrocyte differentiation during vertebrate skeletogenesis. Dev Cell 8:739–750. 10. Tamamura Y, T Otani, N Kanatani, E Koyama, J Kitagaki, T Komori, Y Yamada, F Costantini, S Wakisaka, M Pacifici, M Iwamoto and M Enomoto-Iwamoto. (2005). Developmental regulation of Wnt/beta-catenin signals is required for growth plate assembly, cartilage integrity, and endochondral ossification. J Biol Chem 280:19185– 19195. 11. Liu F, S Kohlmeier and CY Wang. (2008). Wnt signaling and skeletal development. Cell Signal 20:999–1009. 12. Chun JS, H Oh, S Yang and M Park. (2008). Wnt signaling in cartilage development and degeneration. BMB Rep 41:485–494. 13. Lee SJ, HB Jeon, JH Lee, JS Yoo, JS Chun and YJ Yoo. (2004). Identification of proteins differentially expressed during chondrogenesis of mesenchymal cells. FEBS Lett 563:35–40. 14. Arufe MC, A De la Fuente, I Fuentes-Boquete, FJ De Toro and FJ Blanco. (2009). Differentiation of synovial CD-105(þ) human mesenchymal stem cells into chondrocyte-like cells through spheroid formation. J Cell Biochem 108:145–155. 15. Messina E, L De Angelis, G Frati, S Morrone, S Chimenti, F Fiordaliso, M Salio, M Battaglia, MV Latronico, M Coletta, E Vivarelli, L Frati, G Cossu and A Giacomello. (2004). Isolation and expansion of adult cardiac stem cells from human and murine heart. Circ Res 95:911–921. 16. Roura S, J Farre, C Soler-Botija, A Llach, L Hove-Madsen, JJ Cairo, F Godia, J Cinca and A Bayes-Genis. (2006). Effect of aging on the pluripotential capacity of human CD105+ mesenchymal stem cells. Eur J Heart Fail 8:555–563. 17. Kang SM, MS Cho, H Seo, CJ Yoon, SK Oh, YM Choi and DW Kim. (2007). Efficient induction of oligodendrocytes from human embryonic stem cells. Stem Cells 25:419–424. 18. Livak KJ and TD Schmittgen. (2001). Analysis of relative gene expression data using real-time quantitative PCR and the 2(-Delta Delta C(T)) method. Methods 25:402–408. 19. Matsushime H, DE Quelle, SA Shurtleff, M Shibuya, CJ Sherr and JY Kato. (1994). D-type cyclin-dependent kinase activity in mammalian cells. Mol Cell Biol 14:2066–2076. 20. Robin C, K Bollerot, S Mendes, E Haak, M Crisan, F Cerisoli, I Lauw, P Kaimakis, R Jorna, M Vermeulen, M Kayser, R van der Linden, P Imanirad, M Verstegen, H Nawaz-Yousaf, N Papazian, E Steegers, T Cupedo and E Dzierzak. (2009). Human placenta is a potent hematopoietic niche containing hematopoietic stem and progenitor cells throughout development. Cell Stem Cell 5:385–395. 21. Bhattacharya B, J Cai, Y Luo, T Miura, J Mejido, SN Brimble, X Zeng, TC Schulz, MS Rao and RK Puri. (2005). Comparison of the gene expression profile of undifferentiated human embryonic stem cell lines and differentiating embryoid bodies. BMC Dev Biol 5:22. 22. Akiyama H, JE Kim, K Nakashima, G Balmes, N Iwai, JM Deng, Z Zhang, JF Martin, RR Behringer, T Nakamura and B de Crombrugghe. (2005). Osteo-chondroprogenitor cells are derived from Sox9 expressing precursors. Proc Natl Acad Sci USA 102:14665–14670. 23. Johnstone B, TM Hering, AI Caplan, VM Goldberg and JU Yoo. (1998). In vitro chondrogenesis of bone marrow- derived mesenchymal progenitor cells. Exp Cell Res 238:265–272. 24. Penolazzi L, R Vecchiatini, S Bignardi, E Lambertini, E Torreggiani, A Canella, T Franceschetti, G Calura, F Vesce and R Piva. (2009). Influence of obstetric factors on osteogenic potential of umbilical cord-derived mesenchymal stem cells. Reprod Biol Endocrinol 7:106. 25. Im GI, JH Ahn, SY Kim, BS Choi and SW Lee. (2010). A hyaluronate-atelocollagen/beta-tricalcium phosphatehydroxyapatite biphasic scaffold for the repair of osteochondral defects: a porcine study. Tissue Eng Part A 16:1189–1200..
(17) 26. Jansen BJ, C Gilissen, H Roelofs, A Schaap-Oziemlak, J Veltman, RA Raymakers, J Jansen, G Kogler, CG Figdor, R Torensma and GJ Adema. (2010). Functional differences between mesenchymal stem cell populations are reflected by their transcriptome. Stem Cells Dev 19:481–490. 27. Hayes AJ, A Hall, L Brown, R Tubo and B Caterson. (2007). Macromolecular organization and in vitro growth characteristics of scaffold-free neocartilage grafts. J Histochem Cytochem 55:853–866.
(18)
Figure
+6


Documento similar