Analyzing how emotion awareness influences students' motivation, engagement, self regulation and learning outcome
18
0
0
Texto completo
(2) to acquire or invent new thoughts or beliefs, or to modify existing beliefs, in order to reduce the amount of dissonance (conflict) between cognitions (Aïmer, 1998; Lee et al., 2003). According to Piaget’s theory (1967; 1980), when a child recognizes cognitive conflict (disequilibrium), this recognition motivates him or her to attempt to resolve the conflict and thus change his/her cognition, attitude, or behavior. Piaget called the process of resolving conflict “equilibration.” According to him, equilibration refers to the process of self-regulation that maintains a balance between “assimilation” and “accommodation.” Several educational interventions have been designed to foster dissonance in students by increasing their awareness of conflicts between prior beliefs and new information (e.g., by requiring students to defend prior beliefs) (Guzzetti et al., 1993). Moreover, according to Aronson (1995) and Graesser et al., (1996), creating and resolving cognitive dissonance can have a powerful impact on students’ motivation for learning. In our case-study, we use cognitive dissonance to increase motivation for learning as well as foster students’ inner self-regulation. Among collaborative learning strategies, Jigsaw is a popular and extensively used strategy in which the members of the class are organized into “jigsaw” groups (Aronson & Patnoe, 2011; Perkins & Saris, 2001; Bratt, 2008). Students are then reorganized into “expert” groups containing one member from each jigsaw group. The members of the expert group work together to learn the material or solve the problem, then return to their “jigsaw” groups to share their learning. This process helps students improve their listening, communication, and problem-solving skills. In addition, the teacher’s role in the jigsaw is to facilitate learning and support students by encouraging them to help each other and to ensure that everyone in their group understands the material and will be confident presenting it to his/her group. Jigsaw strategy is an efficient way for students to become engaged in their learning, be individually accountable for their learning and achieve more self-regulation in their performance (DiDonato, 2013). This strategy maximizes interaction and establishes an atmosphere of cooperation and respect for other students. Regarding emotion awareness, the main objectives of emotional education can be summarized as: gaining a better understanding of emotions and identifying the emotions of others (Pekrun, 2005); developing the ability to identify and control our own emotions (Goleman, 1995; Kort & Reilly, 2002); developing the ability to self-motivate and change negative emotions into positive (Gardner, 2006); and, managing conflict in a positive way (D’Mello et al., 2007; Baker et al., 2007). Consequently, the ability of students to perceive emotion was positively related to peer bonding (Han & Johnson, 2012), whereas empathy with the learner’s emotion would increase their motivation in learning (Pérez-Marín & Pascual-Nieto, 2013). Based on emotion awareness information, the teacher can provide affective feedback ensuring in that way students’ emotional safety and their engagement or persistence in the learning experience (Feidakis et al., 2014). An adequate (timely, situation-aware and personal) affective feedback can cause a change in the students’ emotional state, which can redirect their focus of attention and can induce a change in the way they think, act and interact with others, as well as it can regulate their behavior in a learning situation (Shen et al., 2009; Bahreini et al., 2012). In this sense, it is also important to know the emotional competencies that teachers should have in order to provide the most adequate affective feedback to their students (Jennings, 2011). There are also specific types of affective feedback that use emotional reactions, such as applause, to reduce negative emotional states especially in male university students in specific educational situations such as computerized self-assessment testing (Liu et al., 2015). In the recent years, research in emotion awareness in learning situations has focused on several issues that include: capturing the sentiments and the emotional states enclosed in textual information so that opinions and emotions embedded in them could play a key role in decision-making processes (Loia & Senatore, 2014); examining the impact of the so-called academic emotions (enjoyment, anxiety, pride, anger, hope, shame/fault, relief, boredom, hopelessness) on students’ ways of thinking and information processing (Pekrun et al., 2011); embedding emotion awareness into e-learning environments “ecologically,” by avoiding introducing obtrusiveness or invasiveness in the learning process (Feidakis et al., 2014); identifying patterns of emotional behavior by observing motor-behavioral activity (facial expressions, voice intonation, mouse movements, log files, sentiment analysis, etc.) (Heylen et al., 2005; Davis et al., 2008); using affect grid to measure emotions in software requirements engineering (ColomoPalacios et al., 2011); studying motivation in work environments in the IT field (Sinha et al., 2014). As discussed above, previous literature emphasizes the need of both emotion awareness and teacher’s affective feedback as two important elements in students’ learning process. However, there is not yet an extensive analysis of the relationship between emotion awareness and students’ motivation, engagement, self-regulation and learning outcome as well as emotion awareness and teacher’s attitude and feedback. The significance of this study is to bridge 88.
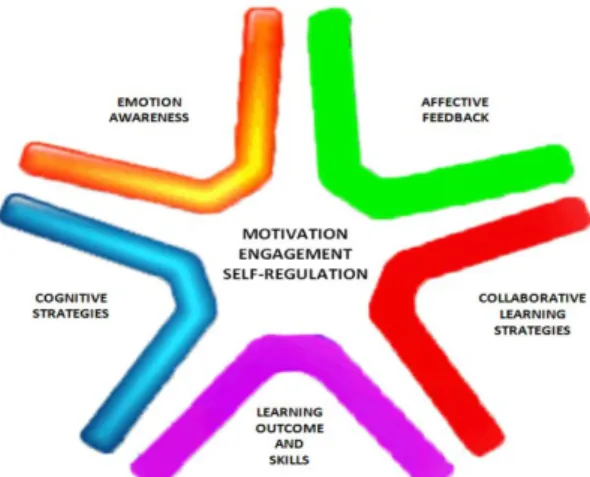
(3) this gap and provide a detailed analysis on the way emotion awareness affects students’ motivation, engagement, self-regulation and learning outcome if it is coupled with cognitive and collaborative learning strategies (such as cognitive dissonance and Jigsaw strategy respectively) which play an important role in reinforcing students’ motivation for learning, engagement and self-regulation. So far, no other study has conducted such an integrated analysis of all these key factors that lead to effective learning outcome and skills, as it is depicted in Figure 1. To this end, we first set our research goal, hypothesis and questions. Then, we present our case study description, and we explain how we address these questions through a real experiment with high school students. Next, we present the results of the experiment, we discuss the obtained results concerning the research questions set and we check the validity of our research hypothesis. Finally, we provide our conclusions with suggestions for future research.. Research hypothesis and aims Goal: The main goal of this work is to analyze the effects of emotion awareness on students’ motivation, engagement, self-regulation and learning outcome in long-term blended collaborative learning practices. A bilateral goal also involves an initial study that explores the way emotion awareness affects teacher’s attitude and feedback as well as the competencies that teachers need to have in order to achieve a positive change on students’ affective and cognitive state. Hypothesis: “Increasing the emotion awareness of learners, their learning outcomes improve in relation to their motivation, engagement and self-regulation. Besides, by increasing the emotion awareness of teachers, their attitude and feedback become more effective and timely.” Independent Variable:. X = emotion awareness. Dependent Variables:. Y = students’ motivation in learning Z = students’ engagement in learning H = students’ self-regulation J = learning outcome K = affective feedback. Research questions (1) Is there a significant correlation between students’ emotion awareness and their motivation and engagement in learning? (2) Is there any significant correlation between students’ emotion awareness and their self-regulation and learning outcome? (3) Is there any significant correlation between teacher’s awareness about students’ emotions and his/her attitude and feedback?. Methodology Case study description In this work, we were based on an emotion analysis model (Arguedas & Daradoumis, 2013) that integrates the four concepts mentioned before, that is, emotion awareness, affective feedback, cognitive strategies and collaborative learning strategies within an Activity Theory Framework (Engeström et al., 1999). This framework describes a problem based learning scenario where participants interact with learning objects by means of a specific cognitive strategy, such as cognitive dissonance, and a specific collaborative learning strategy, such as Jigsaw, in order to carry out goal-oriented activities. In parallel, we also employed a discourse analysis method, based on the work of Arguedas et al. (2014), to analyze text and conversation generated by students collaboratively in order to identify and represent the students’ emotions that take place during these activities in a non-intrusive way. This information is shown to both teacher and students. This provides the teacher with the necessary emotion awareness in regard of the way students’ emotions appear and evolve over time, which enables him/her to offer students cognitive and affective feedback. 89.
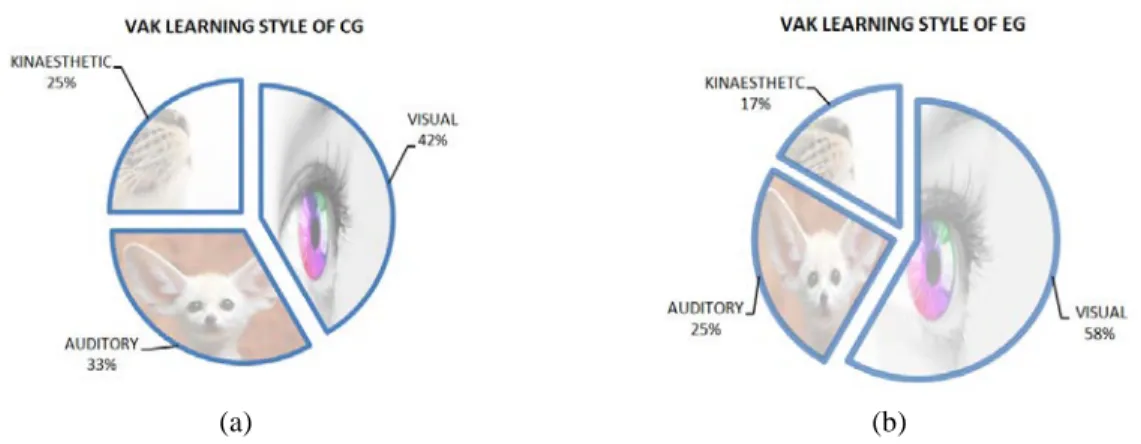
(4) Participants This experiment was carried out with a class of twenty-four fourth-year high school students, taking an introductory Computer Science course, using the Moodle platform. We divided students in six groups of 4 members and we chose three of these groups as the experimental group (EG) and the rest as the control group (CG). All students worked in a collaborative activity based on the Jigsaw strategy for 15 class sessions (5 weeks). All students (18 girls (75%) and 6 boys (25%)) had the same characteristics and background, and the election of CG and EG was done completely randomly. Students in the EG were informed for the emotions they experimented during the activity, so they were emotion aware all the time. In contrast, students in the CG had not any emotion awareness facilities. At course presentation, all students were informed of their preferred learning style and their emotional intelligence level by having them take specific tests at the beginning of the activity. At the beginning of the activity, to acquire students’ learning styles, students answered a questionnaire based on VAK Learning Styles’ Questionnaire of Lynn O’Brien (1990). In addition, to measure the initial level of students’ emotional intelligence we used a questionnaire based on PEYDE’s Questionnaire (Gallego & Gallego, 2004). As regards students’ learning styles, in the EG, 58% of them were visual, 25% auditory and 17% kinesthetic (Figure 2 (b)), whereas in the CG, 42% of the students were visual, 33% auditory and 25% kinesthetic as shown in Figure 2 (a).. (a) (b) Figure 2. Graphical representation of students’ VAK Learning Style in (a) CG and (b) EG. (a) (b) Figure 3. Graphical representation of students’ Emotional Intelligent Levels in (a) CG and (b) EG Towards the levels of students’ emotional intelligence, in the EG the results were a 60.42% in Problem Solving Ability, 60.21% in Relationship Ability, 61.04% in Empathy, 59.79% in Emotional Control and 61.88% in Emotional Awareness (Figure 3 (b)). While in the CG, the results were a 60.00% in Problem Solving Ability, 60.00% in Relationship Ability, 61.46% in Empathy, 62.08% in Emotional Control and 61.67% in Emotional Awareness as shown in Figure 3 (a).. 90.
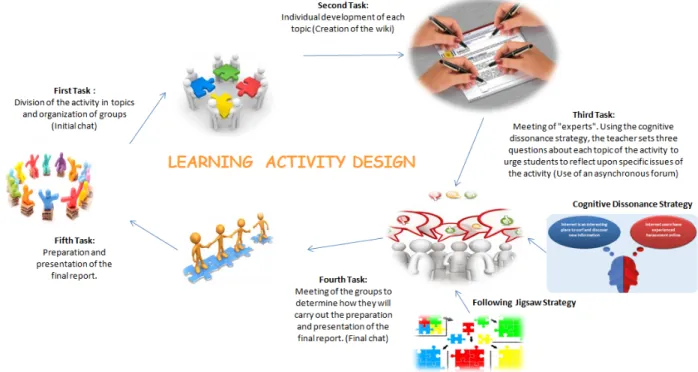
(5) Procedure and data collection The scenario included a collaborative learning activity which was implemented following the Problem-Based Learning method and the Jigsaw collaborative strategy. The topic of the activity was “Introduction to Internet” and it was carried out in the Moodle environment. Based on the Jigsaw collaborative strategy, the learning activity was divided in ten stages which in turn were grouped around five tasks to facilitate their implementation as shown in Figure 4. For each task, the teacher provided all the necessary resources (documents and tools). Data was collected in the texts and dialogues produced by students during their group work. The teacher guided and gave support to the learning activity, by providing appropriate affective and cognitive feedback and encouraged the students to participate actively in building their knowledge.. Figure 4. Tasks of the learning activity design To extract emotions from discourse created by students in virtual spaces (Wiki, chats and forum debates), we first used a sentiment analysis tool developed by Jurado and Rodriguez (2015). Then, we applied an extension of the Rhetorical Structure Theory (RST) tool (Arguedas et al., 2014) in order to obtain a graphical representation of the emotional structure of discourse. Through this, we managed to provide both teacher and students with means to be aware of the students’ emotions and their evolution over time in a non-intrusive way. In the end of the learning activity, we used a questionnaire that has been designed with both open-ended and closed-ended questions, taking our research hypothesis and questions into account. More specifically, discourse (text and conversation) has been divided into segments which were analyzed in order to discover and show all the emotions that appear in them. With regard to Wiki text, division was carried out according to the intentional structure of the text (Grosz & Sidner, 1986); that is, each segment conveys a specific goal which is the result of the contribution issued by each group member. In regard of dialogue, divisions were carried out at two levels, first at the exchange level and then at the move level inside each exchange. Doing so, we created a clear association between the intentional and the emotional structure of discourse in both modes (text and dialogue). All segments were numbered sequentially and we refer to them as units of analysis. Both Wiki text and conversation were analyzed segment by segment by applying first Sentiment Analysis and then the extended RST. The obtained outcomes are displayed graphically, as shown in an example of a Wiki text in Figures 5 and 6.. 91.
(6) Figure 5. Text of wiki. 92.
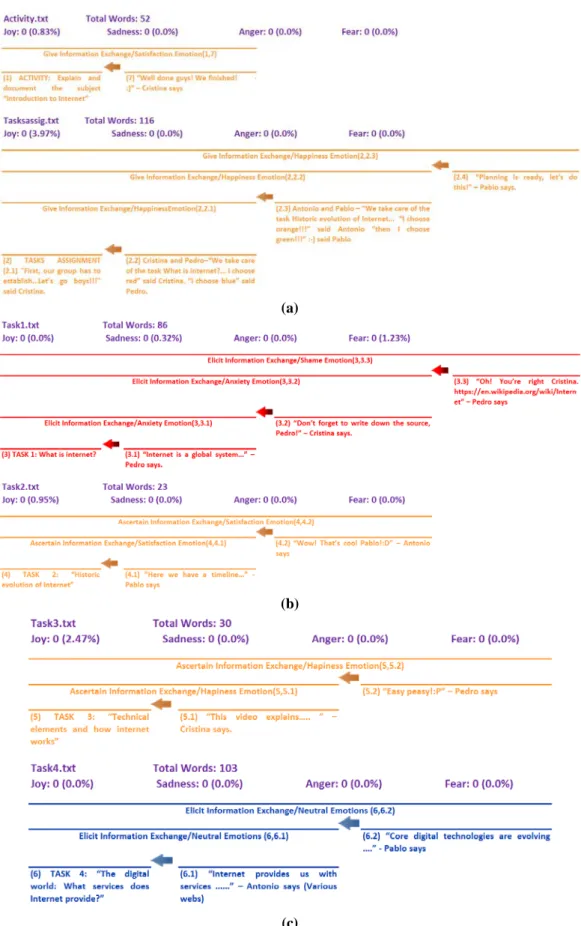
(7) (a). (b). (c) Figure 6. Emotions detected in the text (wiki) and graphical representation of the emotional structure of the text (wiki). 93.
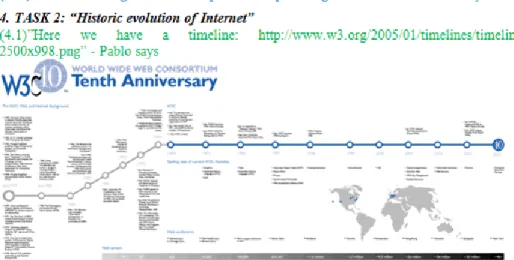
(8) Let’s explain both Figures in more detail. Initially, a “give-information” exchange is initiated by move 1 and presents the activity topic. This exchange can be considered as successfully completed only when a final supporting move (move 7) is provided at the end. In this exchange, the predominant emotion is joy (happiness/satisfaction). In order to implement the activity, in segment 2, a group member (Cristina) initiates a “give-information” exchange with move 2.1 in which she explains how the task topics will be assigned and organized within the group. The exchange is completed by three consequent supporting moves (2.2, 2.3 and 2.4) contributed by the other group members. Here again, the predominant emotion is joy (happiness/satisfaction). Next, each pair of students works on its task. The first task is initiated through a question in segment 3 in the form of an “elicit-information” exchange. This exchange is completed by three supporting moves (3.1, 3.2 and 3.3), contributed by both members of the pair. Here, the predominant emotion is anxiety expressed by one of the members (move 3.2), followed by shame expressed by the other member (in the beginning of move 3.3). The second task is set up as a problem in segment 4 in the form of an “ascertain-information” exchange and is resolved by one of the members of the pair (move 4.1), whereas the other member (move 4.2) confirms the given solution. Here, the predominant emotion is joy (happiness/ satisfaction). Task 3 is again set as a problem (“ascertain-information” exchange) in segment 5 and is resolved as before (through moves 5.1 and 5.2). Here again, the predominant emotion is joy (happiness/satisfaction). Finally, task 4 is presented as a question in segment 6 in the form of an “elicit-information” exchange. Here, both members of the pair provide complementary answers (moves 6.1 and 6.2) which complete the exchange goal successfully. In this case, no obvious emotions are expressed by either member; so, their emotional behavior here is characterized as neutral.. Data analysis Our goal was to obtain both quantitative and qualitative data in order to measure and evaluate learners’ emotional state concerning the following units of analysis: • Emotion Awareness (EA) • Affective Feedback (AF) As regards EA, the questionnaire was composed of four questions that included 16 items classified into four categories, using a five-point Likert-type scale ranging from 1 (Almost never) to 5 (Almost always) and two openended questions requiring qualitative answer. As concerns AF, the questionnaire was composed of two questions that included 5 items, using a five-point Likert-type scale ranging from 1 (Almost never) to 5 (Almost always) and one open-ended question requiring qualitative answer. All the questionnaire items are shown in Figure 7.. Figure 7. The questionnaire items 94.
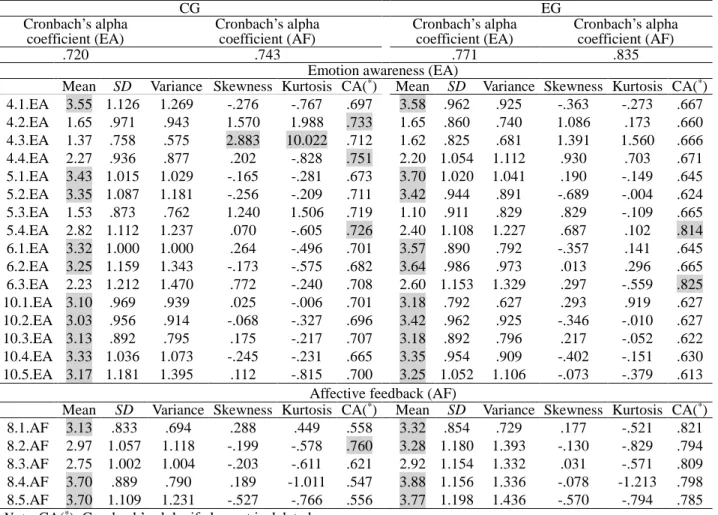
(9) Regarding the statistical techniques employed in the analysis of the questionnaire data, we used descriptive statistics, calculating relative frequencies (%), as well as graphics to represent reality objectively. We also used bivariate correlation and analysis of variance to find relationships between the variables under study for each of the questions of our study.. Results Reliability statistics To ensure the reliability of data collection, we applied the Cronbach’s alpha coefficient as well as the skewness and kurtosis for each variable that was examined in order to check for multivariate normality. In this sense, the absolute values of skewness and the absolute values of kurtosis did not exceed a univariate skewness of 2.0 and a univariate of kurtosis of 7.0; as such, we assumed that there was no critical problem regarding multivariate normality. Finally, the results of descriptive statistics obtained are shown in Table 1. Cronbach’s alpha is considered to be a coefficient of reliability (or consistency). A reliability coefficient of .70 or higher is considered “acceptable” in most social science research situations. All values of Cronbach’s alpha in Table 1 are higher than .70, which reinforces the reliability of our test scores. Table 1. The Cronbach’s alpha coefficient and descriptive statistics of EA and AF, in CG and EG CG EG Cronbach’s alpha Cronbach’s alpha Cronbach’s alpha Cronbach’s alpha coefficient (EA) coefficient (AF) coefficient (EA) coefficient (AF) .720 .743 .771 .835 Emotion awareness (EA) Mean SD Variance Skewness Kurtosis CA(*) Mean SD Variance Skewness Kurtosis CA(*) 4.1.EA 3.55 1.126 1.269 -.276 -.767 .697 3.58 .962 .925 -.363 -.273 .667 4.2.EA 1.65 .971 .943 1.570 1.988 .733 1.65 .860 .740 1.086 .173 .660 4.3.EA 1.37 .758 .575 2.883 10.022 .712 1.62 .825 .681 1.391 1.560 .666 4.4.EA 2.27 .936 .877 .202 -.828 .751 2.20 1.054 1.112 .930 .703 .671 5.1.EA 3.43 1.015 1.029 -.165 -.281 .673 3.70 1.020 1.041 .190 -.149 .645 5.2.EA 3.35 1.087 1.181 -.256 -.209 .711 3.42 .944 .891 -.689 -.004 .624 5.3.EA 1.53 .873 .762 1.240 1.506 .719 1.10 .911 .829 .829 -.109 .665 5.4.EA 2.82 1.112 1.237 .070 -.605 .726 2.40 1.108 1.227 .687 .102 .814 6.1.EA 3.32 1.000 1.000 .264 -.496 .701 3.57 .890 .792 -.357 .141 .645 6.2.EA 3.25 1.159 1.343 -.173 -.575 .682 3.64 .986 .973 .013 .296 .665 6.3.EA 2.23 1.212 1.470 .772 -.240 .708 2.60 1.153 1.329 .297 -.559 .825 10.1.EA 3.10 .969 .939 .025 -.006 .701 3.18 .792 .627 .293 .919 .627 10.2.EA 3.03 .956 .914 -.068 -.327 .696 3.42 .962 .925 -.346 -.010 .627 10.3.EA 3.13 .892 .795 .175 -.217 .707 3.18 .892 .796 .217 -.052 .622 10.4.EA 3.33 1.036 1.073 -.245 -.231 .665 3.35 .954 .909 -.402 -.151 .630 10.5.EA 3.17 1.181 1.395 .112 -.815 .700 3.25 1.052 1.106 -.073 -.379 .613 Affective feedback (AF) Mean SD Variance Skewness Kurtosis CA(*) Mean SD Variance Skewness Kurtosis CA(*) 8.1.AF 3.13 .833 .694 .288 .449 .558 3.32 .854 .729 .177 -.521 .821 8.2.AF 2.97 1.057 1.118 -.199 -.578 .760 3.28 1.180 1.393 -.130 -.829 .794 8.3.AF 2.75 1.002 1.004 -.203 -.611 .621 2.92 1.154 1.332 .031 -.571 .809 8.4.AF 3.70 .889 .790 .189 -1.011 .547 3.88 1.156 1.336 -.078 -1.213 .798 8.5.AF 3.70 1.109 1.231 -.527 -.766 .556 3.77 1.198 1.436 -.570 -.794 .785 Note. CA(*): Cronbach’s alpha if element is deleted. The values obtained from the descriptive statistics performed are described as follows: With regard to Emotion Awareness (EA): 95.
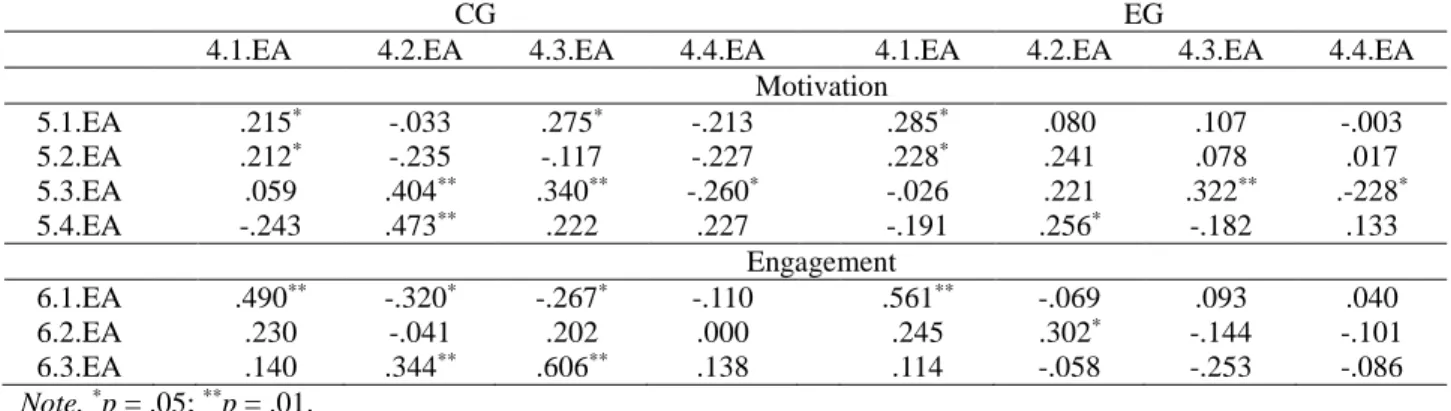
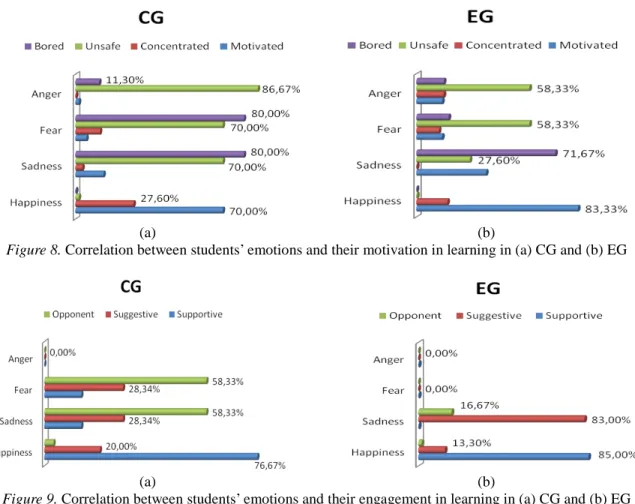
(10) • • • • •. Students’ Emotions (4.1.EA – 4.4.EA): The mean exceeded the value of three (3.0) in the items 4.1.EA (Happiness/Satisfaction), obtaining the values 3.55 in the CG and 3.58 in the EG. Students’ Mental States (Motivation) (5.1.EA - 5.4.EA): The mean exceeded the value of three (3.0) in the following items: 5.1.EA.-Motivation (CG 3.43 – EG 3.70) and 5.2.EA.-Concentration (CG 3.35 – EG 3.42). Students’ Behaviors (Engagement) (6.1.EA – 6.3.EA): The mean exceeded the value of three (3.0) in the following items: 6.1.EA-Solidarity (CG 3.32 – EG 3.57) and 6.2.EA-Provide Suggestions (CG 3.25 – EG 3.64). Attitude changes experienced by students (self-regulation skills) (10.1.EA – 10.5.EA): The mean exceeded the value of three (3.0) in all items in both groups; however, all item values in EG are higher than the ones in CG. From these results, at first glance EG students experienced higher mental states, behaviors and attitude changes than CG students. This indicates that Emotion Awareness, supported by specific teaching strategies, is strongly related to students’ motivation, engagement and self-regulation.. With regard to Affective Feedback (8.1.AF – 8.5.AF): • The mean exceeded the value of three (3.0) in the items 8.1.AF (3.13), 8.4.AF (3.70) and 8.5.AF (3.70) in the CG and in the items 8.1.AF (3.32), 8.2.AF (3.28), 8.4.AF (3.88) and 8.5.EA (3.77) in the EG. Here, we see that EG students benefited more from teacher’s attitude and affective feedback than CG students did.. Pearson’s correlations Once we gathered the data obtained in the questionnaires, we calculated the Pearson correlation coefficient for the different variables to answer our research questions. Regarding the first research question. We have correlated EA (X) with students’ motivation in learning (Y) and students’ engagement in learning (Z). To this end, we have used the data gathered in items 4, 5 and 6. The results obtained are shown in Table 2 and are presented graphically in Figures 8 and 9. Table 2. Pearson correlation coefficient (n = 60) for research question 1 CG EG 4.1.EA 4.2.EA 4.3.EA 4.4.EA 4.1.EA 4.2.EA Motivation 5.1.EA .215* -.033 .275* -.213 .285* .080 5.2.EA .212* -.235 -.117 -.227 .228* .241 5.3.EA .059 .404** .340** -.260* -.026 .221 5.4.EA -.243 .473** .222 .227 -.191 .256* Engagement 6.1.EA .490** -.320* -.267* -.110 .561** -.069 6.2.EA .230 -.041 .202 .000 .245 .302* ** ** 6.3.EA .140 .344 .606 .138 .114 -.058 Note. *p = .05; **p = .01.. 4.3.EA. 4.4.EA. .107 .078 .322** -.182. -.003 .017 .-228* .133. .093 -.144 -.253. .040 -.101 -.086. As regards motivation, in the EG, taking into account that students had EA, when they felt joy (happiness), they were highly motivated (83.33%). However, when they experienced sadness they were bored (71.67%), but at the same time they tried to maintain their motivation to work. As concerns fear/anxiety and anger/frustration, these emotions led them to an unsafe/uncertainty mood (58.33%). In the CG, taking into account that students had no EA, when they experienced joy, they were motivated (70.00%) in the task. However, when emotions such as sadness and fear/anxiety appeared, they felt unsafe (70.00%) and bored (80.00%), whereas they showed a high tendency to opposition and disagreement, thus losing interest to continue developing their activities. In the case of experiencing anger or frustration, students of the CG felt unsafe (86.67%), i.e., they had a strong lack of self-confidence. As regards engagement, in the EG, when students experienced joy, they had a supportive behavior (85.00%) with peers. When they experienced sadness, they made suggestions and gave their opinion (83.33%) to their peers. Fear and anger did not present any correlation. In the CG, when students experienced joy they maintained a supportive behavior - solidarity (76.67%) with peers. But when they felt sadness and fear, they showed low solidarity as well as opposition (58.33%) to the suggestions of their peers. 96.
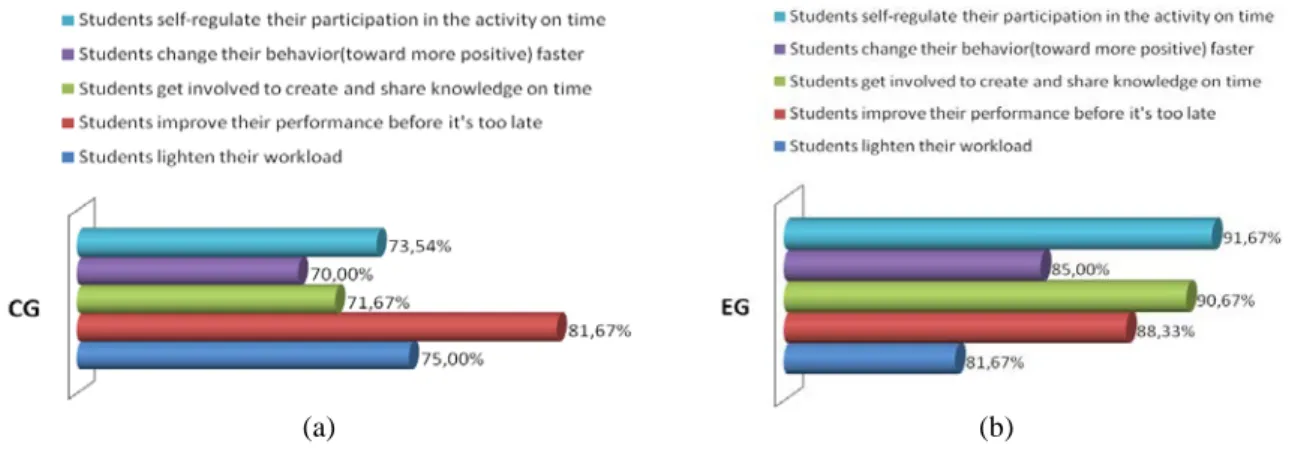
(11) (a) (b) Figure 8. Correlation between students’ emotions and their motivation in learning in (a) CG and (b) EG. (a) (b) Figure 9. Correlation between students’ emotions and their engagement in learning in (a) CG and (b) EG Regarding the second research question. We have correlated EA (X) with students’ self-regulation (H) and learning outcome (J). To this end, as concerns H, we have used the data gathered in items 4, 5, 6 and 10. The results obtained are shown in Table 3 and are presented graphically in Figure 10. In relation to J, we have employed the final mark assigned to each task and the final mark obtained at the end of the activity. Table 3. Pearson correlation coefficient (n = 60) for research question 2 4.2.EA 4.3.EA 4.4.EA 5.1.EA 5.2.EA 5.3.EA 5.4.EA 6.1.EA CG 10.1.EA .399** -.070 -.212 -.329* .300* .143 .176 -.014 .492** * 10.2.EA .235 -.078 .006 -.010 .299 .005 .121 .074 .432** * 10.3.EA .213 -.082 .002 -.124 .310 .213 .125 -.026 .275* ** * * * ** 10.4.EA .537 -.067 .316 -.320 .315 .437 .194 .010 .338** * * 10.5.EA .236 -.199 -.164 .128 .278 .271 .071 .037 .471** EG 10.1.EA .191 .046 -.124 -.045 .355** .372** -.013 -.143 .583* * ** 10.2.EA -.029 .077 -.052 .000 .325 .478 .045 .060 .453* * ** ** 10.3.EA .288 .151 .074 -.076 .426 .511 .114 -.007 .290* ** ** * 10.4.EA .014 .069 .216 .098 .399 .481 .094 -.279 .352** * * ** 10.5.EA .004 .173 .308 .199 .295 .457 .042 .000 .496** * ** Note. p = .05; p = .01. 4.1.EA. 6.2.EA. 6.3.EA. .174 .191 .180 .466** .266*. -.136 .139 -.108 .207 .055. .345** .194 .225 .488** .288**. -.193 -.290* -.257* -.271* -.308*. As regards “students’ self-regulation,” EG students felt more motivated (86.33%) as well as more concentrated to the task (90.00%). Moreover, they showed more solidarity (85.00%) to their peers as well as more willingness to making suggestions (83.33%). All this allowed students to self-regulate their participation in the activity on time (91.67%) as well as to change to a more positive behavior faster (85.00%), a fact that allowed them to be 97.
(12) constructive and cooperative when they were facing socio-cognitive conflicts that occurred among the members of the group, due to the application of the cognitive dissonance strategy, and thus achieve the desired conceptual change more effectively. Furthermore, when students experienced joy (81.67%) they felt more involved to create and share knowledge on time (90.67%). As students were feeling more motivated and concentrated on the task, they felt less boredom (71.67%) or anger (68.33%), which led them to continuously try and thus improve their performance before it was too late (88.33%). Finally, high concentration combined with anxiety and opposed points of view seemed to influence positively a more balanced distribution of work among the group members, which achieved to lighten students’ workload (81.67%) during the development of the activity.. (a) (b) Figure 10. Correlation between students’ emotion awareness and self-regulation in (a) CG and (b) EG CG students experienced less joy (71.67%), motivation (80.00%), concentration in the task (76.67%) and solidarity to peers (81.67%) than EG students. Under these circumstances, students managed to self-regulate their participation in the activity on time at a rate of 73.54%, whereas they had difficulty to show better ability to change to a more positive behavior faster (70.00%) as well as better skills to get involved to create and share knowledge on time (71.67%). Moreover, low performance in motivation, concentration and solidarity had negative effect in lightening students’ workload (75.00%), whereas when they felt emotions such as anxiety and anger, combined with low motivation, concentration, joy and solidarity, acted rather as a barrier to the students’ efforts to improve their performance before it was too late (81.67%). As regards “learning outcome,” we were based on the data gathered in items 4, 5, and 6 of Figure 7 (X) and on the mark that students obtained in each task as well as on final mark awarded at the end of activity (J). The results obtained are shown in Tables 4, 5 and 6.. Marks. Mean 7.5744. Table 4. Descriptive statistics of learning outcome CG (n = 60) EG (n = 60) SD Skewness Kurtosis Mean SD Skewness 8.5778 1.08839 -.673 1.47604 -.240 -1.534. Kurtosis -.175. Table 4 shows that the average score of EG students has been higher than the one of CG students. In Table 5, when we examine all marks obtained by EG students, we see that there is a significant relationship between learning outcome and student’s supportive behavior with peers, which means that good learning outcome is achieved through solidarity among group members. Instead, examining all the marks obtained by CG students, we see that there is a significant relationship between the result obtained in the activity and a variety of emotions that students have experienced, ranging from joy to sadness or fear, and passing from concentration and solidarity with peers to opposition in case of disagreement. This oscillation in students’ emotions certainly influences their learning outcome in a positive or negative manner. Finally, our analysis obtained an interesting result that concerns the marks that were higher than or equal to 9 (Table 6). In the EG it was found again that there is a strong correlation between learning outcome and solidarity with peers. In the CG it was found that there is a strong correlation between learning outcome and opposition in case of disagreement. In this case, it is shown that strong oppositions among group members, without letting them have an explicit awareness of this situation, have prevented them from achieving a very good learning outcome. 98.
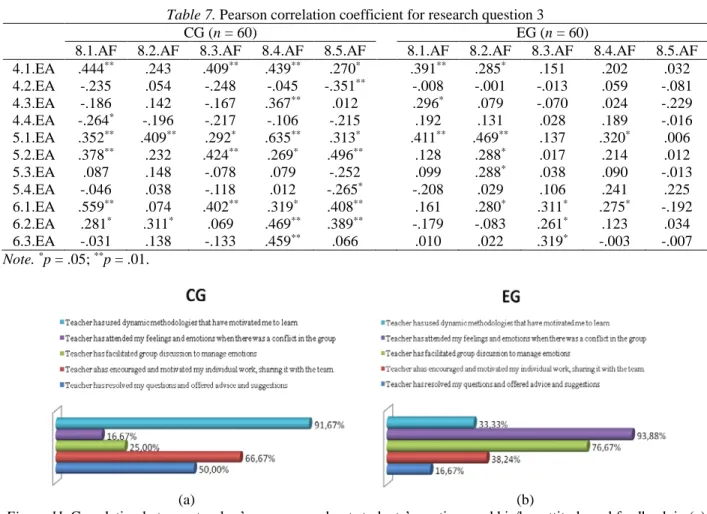
(13) Table 5. Pearson correlation coefficient and learning outcome with all the marks CG (n = 60) EG (n = 60) 4.1.EA 4.2.EA 4.3.EA 5.2.EA 6.1.EA 6.3.EA 4.1.EA 4.2.EA 4.3.EA 5.2.EA 6.1.EA 6.3.EA All the marks .328* -.387** -.255* .546** .284* -.285* .343* -.008 -.070 .581** .292* -,113 Note. *p = .05; **p = .01. Table 6. Pearson correlation coefficient and learning outcome with marks greater than or equal to 9 CG (n = 14) EG (n = 27) 6.3.EA 6.1.EA Marks >= 9 -.616* .276* * Note. p = .05. Regarding the third research question. We have correlated EA (X) with affective feedback (K). To this end, we have used the data gathered in items 4, 5, 6 and 8 of Figure 7. Table 7 shows the results obtained for items: 8.1.AF, 8.2.AF, 8.3.AF, 8.4.AF and 8.5.AF, whereas Figure 11 shows these results graphically. In fact, these items represent the competencies that teachers need to have in order to achieve a positive change on students’ affective and cognitive state. Table 7. Pearson correlation coefficient for research question 3 CG (n = 60) EG (n = 60) 8.1.AF 8.2.AF 8.3.AF 8.4.AF 8.5.AF 8.1.AF 8.2.AF 8.3.AF 4.1.EA .444** .243 .409** .439** .270* .391** .285* .151 ** 4.2.EA -.235 .054 -.248 -.045 -.351 -.008 -.001 -.013 4.3.EA -.186 .142 -.167 .367** .012 .296* .079 -.070 * 4.4.EA -.264 -.196 -.217 -.106 -.215 .192 .131 .028 5.1.EA .352** .409** .292* .635** .313* .411** .469** .137 5.2.EA .378** .232 .424** .269* .496** .128 .288* .017 5.3.EA .087 .148 -.078 .079 -.252 .099 .288* .038 5.4.EA -.046 .038 -.118 .012 -.265* -.208 .029 .106 6.1.EA .559** .074 .402** .319* .408** .161 .280* .311* 6.2.EA .281* .311* .069 .469** .389** -.179 -.083 .261* ** 6.3.EA -.031 .138 -.133 .459 .066 .010 .022 .319* * ** Note. p = .05; p = .01.. 8.4.AF .202 .059 .024 .189 .320* .214 .090 .241 .275* .123 -.003. 8.5.AF .032 -.081 -.229 -.016 .006 .012 -.013 .225 -.192 .034 -.007. (a) (b) Figure 11. Correlation between teacher’s awareness about students’ emotions and his/her attitude and feedback in (a) CG and (b) EG As regards item 8.1.AF, the teacher has extensively used dynamic methodologies to motivate students to learn (91.67%). As shown in the correlations in Table 7, this helped more CG students in several aspects (provided them more satisfaction, alleviated their frustration, supported more motivation, enhanced their concentration to the activity and solidarity with others as well as encouraged their involvement to the activity through suggestions and opinions). As concerns item 8.2.AF, the teacher had to attend more the feelings and emotions of EG students, when there was a conflict in the group. Regarding 8.3.AF, the teacher has facilitated group discussion to manage emotions at 76.67%. 99.
(14) This action has helped EG students mainly in three aspects: increasing their solidarity, encouraging them to provide more suggestions and opinions, and mediating to resolve conflicts. Instead, CG students were mainly benefited in basic emotional aspects, since they felt happier, more motivated, concentrated and more sympathetic. Finally, exploring the other two items (8.4.AF and 8.5.AF), in which the teacher has encouraged and motivated students’ individual work sharing it with the team, as well as the teacher has resolved students’ questions offering advice and suggestions, these actions have helped much more CG students in many aspects as seen in Table 7. Regarding EG students, they do not seem to have very significant correlations (except from two aspects related to students’ motivation and solidarity which are encouraged by teacher’s action 8.4.AF).. Discussion Given the three research questions we set in this work (for the sake of convenience we repeat them here), we analyze the results presented above and obtain the following conclusions: (1) Is there a significant correlation between students’ emotion awareness and their motivation and engagement in learning? (2) Is there any significant correlation between students’ emotion awareness and their self-regulation and learning outcome? (3) Is there any significant correlation between teacher’s awareness about students’ emotions and his/her attitude and feedback? In regard of the first research question, students in both groups showed high levels of motivation under the existence of positive emotions such as joy, as well as strong concentration to the task and solidarity to their peers. However, in the presence of not so positive emotions (such as sadness/shame, fear/anxiety, and anger/frustration), CG students felt very bored and high tendency to dispute, which led them to lose motivation to continue their activities. Moreover, they showed low solidarity to their peers. Finally, when they felt anger or frustration, they had a strong lack of self-confidence. In contrast, EG students when they felt negative emotions such as anxiety or frustration, little more than half of them felt unsafe, but they were able to maintain at least a minimum interest on the activity. This was even more obvious when they were feeling sad. Moreover, when these students felt sad, they were able to receive and provide suggestions and opinions in a constructive way, thus they managed to maintain their engagement during the development of the activity. As a consequence of the above, we draw the conclusion that there is a significant positive correlation between emotion awareness and students’ motivation and engagement in learning. In regard of the second research question, CG students definitively obtain lower scores in self-regulating all explored aspects, that is, a more timely participation in the activity, the necessary changes that could lead towards a more positive behavior faster, a more timely involvement to create and share knowledge, a better performance before it's too late, and a more balanced distribution of their workload. In contrast, EG students achieved much better results in self-regulating all these aspects, distinguishing self-regulation skills such as timely participation and effective knowledge management that scored above 90% and which contributed to enhance teamwork and a more effective development of the activity. Considering learning outcome, EG students performed better than CG students. One of the reasons for achieving better learning outcome is grounded in building high degree of group solidarity and cohesion, which favours trust and engagement among the members of the group. Having the potential of emotion awareness of themselves and their peers during the whole activity provides students with an important tool to develop emotional competence for the group and thus build an emotionally intelligent team. As a result, we can claim that there is a significant positive correlation between emotion awareness and students’ self-regulation and learning outcome. In regard of the third research question, the teacher had the capability to be aware of students’ emotions both in CG and EG. From the above results, we see that the teacher intervenes and supports both groups in almost all aspects that we explored. As regards the CG, since students in this group were not aware of their emotions, they needed much more support and affective feedback from their teacher, for this reason teachers’ attitude has been considered crucial in all aspects. Especially, teacher’s affective feedback has primarily involved dynamic methodologies to motivate students to learn, encouraged and motivated students’ individual work, sharing it with the team and resolved students’ questions offering advice and suggestions. At a second level, teacher has facilitated group discussion to manage emotions and attended students’ feelings and emotions when there was a conflict in the group. Regarding the EG, since the students were aware of their emotions all the time, they emphasized more their need to ask for 100.
(15) emotional support by the teacher when there was a conflict in the group. The result of the teacher intervention made these students feel happy, motivated, concentrated, safe, show more solidarity to their peers, encouraged to provide more suggestions and opinions, as well as more capable of resolving conflicts. All in all, this analysis proves that there is a significant positive correlation between emotion awareness and teacher’s attitude and feedback.. Conclusions and future work In this work we investigated the way emotion awareness influences students’ motivation, engagement, selfregulation and learning outcome as well as teacher’s attitude and feedback (identifying, at the same time, the competencies that teachers need to have in order to achieve a positive change on students’ affective and cognitive state) in long-term blended learning practices. The results of our work showed that being aware of their emotions, students become more conscious of their situation, which prompts them to change and adapt their behavior for the benefit of their group. Moreover, it has been observed that their learning performance also improved in relation to their motivation, engagement and self-regulation. We also explored teachers’ attitude when they are conscious of students’ emotional state. We saw that teacher intervenes to support all students consciously and on time. In the case of Experimental Group students, teacher’s affective feedback becomes even more focused, knowing that students were aware of a difficult emotional situation they encountered in case of socio-cognitive conflict. Our future work now turns to investigate more on the nature and impact of affective feedback on students’ learning process. This represents a first step toward the long-term objective of designing a virtual Affective Pedagogical Tutor (APT) that provides (semi)-automated feedback to students. This raises important issues about: the type of APT that is most appropriate and effective to student-centered collaborative learning situations; the understanding of the factors that have led students to remain in the same negative affective state for a certain period of time (which can lead them to deterioration of their learning performance, failure, and even withdrawal from studies); the establishment of criteria that indicates the most adequate moment that APT can intervene and monitor students’ affective situation; and, the type of affective feedback that best fits the students’ needs and affective state.. References Aïmer, E. (1998). Application and assessment of cognitive-dissonance theory in the learning process. Journal of Universal Computer Science, 4(3), 216-247. Arguedas, M., & Daradoumis, T. (2013). Exploring learners’ emotions over time in virtual learning. eLearn Center Research Paper Series, (6), 29-39. Retrieved from http://elcrps.uoc.edu/ojs/index.php/elcrps/article/view/1869/n6-arguedas Arguedas, M., Daradoumis, T., & Xhafa, F. (2014). Towards an emotion labeling model to detect emotions in educational discourse. In Proceedings of the 8th International Conference on Complex, Intelligent and Software Intensive Systems (CISIS2014) (pp. 72-78). Los Alamitos, CA: IEEE Computer Society. Aronson, E. (1995). The Social animal. New York, NY: W.H. Freeman and Co. Aronson, E., & Patnoe, S. (2011). Cooperation in the classroom: The Jigsaw method (3rd ed.). London, UK: Pinter & Martin, Ltd. Bahreini, K., Nadolski, R., & Westera, W. (2012). FILTWAM - A Framework for online affective computing in serious games. Procedia Computer Science, 15, 45-52. Baker, R., Rodrigo, M., & Xolocotzin, U. (2007). The Dynamics of affective transitions in simulation problem-solving environments. In A. C. R. Paiva, R. Prada & R. W. Picard (Eds.), Affective Computing and Intelligent Interactions (pp. 666-677). doi:10.1007/978-3-540-74889-2_58 Bratt, C. (2008). The Jigsaw classroom under test: No effect on intergroup relations present. Journal of Community & Applied Social Psychology, 18(5), 403-419. Calvo, R. A., & D’Mello, S. (2010). Affect detection: An Interdisciplinary review of models, methods, and their applications. IEEE Transactions on Affective Computing, 1(1), 18-37. Colomo-Palacios, R., Casado-Lumbreras, C., Soto-Acosta, P., & García-Crespo, A. (2011). Using the affect grid to measure emotions in software requirements engineering. Journal of Universal Computer Science, 17(9), 1281-1298.. 101.
(16) Daradoumis, T., & Kordaki, M. (2011). Employing collaborative learning strategies and tools for engaging university students in collaborative study and writing. In F. Pozzi, & D. Persico, (Eds.), Techniques for Fostering Collaboration in Online Learning Communities: Theoretical and Practical Perspectives (pp. 183-205). Hershey, PA: IGI Global Publishing. Davis, H. A., DiStefano, C. & Schutz, P. A. (2008). Identifying patterns of appraising tests in first-year college students: Implications for anxiety and emotion regulation during test taking. Journal of Educational Psychology, 100(4), 942-960. DiDonato, N. (2013). Effective self- and co-regulation in collaborative learning groups: An Analysis of how students regulate problem solving of authentic interdisciplinary tasks. Instructional Science, 41(1), 25-47. D’Mello, S., Taylor, R. S., & Graesser, A. (2007). Monitoring affective trajectories during complex learning. In Proceedings of the 29th Annual Meeting of the Cognitive Science Society (pp. 203-208). New York, NY: Lawrence Erlbaum Associates. Engeström, Y., Miettinen, R., & Punamäki, R. L. (1999). Perspectives on activity theory. Cambridge, UK: Cambridge University Press. Feidakis, M., Daradoumis, T., & Caballé, S. (2013). Building emotion-aware features in Computer Supported Collaborative Learning (CSCL) systems. In Alpine Rendez-Vous (ARV) Workshop on Tools and Technologies for Emotion Awareness in Computer-Mediated Collaboration and Learning (ARV 2013). Villard‐de‐Lans, France: TELEARC & EATEL associations. Retrieved from https://www.academia.edu/2564765/Building_emotionaware_features_in_Computer_Supported_Collaborative_Learning_CSCL_systems Feidakis, M., Caballé, S., Daradoumis, T., Gañán, D., & Conesa, J. (2014). Providing emotion awareness and affective feedback to virtualized collaborative learning scenarios. International Journal of Continuing Engineering Education and Life-Long Learning (IJCEELL), 24(2), 141-167. Gallego, D. J. & Gallego, M. J. (2004). Cuestionario PEYDE: Práctica Educativa y Desarrollo Emocional [PEYDE questionnaire: Educational Practice and Emotional Development]. In D. J. Gallego Gill & M. J. Gallego Alarcón, Educar la inteligencia emocional en el aula. Madrid, Spain: PPC. Gardner, H. (2006). Multiple intelligences: New horizons. New York, NY: Basic Books. Goleman, D. (1995). Emotional intelligence. New York, NY: Bantam Books. Graesser, A. C., Baggett, W., & Williams, K. (1996). Question-driven explanatory reasoning. Applied Cognitive Psychology, 10, 17–32. Grosz, B., & Sidner, C. (1986). Attention, intentions, and the structure of discourse. Computational Linguistics, 12(3), 175-204. Guzzetti, B. J., Snyder, T. E., Glass, G. V., & Gamas, W. S. (1993). Promoting conceptual change in science: A comparative metaanalysis of instructional interventions from reading education and science education. Reading Research Quarterly, 28, 116–159. Han, H., & Johnson, S. D. (2012). Relationship between students’ emotional intelligence, social bond, and interactions in online learning. Educational Technology & Society, 15(1), 78–89. Heylen, D., Nijholt, A., & op den Akker, R. (2005). Affect in tutoring dialogues. Applied Artificial Intelligence, 19(3-4), 287-311. Jennings, P. A. (2011). Promoting teachers’ social and emotional competencies to support performance and reduce burnout. In A. Cohan & A. Honigsfeld (Eds.), Breaking the mold of preservice and inservice teacher education: Innovative and successful practices for the twenty-first century (pp. 133–143). New York, NY: Rowman & Littlefield. Jurado, F., & Rodriguez, P. (2015). Sentiment Analysis in monitoring software development processes: an exploratory case study on GitHub’s project issues. Journal of Systems and Software, 104, 82-89. Lee, G., Kwon, J., Park, S., Kim, J., Kwon, H., & Park, H. (2003). Development of an instrument for measuring cognitive conflict in secondary-level science classes. Journal of Research in Science Teaching, 40(6), 585–603. Liu, C. J., Huang, C. F., Liu, M. C., Chien, Y. C., Lai, C. H., & Huang, Y. M. (2015). Does gender influence emotions resulting from positive applause feedback in self-assessment testing? Evidence from neuroscience. Educational Technology & Society, 18(1), 337–350. Loia, V., & Senatore, S. (2014). A Fuzzy-oriented sentic analysis to capture the human emotion in Web-based content. Knowledge-Based Systems, 58, 75–85. Kort, B., & Reilly, R. (2002). Analytical models of emotions, learning and relationships: Towards an affect-sensitive cognitive machine. In Proceedings of the International Conference on Virtual Worlds and Simulation (VWSim 2002). Retrieved from http://web.media.mit.edu/~reilly/its2002.pdf Pekrun, R. (2005). Progress and open problems in educational emotion research. Learning and Instruction, 15(5), 497-506. 102.
(17) Pekrun, R., Goetz, T., Frenzel, A. C., Barchfeld, P., & Perry, R. P. (2011). Measuring emotions in students’ learning and performance: The Achievement emotions questionnaire (AEQ). Contemporary Educational Psychology, 36(1), 36–48. Pérez-Marín, D., & Pascual-Nieto, I. (2013). An Exploratory study on how children interact with pedagogic conversational agents. Behaviour & Information Technology, 32(9), 955-964. Perkins, D. V., & Saris, R. N. (2001). A “Jigsaw Classroom” technique for undergraduate statistics courses. Teaching of Psychology, 28, 111–113. Piaget, J. (1967). The Mental development of the child. In D. Elkind (Ed.), Six psychological studies (pp. 3-76). New York, NY: Random House. Piaget, J. (1980). Adaptation and intelligence: Organic selection and phenocopy. Chicago, IL: University of Chicago Press. Pintrich, P. R., Marx, R. W., & Boyle, R. A. (1993). Beyond cold conceptual change: The Role of motivational beliefs and classroom contextual factors in the process of conceptual change. Review of Educational Research, 63, 167–199. Rosenshine, B. (1997). Advances in research on instruction. In J. W. Lloyd, E. J. Kameanui, & D. Chard (Eds.), Issues in educating students with disabilities (pp. 197-221). Mahwah, NJ: Lawrence Erlbaum. Shen, L., Wang, M., & Shen, R. (2009). Affective e-learning: Using “emotional” data to improve learning in pervasive learning environment. Educational Technology & Society, 12(2), 176–189. Sinha, V., Abraham, A., Bhaskarna, B., Xavier, K., & Kariat, K. (2014). Role efficacy: Studying the impact on employee engagement, employee motivation and attrition. International Journal of Human Capital and Information Technology Professionals (IJHCITP), 5(4), 35-54.. 103.
(18) Reproduced with permission of the copyright owner. Further reproduction prohibited without permission..
(19)
Figure
+7
Documento similar