C
C
|
E
E
|
D
D
|
L
L
|
A
A
|
S
S
Centro de Estudios
Distributivos, Laborales y Sociales
Maestría en Economía Facultad de Ciencias Económicas Universidad Nacional de La Plata
Economic Crises, Maternal and Infant Mortality,
Low Birth Weight and Enrollment Rates: Evidence
from Argentina’s Downturns
Guillermo Cruces, Pablo Glüzmann y Luis Felipe López
Calva
Documento de Trabajo Nro. 121
Julio, 2011
Economic Crises, Maternal and Infant Mortality,
Low Birth Weight and Enrollment Rates:
Evidence from Argentina’s Downturns
June 2011
Guillermo Cruces* Pablo Glüzmann Luis Felipe López Calva
Abstract: This study investigates the impact of recent crises in Argentina (including the severe
downturn of 2001-2002) on health and education outcomes. The identification strategy relies on both the inter-temporal and the cross-provincial co-variation between changes in regional GDP and outcomes by province. These results indicate significant and substantial effects of aggregate fluctuations on maternal and infant mortality and low birth weight, with countercyclical though not significant patterns for enrollment rates. Finally, provincial public expenditures on health and education are correlated with the incidence of low birth weight and school enrollment for teenagers, with worsening results associated with GDP declines.
Keywords: crisis, infant mortality, maternal mortality, low birth weight, poverty, Argentina
* Affiliation for Cruces: FCE-UNLP, CONICET and IZA. Affiliation for Glüzmann:
CEDLAS-FCE-UNLP and CONICET. Affiliation for López Calva: The World Bank, Poverty and gender unit,
Latin America and the Caribbean. CEDLAS-FCE-UNLP: Centro de Estudios Distributivos Laborales y
Sociales [Center for Social, Labor and Distributional Studies], Facultad de Ciencias Económicas
[Economics Faculty], Universidad Nacional de La Plata [National University of La Plata]. CONICET:
Consejo Nacional de Investigaciones Científicas y Técnicas [National Scientific and Technical Research
Council, Argentina. IZA: Institute for the Study of Labor, Bonn, Germany.
Corresponding author: [email protected] Address: CEDLAS-FCE-UNLP. Calle 6 entre 47 y 48, 5to.
Piso Of. 516, (1900) La Plata, Pcia. de Buenos Aires, Argentina. Teléfono-fax: +54-221-4229383. Email:
[email protected] Website: www.cedlas.org
1. INTRODUCTION
A large body of evidence documents the impact of macroeconomic shocks, aggregate fluctuations and economic crises on household welfare, from direct effects on employment, poverty and income, to longer term consequences on human capital investments, health and psychological well being.
Several channels link aggregate downturns to household welfare. Short term effects on income increase deprivation levels and are highly correlated with the unemployment rate and other labor market outcomes. However, poverty and unemployment levels tend to recover after crises. As such, it is relatively more difficult to identify their long term impact on household welfare and in the realms of health and human capital accumulation. When present, these impacts can further the process of intergenerational transmission of poverty, implying that even short-term downturns can have lasting consequences on human development levels. For instance, several early childhood development studies (see Schady 2004, and Galiani 2009, for reviews of existing evidence for Latin America) indicate that adverse events at the beginning of a child’s life may translate directly into deteriorated adult outcomes.
However, crises also imply potentially conflicting income and substitution effects regarding health and education outcomes (Ferreira and Schady, 2009). The impact of an economic crisis is thus, ultimately, an empirical question. Quantifying these effects constitutes the first step in the process of understanding the underlying mechanisms and channels connecting welfare and aggregate shocks. These, in turn, are fundamental inputs for the design of ex-ante safety nets, ex-post alleviation programs and other corrective and preventive policy initiatives intended to safeguard the population and reduce vulnerability.
The results for Argentina presented in this document attempt to overcome some of the challenges posed by the identification of the consequences of crises on health and education. The study estimates the impact of recent crises in Argentina on a variety of dimensions of welfare for the period 1993-2005. The identification strategy relies on both the inter-temporal and the cross-provincial co-variation between changes in regional GDP and outcomes by province.
significant) effects on education enrollment rates. The results indicate an asymmetry in these effects: The negative relationship between downturns and health outcomes is greater than the positive evolution during recoveries. Moreover, low birth weight and enrollment for youths aged 13 to 17 are significantly correlated with public expenditure (negatively and positively, respectively). These results are in line with recent theoretical and empirical findings, and significantly expand the evidence base concerning the consequences of macro-shocks, especially in terms of the finding on low birth weight for which previous work has not found substantial evidence.
It should be stressed, however, that in a strict sense the estimated results of provincial GDP variation on human development outcomes are purely conditional correlations that do not represent causal relationships. On the other hand, there is only limited scope for challenging an interpretation of the results as encapsulating a causal relationship. There is no possibility of reverse causation in the estimated relation, and while an omitted third variable might be driving the estimated relation, governance issues are the only strong candidates to pose a potential threat to identification. Since in the strictest interpretation the data at hand does not provide a purely exogenous source of variation, the terms “impact” and “effects” used throughout this document imply that the estimated semi-elasticities only represent sound observational correlations.1
The paper is organized as follows: Section 2 provides a brief summary of recent evidence on macroeconomic shocks and household welfare, an overview of the evidence for Argentina and the recent evolution of GDP and socioeconomic indicators since the mid 1990s. Section 3 presents estimates of the relationship between GDP and these outcomes by exploiting variation at the provincial level, a series of robustness checks, and evidence on public expenditure as potential transmission mechanisms. Section 4 concludes with an assessment of the contribution of these findings and their relationship to existing literature, and offers some suggestions for further research.
1 The authors acknowledge the contribution of two anonymous referees in this discussion of the
2. AGGREGATE SHOCKS AND HOUSEHOLD WELFARE: A BRIEF REVIEW AND EVIDENCE FROM ARGENTINA
a. Aggregate shocks and household welfare: A brief review
This section reviews some of the theory and evidence that accounts for the impact of aggregate shocks on household welfare. Understanding these effects and their underlying mechanisms is a key input for policy making, both in terms of mitigation and prevention – see for instance Lustig’s (2000) discussion of these issues for Latin America and the Caribbean.
The most direct effects of crises – on household income, employment and poverty levels – have been amply documented (see, among others, Fallon and Lucas, 2002). For Latin America and the Caribbean, Gasparini, Gutiérrez and Tornarolli (2007) report that during the 1990s and the early 2000s decreases in GDP had substantial impacts on poverty rates, including few instances of positive and unambiguously pro-poor income growth during this period in the region.2 However, these most direct effects of crises tend to dissipate relatively quickly with employment growth in subsequent recovery periods. The long term effects of crises get confounded with contemporary and future economic fluctuations, thus their identification poses a series of challenges. Most studies, thus, measure correlations between outcomes and crises. Only a handful of papers have credible identification strategies based on exogenous sources of variations – most notably in this review, Camacho (2008), López Bóo (2008), and Bózzoli and Quintana-Domeneque (2010), which are discussed below.
The most compelling studies in this area are related to the effects of crises on children’s health and human capital accumulation.3 Ferreira and Schady (2009) review the empirical evidence on these issues and propose a framework to understand the multiple and potentially conflicting incentives introduced by crises. They argue that education and health investments are not necessarily pro-cyclical, and that ambiguities are due to the presence of income and substitution effects. Crises reduce human capital
2 Using updated household survey data for the region, Gasparini, Cruces and Tornarolli (2011) find
evidence for some episodes of pro poor growth for the 2000s.
3 Recent studies have uncovered evidence on the long term effects for other dimensions of welfare.
investments because of the diminished resources available to households (income effect), yet they may also induce higher investments due to lower wage rates, which reduce the opportunity cost of time for adults and the opportunity cost of schooling for children (substitution effect). Ferreira and Schady’s (2009) model suggests that in developed countries downturns will improve health and education outcomes (because of less binding credit constraints), whereas the effects will be negative in poor countries. The authors also suggest that the effects will be most ambiguous for countries in Latin America, Eastern Europe and other middle income countries.
Empirical evidence is generally consistent with these predictions.4 For the United States, Dehejia and Lleras-Muney (2004) find that infant health outcomes improve for babies (reduced mortality and low birth weight) conceived during recessions due in part to selection effects – i.e. the type of mothers conceiving during these events. Evidence for developing countries indicates impacts in the opposite direction. For example, Bhalotra (2010) finds that infant mortality is counter-cyclical in rural areas of India. Baird, Friedman and Schady (2009) use microdata from Demographic and Health Surveys from 59 developing countries and also find evidence of counter cyclical behavior in infant mortality. Moreover, they find that the effect is asymmetrical: downturns imply larger increases in infant mortality than the decreases associated with positive shocks.
Similar patterns emerge in case studies from Latin America. Based on microdata from Demographic and Health Surveys, Paxson and Schady (2005) find that the 1988-1992 macroeconomic crisis in Peru resulted in substantially higher levels of infant mortality. Cutler et al. (2003), using administrative data, find a similar pattern for child mortality in Mexico during the repeated crises of the 1980-1998 period. Finally, Schady and Smitz (2009) present evidence on crises and infant mortality for middle-income countries, finding that only large economic contractions (GDP decreases of 15 percent or more) result in increases in infant mortality.
With respect to educational outcomes, evidence for Latin America suggests that crises induce higher school enrollment levels. McKenzie (2003) studies Mexico’s 1995 crisis and finds that school attendance rose for adolescents aged 15 to 18. Schady (2004)
4 The authors are indebted to Chico Ferreira and Norbert Schady, who suggested most of the references
finds that in Peru school-age children exposed to the 1988-1992 crisis have higher educational attainment levels (see further references in Ferreira and Schady, 2009).
The next section reviews available evidence for Argentina, a middle income country where the theory on the impact of crises is ambiguous in its predictions regarding effects on health and education outcomes.
b. Recent crises in Argentina and their impact on household welfare
Argentina’s recent economic history has been characterized by repeated macroeconomic crises and their impact on different aspects of household welfare (see Gasparini and Cruces 2010 for a review). As such, the Argentine experience has motivated a series of case studies on the impact of crises. The following paragraphs briefly describe the main economic trends in the country since the 1980s and review existing empirical evidence on crises and household welfare.
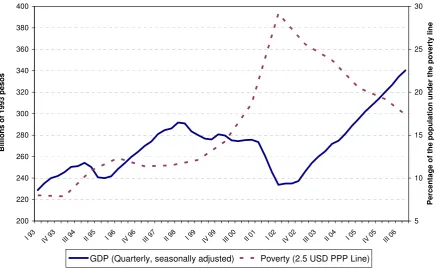
The evolution of socioeconomic indicators in Argentina since the early 1980s has been shaped by a series of macroeconomic crises. The 1980s witnessed several bouts of hyperinflation and economic instability lasting until 1991. A series of market oriented structural reforms in the 1990s resulted in some degree of stabilization in terms of inflation, in addition to some volatility due to the exposure to international flows of capital and their reversals. These patterns emerge clearly in Figure 1, which depicts the evolution of Gross Domestic Product (GDP) at constant 1993 prices and the poverty levels based on the 2.5 USD PPP (purchasing power parity) international line for the period 1993-2006.
[FIGURE 1 ABOUT HERE]
recession, which began in 1999 and which culminated in a major economic, banking and financial crisis in December 2001. The meltdown resulted in a significant decrease in output and employment: GDP fell 17 percent between 2000 and 2002; and unemployment rose above 20 percent. The recession and the ensuing crisis had an enormous impact on poverty (Figure 1). The combination of price increases (due to the devaluation of the country’s currency) and falling nominal incomes (due to the sharp reduction in economic activity) prompted a surge in poverty from 18.6 to 29.1 percent of the population (using the international 2.5 USD PPP line).5 As depicted in Figure 1, however, this unprecedented crisis was followed by an equally unprecedented period of growth, due to the strong devaluation of the currency, the high levels of unemployment and idle productive capacity in the economy. The average annual growth rate remained high at 8 percent between 2003 and 2007, while the unemployment rate fell to 8 percent. Poverty and inequality indicators dropped continuously during the same period, in part due to the widespread coverage of an emergency cash transfer program (Cruces and Gasparini, 2008).
The far-reaching and unprecedented crisis of 2001-2002 motivated a series of studies regarding its impact on household welfare. The following review concentrates mainly on the outcomes relevant to this study.6 A first strand of literature concentrates on the direct impact of the crisis on income, employment and poverty, and on the coping strategies adopted by households. Cruces and Wodon (2003), using household surveys (Encuesta Permanente de Hogares, EPH), document the increase in poverty
and its incidence by providing evidence related to the characteristics of households that saw the largest declines in welfare – those without the means to diversify their income sources. Adúriz, Giovagnoli and Fiszbein (2003) study household coping strategies by means of an ad hoc survey implemented in the midst of the crisis (June and July 2002).
They document a change in household roles with respect to the labor market, with higher employment among secondary workers as a strategy to compensate for the fall in income for unemployed (or reduced-hours) primary workers. McKenzie (2004), also using EPH data, characterizes responses to the crisis in labor markets: the main effect is
5 The trends using alternative poverty measures are qualitatively the same: The official poverty rate rose
from 38.3 percent in October 2001 to 53 percent in May 2002, while levels with the international 4 USD PPP poverty line increased from 32.9 in early 2001 to 45.5 in early 2002 (SEDLAC - CEDLAS and World Bank, 2010).
a generalized drop in real wages, which, coupled with weak labor demand, prevented households from increasing employment or work hours.
The above references provide baseline evidence regarding the most direct effects of economic crises: income; labor markets; and poverty. There is substantially less evidence concerning the impact on other dimensions of household welfare, especially in terms of long term outcomes.
In terms of infant health outcomes, Bózzoli and Quintana-Domeque (2010) use a less exploited data source – the national registry of live births for the period 2001-2003 – to compute the effect of the crisis on birth weight. The results were obtained by means of an original identification strategy that controlled for seasonality in birth rates, and compared mothers for whom the crisis was unexpected with those who were exposed to the full downturn. They find a statistically significant and substantial loss of 30 grams of average birth weight, with greater losses for children born to mothers from lower socioeconomic strata. Rucci (2004b, chapter 3) explores similar data for the 1991-2002 period, but fails to find an effect of the crisis on low birth weight and infant mortality. In related work, Rucci (2004b, chapter 1) uses a sample of several provinces to document the significant role of health programs and infrastructure in the decline of infant mortality in the 1991-1999 period, but does not directly study the impact from changes in provincial output. The results presented below, based on provincial aggregates, are compatible with Bózzoli and Quintana-Domeneque’s (2010) findings, and suggest that income effects prevailed for health outcomes.
In terms of education, López Bóo (2010a) uses EPH data to study the effects of the aggregate fluctuations on primary and secondary school enrollment over the 1992-2003 period, with special emphasis on the 1999-2002 downturn. She finds that deteriorating labor market opportunities (in terms of employment or wages) increase school attendance and reduce the combination of work and school. During the crisis period, the conditional probability of attending secondary school for the relevant age group increased substantially, providing support to the prevalence of substitution effects for educational decisions.7 This detailed analysis allows for a series of controls of individual characteristics and labor market trends that are not available for the aggregate
7 Rucci (2004a) reports that the 1998-2002 recession and crisis reduced school attendance. López Bóo
analysis presented below. The findings in this study are compared below with López Bóo’s (2010a).
3. INFANT AND MATERNAL MORTALITY, LOW BIRTH WEIGHT AND
ENROLLMENT RATES IN ARGENTINA’S CRISES
a. Data
The evidence presented in this study is derived from a series of aggregate indicators at the national and provincial levels. The outcomes of interest include: three health indicators – maternal mortality (per 10,000 live births), infant mortality (children up to one year old per 1,000 live births) and low birth weight (children weighing less than 2,500 grams at birth per 1,000 live births); three education variables –school attendance rates for children aged 6 to 12, school attendance rates for youngsters aged 13 to 17, and the proportion of those aged 13 to 17 that do not work nor attend school;8 and, as a benchmark, child and overall poverty rates (calculated using the international 2.5 USD PPP poverty line).9 The attendance rates are not adjusted for the theoretical age group at primary or secondary levels since the focus of the exercise below is based on whether children are in the educational system or not, irrespective of their level.
The data on mortality and birth weight at the provincial level is published by Argentina’s Ministry of Health (DEIS, 2009), and originates in official registries.10 Poverty and educational outcomes were computed from household survey micro data from the Encuesta Permanente de Hogares (EPH), a periodical11 household survey
8 The information on education from the EPH household survey states whether a child “attends” school.
This does not allow a precise distinction between attendance and enrollment, which are used interchangeably throughout this document.
9 The estimates below were also calculated with the 1.25 and 4 USD PPP lines, with qualitatively similar
results (available from the authors upon request).
10 As noted by Norbert Schady (personal communication), a potential disadvantage of administrative data
is the possibility of compositional changes, implying that not all newborns were weighed, and that this could be correlated with changing macroeconomic conditions. This potential bias seems relatively minor: 99 percent of births were attended by trained health personnel in Argentina for the period 1993-2005 (DEIS, 2009). However, the use of aggregate data does not allow for control of composition effects of women giving birth, which were important factors in the US (Lleras-Muney, 2004), and for which Rucci (2004b) finds some evidence for Argentina during the 2001-2002 crisis.
11 The surveys used to calculate the indicators for 1993-2002 correspond to the October round of the
representative of urban areas, which is carried out in all of Argentina’s provinces by the
Instituto Nacional de Estadísticas y Censos (INDEC).
Finally, the economic cycle is captured by the per capita Gross Domestic Product (henceforth, per capita GDP) at the national level, obtained from national accounts information (INDEC, 2009; MECON, 2009). The regional variation in output corresponds to a time series of provincial GDP (Producto Geográfico Bruto), calculated
for each of Argentina’s 24 jurisdictions (23 provinces and one federal district)12 by the Argentine office of ECLAC (2009).13 Per capita adjustments are based on yearly provincial population projections (INDEC, 2009).
b. Main estimates and robustness checks
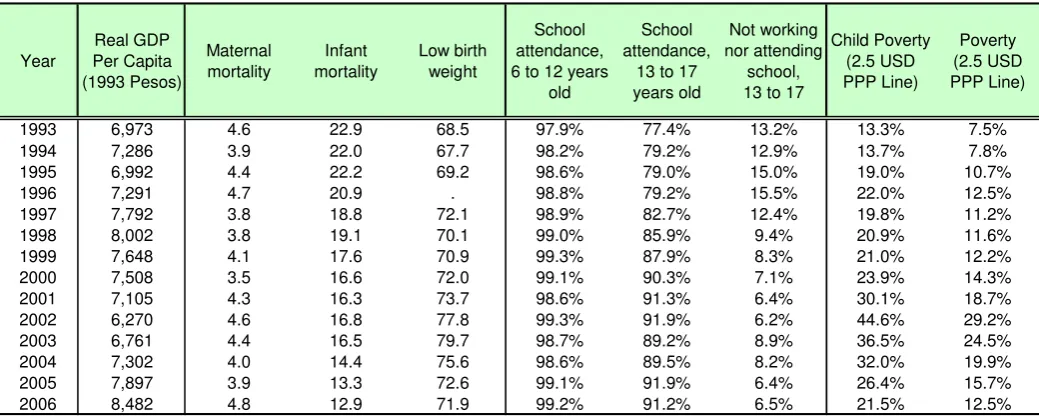
Table 1 presents the evolution of the outcomes of interest for each year in the sample. Maternal mortality does not appear to have a clear trend over the period, while infant mortality decreases substantially from 1993 to 2006. Low birth weight increases in 1995 and then again from 2000 to 2003, and has a positive trend over the period. With respect to educational outcomes, primary enrollment seems to be almost universal, whereas enrollment for ages 13 to 17 increased substantially over the period (from 77.8 to 92.2 percent). The proportion of those in the same age group that do not work or attend school fell accordingly. Finally, as depicted in Figure 1, poverty (and child poverty) increased substantially during the 1990s and after the 2002 crisis, then fell significantly.
[TABLE 1 ABOUT HERE]
Some correlations between the outcomes and changes in per capita GDP are apparent in Table 1. The figures for poverty and child poverty provide a benchmark: For almost all years, their change goes in the opposite direction of that of output. The same seems to be true for the health outcomes: All three worsen in 1995 and 2002, the years of the two greatest crises of the period in question, and then become countercyclical.
12 Argentina is made up of 23 provinces and an autonomous district, the City of Buenos Aires. The latter
is equivalent to a province for this analysis.
13 In less developed countries, regional GDP measures are often prone to measurement error. It should be
Educational outcomes do not seem to follow a clear pattern; if anything, they appear to be positively related to income growth (pro-cyclical).
These first approximations of the relationship between the outcomes of interest and aggregate output are insightful but limited in their statistical power. An amply documented characteristic of the Argentine case is the substantial regional variation in both average living standards over the period under study and the severity of the 2001-2002 crisis in terms of poverty and output declines (see Cruces and Wodon, 2003, and the references in Gasparini and Cruces, 2010). For instance, the poverty headcount rate (based on the 2.5 USD PPP line) increased 17.4 percentage points (from 21.9 to 39.3 percent) in Tucumán province between 2001 and 2002, but only 7.1 percentage points in Santa Cruz. However, the latter statistic represents the largest proportional increase between these two years (from 3 to 10.1 percent – 237.4 percent), much larger than the 25 percent proportional increase in the rate for Chaco (from 37.8 to 47.2 percent of the provincial population). This heterogeneity along a common trend is also reflected in provincial GDP levels and other outcomes, as depicted in Table 2, which presents the coefficient of variation at provincial levels for each variable in Table 1.
[TABLE 2 ABOUT HERE]
This evidence suggests that the impact of aggregate fluctuations can be estimated by exploiting regional differences in their effects. There are several alternatives for this type of estimation. As discussed by Baird et al. (2007), first differencing of output and outcomes may create a stationary series under some conditions, and reduce the problems induced by serial correlation in time series. The preferred specification implemented in the estimates below is based on a random trends model (Wooldridge, 2001, Chapter 11), derived from differenced data but with the additional feature of allowing each province in the sample to have its own time trend. The models for studying the relationship between GDP and the outcomes have the following form:
jt jt
jt j jtt j t
j Y GDPpc GDPpc X F
Y 1 log log 1 ' ' (1)
where Yjt denotes the outcome of interest for province j at time t, Xjt are a series of time
varying covariates for each province, and the term Fj represents provincial fixed effects
The results provide consistent estimates of the response (semi-elasticities) of education, health and deprivation variables to the economic cycle. The identification strategy for these estimates relies on both the inter-temporal and the cross-provincial co-variation between changes in regional GDP and outcomes by province. The objective of the exercise is the quantification of these semi-elasticities, which do not necessarily capture a causal relationship between the variables. These semi-elasticities are captured by the parameter and estimated by regression models like (1) weighted by the
provincial population for each outcome of interest to reflect greater precision in estimates from larger provinces. Given the difficulty of finding truly exogenous control variables, the set of covariates Xjt is kept at a minimum, and includes the change in
gender and age composition of the population in each province for all estimates,14 and indicators for institutional reforms for the education outcomes.15
[TABLE 3 ABOUT HERE]
The top panel of Table 3 presents the results for the coefficient for the
outcomes under study, with robust standard errors clustered at the province level. The benchmark results for the poverty measures demonstrate a strong and highly significant counter-cyclicality – a one percent increase in per capita GDP reduces child poverty by 0.66 percentage points, while it reduces overall poverty by 0.48 percentage points. Moreover, the results indicate a negative (countercyclical), but not significant, relationship between the evolution of per capita GDP and that of the three selected educational indicators at the provincial level.
Finally, the results demonstrate significant relationships between changes in aggregate output and the three health indicators, which worsen substantially with GDP declines and improve with economic growth. A one percent decrease in per capita GDP increases maternal and infant mortality in around 0.04-0.05 cases per 10,000 births, and
14 While controls for the full gender and age structure of the population by province would be preferable,
the EPH samples sizes by province do not allow for this type of decomposition with precision. The yearly figures from INDEC (2009), on the other hand, are based on population projections. The age and mean sex composition by province represents a compromise that allows for the inclusion of statistically significant controls by province.
15 The 1993 “Ley Federal de Educación” (LFE) extended compulsory education from 7 to 9 years, and
increases in 0.18 cases per 1,000 the number of low birth weight children. These coefficients indicate substantial effects. The averages of these three rates for the 1993-2006 period are 4.2 (maternal mortality), 17.9 (infant mortality) and 72.5 (low birth weight), implying that a 10 percent decrease in GDP would increase the maternal mortality rate by 9.4 percent, the infant mortality rate by 2.5 percent and the low birth weight rate also by 2.5 percent.
However, the above estimations implicitly assume a symmetrical relationship between the evolution of GDP and the outcomes of interest for both growth and recession episodes, which contradict some of the available evidence for developing countries, as discussed in section 2 (Baird et al., 2009). A consequence of this assumption is a possible overestimation of the effect for the growth period and an underestimation for recessions. As an illustrative example, Figure 2 plots the relationship between changes in GDP and the percentage change in the poverty headcount. Poverty seems to increase markedly during downturns, but in growth periods it declines at a slower rate as compared to the response during recession.
[FIGURE 2 ABOUT HERE]
To account for this potential heterogeneity in responses to GDP changes, the bottom panel of Table 3 presents the results from the estimation of a model that allows for differentiation between episode type:
jt jt
jt j jtt j t j t j t j F X GDPpc GDPpc D GDPpc GDPpc D Y Y ' ' log log 1 log log 1 2 1 1 1 (2) where
0 log log 0 0 log log 1 1 1 t j t j t j t j GDPpc GDPpc if GDPpc GDPpc Dmortality on average by about 0.8 per 10,000 cases. Most notably, downturns are strongly correlated with the worsening of indicators of children’s health outcomes. Infant mortality and low birth weight increase by 0.11 and 0.2 per 1,000 cases respectively for each percent reduction in per capita GDP, and they do not fall significantly with increases in provincial GDP over the period.
[TABLE 4 ABOUT HERE]
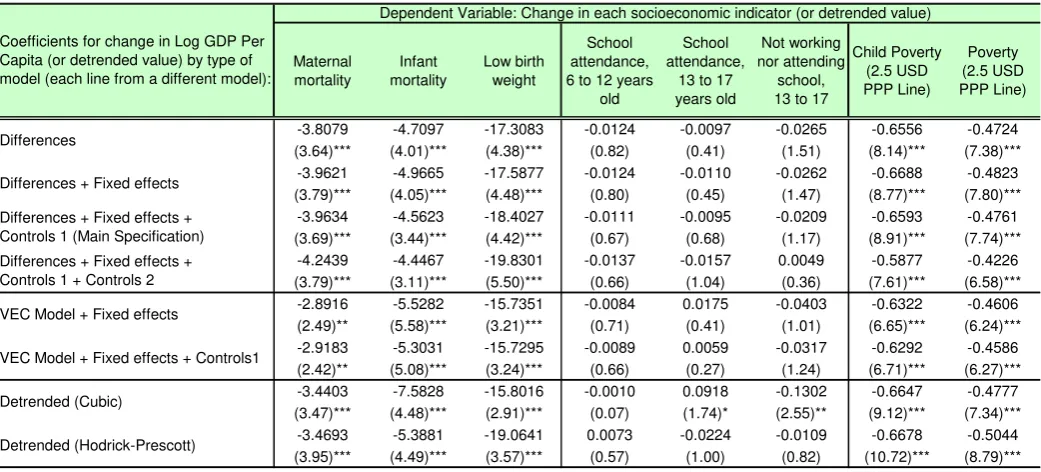
Finally, Table 4 presents the results of a series of robustness checks that corresponds to variations of the model in equation (1), following the alternatives discussed in Baird, Friedman and Schady (2007). All standard errors in the Table are clustered at the provincial level. The “Differences” model is a regression of the first difference in log GDP per capita on the first difference in outcomes. The “Differences + Fixed effects” presents the basic random trends model (the first difference model plus a province fixed effect). “Controls 1” includes the first differences of average age and sex composition for each province per year, plus, for the education outcomes (columns 4, 5 and 6), a series of indicators for the partial and full implementation of an educational reform (“Ley Federal de Educación”). “Controls 2” includes changes in the following indicators for each province: the unemployment rate; the proportion of the population in different age groups (5, 6-12, 13-17, 18-24 and 25-60) for poverty and education indicators; and the proportion of women aged 13 to 20 with respect to the total number of women between 13 and 49 (for health outcomes). The VEC (Vector Error Correction) models correspond to a regression of the difference in outcome as the dependent variable against the first difference in log GDP per capita, the first lag of the outcome and the first lag of the per capita GDP. Fixed effects and controls follow the pattern of the previous panel. The “Detrended (Cubic)” is a regression of residuals obtained by regressing the outcome of interest and log GDP per capita on a constant plus a cubic time trend. The following row presents a regression of the deviation of the outcome of interest and the log of GDP per capita with respect to their Hodrick-Prescott filter trends.
for the education variables in the alternative specifications, with the exception of a small increase in primary school attendance when GDP grows.
c. Social public expenditure, health and education outcomes
The results discussed so far are robust to a series of changes in control variables and specifications. While health outcomes seem to be significantly affected by aggregate fluctuations in Argentina for the period 1993-2005, the results do not provide evidence on the plausible mechanisms linking the two. Related studies have investigated these mechanisms, and have established that public expenditure can play a significant role. For instance, Bhalotra (2010) suggests that in India the counter-cyclicality of infant mortality in rural India is related to the pro-counter-cyclicality of state health expenditure, while Paxson and Schady (2005) attribute part of the increase in infant mortality in Peru to the decline in public and private health expenditure during major crisis.
Only partial evidence for the period under study is available for Argentina. Using a sample of provinces as in this study, Rucci (2004b, Chapter 1) attributes part of the decline in infant mortality from 1991-99 to public health programs and to the increase in the number of healthcare facilities. While comparable information by province is not available for the 1993-2005 period, there are detailed records of provincial total public expenditure, including a breakdown by category of social expenditure (DGSC, 2007).
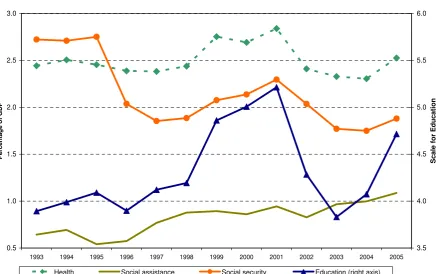
[FIGURE 3 ABOUT HERE]
This information is summarized in Figure 3, which presents social public expenditure by category as a percentage of GDP for the federal government (top panel) and for provincial governments (bottom panel). Social expenditure on health, education and social assistance fell substantially for both levels of government during the 2001-2002 downturn, with the exception of federal social assistance, which increased markedly due to the implementation of a massive emergency transfer program (Cruces and Gasparini, 2008).
[TABLE 5 ABOUT HERE]
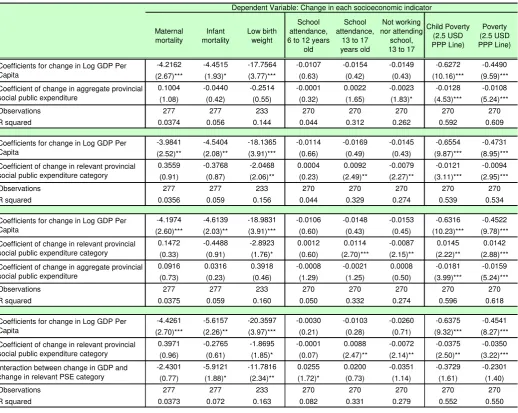
additional source of variability to provide evidence on the relationship between public expenditure and the outcomes of interest. The first regression indicates that changes in aggregate provincial social public expenditure are significantly related to aggregate and child poverty levels (over and above changes in provincial GDP), but are not correlated with the outcomes of interest, with the exception of a negative and weakly significant association with the proportion of children neither working nor attending school.
In the second panel, the social expenditure variable in each regression includes only the relevant category for each outcome.16 These results are compelling: The change in low birth weight incidence is significantly and negatively correlated with changes in provincial public health expenditure, while increases in education expenditure are correlated with higher enrollment rates for those aged 13 to 17, and with lower levels for the proportion of youngsters not working nor attending school. The size of the coefficient for low birth weight indicates that a decrease in public health expenditure of 0.5 percent of GDP (roughly the average decline for provincial governments over the 2001-2002 crisis) the number of cases would increase in 1.02, a change of about 1.4 percent in the rate with respect to the average over the 1993-2006 period (72.5).
The third panel includes the relevant and total social expenditure (excluding the relevant category) in the same regression. The latter is only significantly different from zero for the poverty indicators, providing further evidence that the correlation of expenditure with outcomes originates from the specific expenditure categories. Finally, the regressions in the bottom panel of Table 5 include an interaction between changes in GDP and changes in social expenditure. These results indicate that the effect of public health expenditure on low birth weight is larger when accompanied by changes in GDP.
Relevant health (low birth weight) and education (enrollment for the 13-17 age group) outcomes appear to worsen with lower social expenditure levels, and to improve when these levels increase. These results are not sufficient to infer a causal link between poverty, health and education outcomes and public social expenditure. However, the lack of effect of aggregate expenditure and the significance of the correlations of the outcomes with the relevant specific categories support the plausibility of public expenditure as one of the mechanisms linking aggregate fluctuations with household
16 Provincial expenditure on health as a percentage of provincial GDP for health outcomes, provincial
welfare. These effects are also quantitatively substantial. A lax causal interpretation of the estimated correlations between outcomes and expenditure allows some simple calculations of the necessary increases in fiscal efforts to counterbalance the effects of the crisis. For instance, enrollment for teenagers fell by 2.7 percentage points in 2002-2003, and the corresponding expenditure elasticities imply that provincial education outlays should have increased by 2.9 percent of GDP to attain an increase in enrollment of the same magnitude. For health outcomes, the incidence of low birth weight increased in 8.8 cases per 1,000 live births during the period 1999-2003, and the estimated elasticities suggest that provincial health expenditure should have increased by 4.3 percent of GDP to counterbalance this effect.
4. DISCUSSION AND CONCLUSIONS
The results presented in this paper are in line with the current body of empirical evidence and the theoretical discussion regarding the effects of aggregate fluctuations on household welfare. In a middle-income country like Argentina, even deep crises have essentially no negative effect on schooling outcomes (if anything, they have counter-cyclical effects), but can result in a decline in health status as witnessed by the increase in maternal and infant mortality and low birth weight. In terms of Ferreira and Schady’s (2009) framework, substitution effects seem to limit potential school dropout, while income effects appear to dominate for health outcomes. As in Baird et al. (2009), these results are asymmetric over the business cycle: Downturns exhibit much larger effects (in absolute value) than positive shocks. Also as in Baird et al. (2009), the estimated effects of aggregate fluctuations are partially due to the presence of a very large contraction (2001-2002) in the period under analysis.
obtained from microdata for a more limited period (Bózzoli and Quintana-Domeneque, 2010). Finally, school enrollment rates for youngsters aged 13 to 17 are positively correlated with education expenditure at the provincial level, while low birth weight is negatively and significantly associated with provincial public health expenditure. These results suggest that the limited availability of resources during a crisis period may constitute one of the transmission mechanisms between aggregate shocks and health outcomes, as found in studies for other countries (Bhalotra, 2010, for India, and Paxson and Schady, 2005, for Peru).
Overall, the results in this article provide evidence of the permanent effects of economic crises through increased mortality, and long term impacts through deteriorating health outcomes (low birth weight) with substantial consequences in terms of future income generating capacity (Alderman, Berhman and Hoddinott, 2004; Black, Devereux and Salvanes, 2007). The results support the notion that governments must take a proactive stance during aggregate crises, to not only strengthen income transfer safety nets; but to also expand the level of public social expenditure and maintain the quality of public services.
REFERENCES
Adúriz, I., Giovagnoli, P. I., & Fiszbein, A. (2003). Argentina’s crisis and its impact on household welfare. CEPAL Review, 79, 143-158.
Alderman, H., Berhman, J., & Hoddinott, J. (2004). In B. Lomborg (Ed.), Global
Crises, Global Solutions (pp 363-442). Cambridge: Cambridge University Press.
Alzúa, M. L., Gasparini, L. & Haimovich, F. (2010). Educational Reform and Labor Market Outcomes: the Case of Argentina’s Ley Federal de Educación. Working Paper No. 111, Centro de Estudios Distributivos Laborales y Sociales, Universidad Nacional de La Plata, Argentina.
Baird, S., Friedman, J., & Schady, N. (2007). Aggregate Income Shocks and Infant Mortality in the Developing World. Policy Research Working Paper No. 4346, The World Bank, Washington, D.C.
Baird, S., Friedman, J., & Schady, N. (2009). Aggregate Income Shocks and Infant Mortality in the Developing World. Review of Economics and Statistics,
(forthcoming).
Bhalotra, S. (2010). Fatal Fluctuations? Cyclicality in Infant Mortality in India. Journal
of Development Economics, 93 (1), 7-19.
Black, S. E., Devereux, P. J., & Salvanes, K. G. (2007). From the Cradle to the Labor Market? The Effect of Birth Weight on Adult Outcomes. The Quarterly Journal
of Economics, 122 (1), 409-439.
Bózzoli, C., & Quintana-Domeque, D. (2010). The Weight of the Crisis: Evidence From
Newborns in Argentina. Discussion Papers No. 5294, Institute for the Study of
Labor, Bonn, Germany.
Camacho, A. (2008). Stress and Birth Weight: Evidence from Terrorist Attacks.
American Economic Review, 98 (2), 511–515.
CEDLAS & The World Bank (2010). Socio-Economic Database for Latin America and the Caribbean (SEDLAC). Centro de Estudios Distributivos Laborales y Sociales and The World Bank LCR Poverty Group. Database available at: <http://sedlac.econo.unlp.edu.ar/eng/>.
Cruces, G., & Gasparini, L. (2008). Programas sociales: Integrando a la Población
Vulnerable. Working Paper No. 77, Centro de Estudios Distributivos Laborales
y Sociales, Universidad Nacional de La Plata, Argentina.
Cruces, G., & Wodon, Q. (2003). Argentina’s Crises and the Poor, 1995-2002.
Económica, 49 (1-2), 55-96.
Cutler, D. M., Knaul, F., Lozano, R., Méndez, O. & Zurita, B. (2002). Financial Crisis Health Outcomes, and Ageing: Mexico in the 1980s and 1990s. Journal of
Dehejia, R. H., & Lleras Muney, A. (2004). Booms, busts, and babies’ health. Quarterly
Journal of Economics, 119 (3), 1091-1130.
DIES (2009). Base de Datos de Estadísticas de Salud: Indicadores de Natalidad y Mortalidad. Dirección de Estadísticas e Información de la Salud, Ministerio de Salud de la Nación, Argentina. < www.deis.gov.ar>.
DGSC (2007). Series de Gasto Público Consolidado por Finalidad-Función (1980-2006). Última actualización: Septiembre de 2007. Dirección de Gastos Sociales Consolidados, Ministerio de Economía y Finanzas Públicas, Argentina. <www.mecon.gov.ar/peconomica/basehome/series_gasto.html>.
ECLAC (2009). Estimaciones de Producto Bruto Geográfico para Provincias de Argentina. Database available online at: <www.eclac.org/argentina/default.asp>. Economic Commission for Latin America and the Caribbean, Argentina Office.
Fallon, P. R., & Lucas, R. E. B. (2002). The Impact of Financial Crises on Labor Markets, Household Incomes, and Poverty: A Review of Evidence. World Bank
Research Observer, 17 (1), 21-45.
Ferreira, F. H. G., & Schady, N. (2009). Aggregate Economic Shocks, Child Schooling and Child Health. World Bank Research Observer 24(2): 147-181.
Friedman, J., & Duncan T. (2009). Psychological Health Before, During, and After an Economic Crisis: Results from Indonesia, 1993-2000. World Bank Economic
Review, 23 (1), 57-76.
Friedman, J., & Schady, N. (2009). How many more infants are likely to die in Africa as
a result of the global financial crisis?. Policy Research Working Paper No.
5023, The World Bank, Washington, D.C.
Galiani, S. (2009). Reducing Poverty in Latin America and the Caribbean. Working Paper No. 88, Centro de Estudios Distributivos Laborales y Sociales, Universidad Nacional de La Plata, Argentina.
Gasparini, L. & Cruces, G. (2010). A Distribution in Motion: The Case of Argentina A Review of the Empirical Evidence. In Luis Felipe López Calva and Nora Lustig,
Declining Inequality in Latin America: A Decade of Progress?. Washington,
DC: Brookings Institution Press.
Gasparini, L., Gutiérrez, F. & Tornarolli, L. (2007). Growth and Income Poverty in Latin America and the Caribbean: Evidence from Household Surveys. Review of
Income and Wealth 53 (2), pp. 209-245.
Gasparini, L., Cruces, G., & Tornarolli, L. (2011). A Turning Point? Recent Developments on Inequality in Latin America and the Caribbean. Economía,
INDEC (2009). Proyecciones de Población por Provincia. Instituto Nacional de Estadisticas y Censos, Ministerio de Economía y Finanzas Públicas, Argentina. <www.indec.gov.ar>.
Lokshin, M., & Ravallion, M. (2007). Lasting Impacts of Indonesia's Financial Crisis.
Economic Development and Cultural Change, 56 (1), 27-56.
López Bóo, F. (2008). How Do Crises Affect Schooling Decisions? Evidence from
Changing Labor Market Opportunities and a Policy Experiment. Research
Department Working Paper No. 653, Inter-American Development Bank, Washington D.C.
López Bóo, F. (2010a). In School or at Work? Evidence from a Crisis. Discussion
Papers No. 4692, Institute for the Study of Labor, Bonn, Germany.
López Bóo, F. (2010b). Returns to Education and Macroeconomic Shocks: Evidence
from Argentina. Discussion Papers No. 4753, Institute for the Study of Labor,
Bonn, Germany.
Lustig, N. (2000). Crises and the poor: socially responsible macroeconomics.
Economia: The Journal of the Latin American and Caribbean Economic
Association, 1 (1), 1-19.
McKenzie, D. (2003). How do Households Cope with Aggregate Shocks? Evidence from the Mexican Peso Crisis. World Development, 31 (7), 1179-1199.
McKenzie, D. (2004). Aggregate Shocks and Labour Market Responses: Evidence from Argentina’s Financial Crisis. Economic Development and Cultural Change, 52
(4), 719-758.
MECON (2009), Información sobre Cuentas Nacionales. Ministerio de Economía y Finanzas Públicas, Argentina. <www.mecon.gov.ar>.
Paxson, C. & Schady, N. (2005). Child Health and Economic Crisis in Peru. World
Bank Economic Review, 19 (2), 203-223.
Princz, J. (2008). El efecto de un año más de educación obligatoria sobre la
permanencia de los individuos en la escuela. Evidencia para Argentina entre
1995 y 2003. Unpublished Document, Universidad de San Andrés, Argentina.
Rucci, G. (2004a). Macro Shocks and Schooling Decisions: The Case of Argentina.
Unpublished document, University of California, Los Angeles.
Rucci, G. (2004b). The effects of macroeconomic shocks on the well-being of people in
developing countries. Unpublished doctoral dissertation, University of
California, Los Angeles.
Schady, N. (2004). Do Macroeconomic Crises Always Slow Down Human Capital Accumulation?. World Bank Economic Review, 18 (2), 131-154.
Schady, N. (2005). Do Macroeconomic Crises Affect Schooling and Child Health?
Schady, N. (2006). Early Childhood Development in Latin America and the Caribbean.
Economía: The Journal of the Latin American and Caribbean Economic
Association 6(2), 185-225.
Schady, N., & Smitz, M. F. (2009). Aggregate Economic Shocks and Infant Mortality: New Evidence for Middle-Income Countries. Economics Letters, 108 (2), pp.
145-148.
Tables
Table 1. Evolution of GDP and Outcomes of Interest.
Year Real GDP Per Capita (1993 Pesos) Maternal mortality Infant mortality Low birth weight School attendance, 6 to 12 years
old
School attendance,
13 to 17 years old
Not working nor attending
school, 13 to 17
Child Poverty (2.5 USD PPP Line) Poverty (2.5 USD PPP Line)
1993 6,973 4.6 22.9 68.5 97.9% 77.4% 13.2% 13.3% 7.5%
1994 7,286 3.9 22.0 67.7 98.2% 79.2% 12.9% 13.7% 7.8%
1995 6,992 4.4 22.2 69.2 98.6% 79.0% 15.0% 19.0% 10.7%
1996 7,291 4.7 20.9 . 98.8% 79.2% 15.5% 22.0% 12.5%
1997 7,792 3.8 18.8 72.1 98.9% 82.7% 12.4% 19.8% 11.2%
1998 8,002 3.8 19.1 70.1 99.0% 85.9% 9.4% 20.9% 11.6%
1999 7,648 4.1 17.6 70.9 99.3% 87.9% 8.3% 21.0% 12.2%
2000 7,508 3.5 16.6 72.0 99.1% 90.3% 7.1% 23.9% 14.3%
2001 7,105 4.3 16.3 73.7 98.6% 91.3% 6.4% 30.1% 18.7%
2002 6,270 4.6 16.8 77.8 99.3% 91.9% 6.2% 44.6% 29.2%
2003 6,761 4.4 16.5 79.7 98.7% 89.2% 8.9% 36.5% 24.5%
2004 7,302 4.0 14.4 75.6 98.6% 89.5% 8.2% 32.0% 19.9%
2005 7,897 3.9 13.3 72.6 99.1% 91.9% 6.4% 26.4% 15.7%
2006 8,482 4.8 12.9 71.9 99.2% 91.2% 6.5% 21.5% 12.5%
Source: GDP: National accounts (INDEC, 2009; MECON, 2009). Infant and maternal indicators: Dirección de Estadísticas e Información de Salud, Ministerio de Salud (DIES, 2009). Education and poverty: Authors’ calculations using data from the Encuesta Permanente de Hogares
(INDEC). Notes:
- per capita GDP at 1993 prices.
[image:24.595.38.558.79.287.2]- Maternal mortality: Per 10,000 live births. Infant mortality: Children up to one year old per 1,000 live births. Low birth weight: Children weighting less than 2,500 grams at birth per 1,000 live births.
Table 2. Coefficient of Variation of GDP and Outcomes of Interest at the Provincial Level.
Year Real GDP Per Capita (1993 Pesos) Maternal mortality Infant mortality Low birth weight School attendance, 6 to 12 years
old
School attendance,
13 to 17 years old
Not working nor attending
school, 13 to 17
Child Poverty (2.5 USD PPP Line) Poverty (2.5 USD PPP Line)
1993 0.67 0.67 0.22 0.22 0.017 0.082 0.42 0.52 0.57
1994 0.66 0.71 0.25 0.23 0.012 0.073 0.37 0.48 0.51
1995 0.67 0.64 0.24 0.08 0.009 0.066 0.39 0.41 0.45
1996 0.70 0.78 0.30 0.009 0.073 0.43 0.46 0.49
1997 0.69 0.75 0.25 0.09 0.008 0.070 0.38 0.44 0.48
1998 0.67 0.90 0.23 0.06 0.009 0.062 0.30 0.49 0.54
1999 0.68 0.71 0.26 0.11 0.006 0.058 0.44 0.47 0.51
2000 0.72 0.77 0.27 0.08 0.007 0.049 0.43 0.43 0.48
2001 0.71 0.80 0.29 0.09 0.010 0.047 0.45 0.44 0.48
2002 0.77 0.69 0.28 0.07 0.007 0.052 0.49 0.31 0.36
2003 0.72 0.64 0.28 0.07 0.011 0.054 0.51 0.37 0.40
2004 0.72 0.79 0.30 0.08 0.011 0.040 0.35 0.42 0.47
2005 0.73 0.74 0.28 0.09 0.007 0.044 0.37 0.49 0.51
Table 3. Fixed Effects Models of Provincial GDP Variation on Socioeconomic Outcomes. Maternal mortality Infant mortality Low birth weight School attendance, 6 to 12 years
old
School attendance,
13 to 17 years old
Not working nor attending
school, 13 to 17
Child Poverty (2.5 USD PPP Line) Poverty (2.5 USD PPP Line)
-3.9634 -4.5623 -18.4027 -0.0111 -0.0095 -0.0209 -0.6593 -0.4761
(3.69)*** (3.44)*** (4.42)*** (0.67) (0.68) (1.17) (8.91)*** (7.74)***
Observations 277 277 233 270 270 270 270 270
R squared 0.03 0.05 0.14 0.04 0.30 0.25 0.53 0.52
[image:25.595.38.559.426.662.2]-7.9795 2.9464 -16.0273 0.0159 -0.0201 -0.0485 -0.5291 -0.3620
(1.85)* (0.80) (1.67) (1.72)* (0.28) (0.80) (2.90)*** (2.90)***
-0.5981 -10.8543 -20.3715 -0.0338 -0.0006 0.0023 -0.7684 -0.5719
(0.19) (5.12)*** (1.97)* (1.14) (0.01) (0.04) (9.02)*** (6.04)***
Observations 277 277 233 270 270 270 270 270
R squared 0.04 0.08 0.14 0.06 0.30 0.25 0.53 0.53
Coefficients for negative changes in Log GDP Per Capita
Heterogeneous effects: Positive and negative GDP variation Dependent Variable: Change in each socioeconomic indicator
Coefficients for change in Log GDP Per Capita
Coefficients for positive changes in Log GDP Per Capita
Source: Authors’ estimations based on DIES (2009), ECLAC (2009), INDEC (2009) and MECON (2009).
Notes: Robust t statistics in parentheses, clustered at the province level. * Significant at 10%; ** significant at 5%; *** significant at 1% The regressions include controls for the first differences of average age and sex composition of each province per year, plus, for the education outcomes (columns 4, 5 and 6), a series of indicators for the partial and full implementation of an educational reform (“Ley Federal de Educación”).
Table 4. Robustness Checks - Provincial GDP Variation on Socioeconomic Outcomes.
Maternal mortality Infant mortality Low birth weight School attendance, 6 to 12 years
old
School attendance,
13 to 17 years old
Not working nor attending school, 13 to 17
Child Poverty (2.5 USD PPP Line) Poverty (2.5 USD PPP Line)
-3.8079 -4.7097 -17.3083 -0.0124 -0.0097 -0.0265 -0.6556 -0.4724
(3.64)*** (4.01)*** (4.38)*** (0.82) (0.41) (1.51) (8.14)*** (7.38)***
-3.9621 -4.9665 -17.5877 -0.0124 -0.0110 -0.0262 -0.6688 -0.4823
(3.79)*** (4.05)*** (4.48)*** (0.80) (0.45) (1.47) (8.77)*** (7.80)***
-3.9634 -4.5623 -18.4027 -0.0111 -0.0095 -0.0209 -0.6593 -0.4761
(3.69)*** (3.44)*** (4.42)*** (0.67) (0.68) (1.17) (8.91)*** (7.74)***
-4.2439 -4.4467 -19.8301 -0.0137 -0.0157 0.0049 -0.5877 -0.4226
(3.79)*** (3.11)*** (5.50)*** (0.66) (1.04) (0.36) (7.61)*** (6.58)***
-2.8916 -5.5282 -15.7351 -0.0084 0.0175 -0.0403 -0.6322 -0.4606
(2.49)** (5.58)*** (3.21)*** (0.71) (0.41) (1.01) (6.65)*** (6.24)***
-2.9183 -5.3031 -15.7295 -0.0089 0.0059 -0.0317 -0.6292 -0.4586
(2.42)** (5.08)*** (3.24)*** (0.66) (0.27) (1.24) (6.71)*** (6.27)***
-3.4403 -7.5828 -15.8016 -0.0010 0.0918 -0.1302 -0.6647 -0.4777
(3.47)*** (4.48)*** (2.91)*** (0.07) (1.74)* (2.55)** (9.12)*** (7.34)***
-3.4693 -5.3881 -19.0641 0.0073 -0.0224 -0.0109 -0.6678 -0.5044
(3.95)*** (4.49)*** (3.57)*** (0.57) (1.00) (0.82) (10.72)*** (8.79)***
Detrended (Cubic)
Detrended (Hodrick-Prescott) Differences + Fixed effects + Controls 1 (Main Specification) Differences + Fixed effects + Controls 1 + Controls 2
VEC Model + Fixed effects
VEC Model + Fixed effects + Controls1 Coefficients for change in Log GDP Per Capita (or detrended value) by type of model (each line from a different model):
Dependent Variable: Change in each socioeconomic indicator (or detrended value)
Differences
Differences + Fixed effects
Source: Authors’ estimations based on DIES (2009), ECLAC (2009), INDEC (2009) and MECON (2009).
Table 5. GDP Changes, Socioeconomic Outcomes and Provincial Social Expenditure. Maternal mortality Infant mortality Low birth weight School attendance, 6 to 12 years
old
School attendance,
13 to 17 years old
Not working nor attending
school, 13 to 17
Child Poverty (2.5 USD PPP Line) Poverty (2.5 USD PPP Line)
-4.2162 -4.4515 -17.7564 -0.0107 -0.0154 -0.0149 -0.6272 -0.4490
(2.67)*** (1.93)* (3.77)*** (0.63) (0.42) (0.43) (10.16)*** (9.59)***
0.1004 -0.0440 -0.2514 -0.0001 0.0022 -0.0023 -0.0128 -0.0108
(1.08) (0.42) (0.55) (0.32) (1.65) (1.83)* (4.53)*** (5.24)***
Observations 277 277 233 270 270 270 270 270
R squared 0.0374 0.056 0.144 0.044 0.312 0.262 0.592 0.609
-3.9841 -4.5404 -18.1365 -0.0114 -0.0169 -0.0145 -0.6554 -0.4731
(2.52)** (2.08)** (3.91)*** (0.66) (0.49) (0.43) (9.87)*** (8.95)***
0.3559 -0.3768 -2.0468 0.0004 0.0092 -0.0079 -0.0121 -0.0094
(0.91) (0.87) (2.06)** (0.23) (2.49)** (2.27)** (3.11)*** (2.95)***
Observations 277 277 233 270 270 270 270 270
R squared 0.0356 0.059 0.156 0.044 0.329 0.274 0.539 0.534
-4.1974 -4.6139 -18.9831 -0.0106 -0.0148 -0.0153 -0.6316 -0.4522
(2.60)*** (2.03)** (3.91)*** (0.60) (0.43) (0.45) (10.23)*** (9.78)***
0.1472 -0.4488 -2.8923 0.0012 0.0114 -0.0087 0.0145 0.0142
(0.33) (0.91) (1.76)* (0.60) (2.70)*** (2.15)** (2.22)** (2.88)***
0.0916 0.0316 0.3918 -0.0008 -0.0021 0.0008 -0.0181 -0.0159
(0.73) (0.23) (0.46) (1.29) (1.25) (0.50) (3.99)*** (5.24)***
Observations 277 277 233 270 270 270 270 270
R squared 0.0375 0.059 0.160 0.050 0.332 0.274 0.596 0.618
-4.4261 -5.6157 -20.3597 -0.0030 -0.0103 -0.0260 -0.6375 -0.4541
(2.70)*** (2.26)** (3.97)*** (0.21) (0.28) (0.71) (9.32)*** (8.27)***
0.3971 -0.2765 -1.8695 -0.0001 0.0088 -0.0072 -0.0375 -0.0350
(0.96) (0.61) (1.85)* (0.07) (2.47)** (2.14)** (2.50)** (3.22)***
-2.4301 -5.9121 -11.7816 0.0255 0.0200 -0.0351 -0.3729 -0.2301
(0.77) (1.88)* (2.34)** (1.72)* (0.73) (1.14) (1.61) (1.40)
Observations 277 277 233 270 270 270 270 270
R squared 0.0373 0.072 0.163 0.082 0.331 0.279 0.552 0.550
Coefficients for change in Log GDP Per Capita
Coefficient of change in relevant provincial social public expenditure category
Interaction between change in GDP and change in relevant PSE category Coefficients for change in Log GDP Per Capita
Coefficient of change in relevant provincial social public expenditure category
Coefficient of change in aggregate provincial social public expenditure
Coefficients for change in Log GDP Per Capita
Coefficient of change in relevant provincial social public expenditure category
Dependent Variable: Change in each socioeconomic indicator
Coefficients for change in Log GDP Per Capita
Coefficient of change in aggregate provincial social public expenditure
Source: Authors’ estimations based on DGSC (2007), DIES (2009), ECLAC (2009), INDEC (2009) and MECON (2009). Notes: Robust t statistics in parentheses. * Significant at 10%; ** significant at 5%; *** significant at 1%
Figures
Figure 1. Evolution of National Gross Domestic Product and Poverty Levels, Argentina (1993-2009).
200 220 240 260 280 300 320 340 360 380 400
I 93 IV 93 III 94 II 95 I 96 IV 96 III 9
7 II 9
8
I 99 IV 99 III 0
0 II 0
1
I 02 IV 02 III 0
3 II 0
4
I 05 IV 05 III 0
6 Bi llio ns of 1993 peso s 5 10 15 20 25 30 P e rce n ta ge of the popu la tion u nder th e p o v e rty line
GDP (Quarterly, seasonally adjusted) Poverty (2.5 USD PPP Line)
Source: GDP: national accounts (INDEC, 2009; MECON, 2009). Poverty: Authors’ calculations using data from the Encuesta Permanente de Hogares (INDEC).
Figure 2. GDP and Poverty Changes.
-0.15 -0.10 -0.05 0.00 0.05 0.10
1994 1995 1996 1997 1998 1999 2000 2001 2002 2003 2004 2005 2006
Change in poverty headcount (2.5 USD PPP Line), percentage points, inverted Percentage change in GDP per capita
[image:27.595.43.439.445.727.2]Figure 3. Social Expenditure as a Proportion of GDP.
a. Federal government
0.5 1.0 1.5 2.0 2.5 3.0
1993 1994 1995 1996 1997 1998 1999 2000 2001 2002 2003 2004 2005 2006
P e rc e n ta ge of GD P 4.5 5.0 5.5 6.0 6.5 7.0 S c a le fo r S o cia l se cu rity
Education Health Social assistance Social security (right axis)
b. Provincial governments
0.5 1.0 1.5 2.0 2.5 3.0
1993 1994 1995 1996 1997 1998 1999 2000 2001 2002 2003 2004 2005
P e rc e n ta ge of GD P 3.5 4.0 4.5 5.0 5.5 6.0 S cal e for Edu ca tion
Health Social assistance Social security Education (right axis)