Ramírez-López G, Flores-Aldana M, Salmerón J. Associations between dietary patterns and metabolic syndrome in adolescents. Salud Publica Mex. 2019;61:619-628. https://doi.org/10.21149/9541
Ramírez-López G, Flores-Aldana M, Salmerón J. Asociación entre patrones de alimentación y síndrome metabólico en adolescentes. Salud Publica Mex. 2019;61:619-628. https://doi.org/10.21149/9541
Associations between dietary patterns and
metabolic syndrome in adolescents
Guadalupe Ramírez-López, DSc,
(1)Mario Flores-Aldana, PhD,
(2)Jorge Salmerón, DSc.
(3,4)(1) Unidad de Investigación Epidemiológica y en Servicios de Salud del Adolescente, Instituto Mexicano del Seguro Social. Tonalá, Jalisco, México. (2) Centro de Investigación en Nutrición y Salud, Instituto Nacional de Salud Pública. Cuernavaca, Morelos, México.
(3) Centro de Investigación en Políticas, Población y Salud, Facultad de Medicina, Universidad Nacional Autónoma de México. Ciudad de México, México. (4) Centro de Investigación en Salud Poblacional, Instituto Nacional de Salud Pública. Cuernavaca, Morelos, México.
Received on: March 7, 2018 • Accepted on: April 30, 2019
Corresponding author: Guadalupe Ramírez-López. Av. Tonalá 121. 45400 Tonalá, Jalisco, México. E-mail: [email protected]
Abstract
Objective. Evaluate association of dietary patterns with
metabolic syndrome (MetS) and metabolic markers.
Mate-rials and methods. 654 adolescents from Guadalajara,
Jalisco, participated in a cross-sectional study. Diet was
evalu-ated using a food frequency questionnaire; 24 food groups
were integrated, and dietary patterns were derived using
cluster analysis. MetS was defined according to International
Diabetes Federation (IDF), Cook and colleagues, Ford and
colleagues, and de Ferranti and colleagues criteria.
Results.
Dietary patterns identified were: “DP1”, “DP2”, and “DP3”.
Among males, “DP3” was associated with MetS (Cook and
collaborators) (OR, 12.14; 95%CI, 1.66-89.05),
hypertriglyc-eridemia (OR, 3.89; 95%CI, 1.01-15.07), and insulin resistance
(OR, 6.66; 95%CI, 1.12-39.70). “DP2” was associated with
abdominal obesity (OR, 5.11; 95%CI, 1.57-16.66).
Conclu-sions. “DP3” entertained a greater risk of MetS,
hypertri-glyceridemia, and insulin resistance, while “DP2” possessed
a greater risk of abdominal obesity among adolescent males.
Keywords: metabolic syndrome; dietary patterns; fast foods;
sugar-sweetened beverages; adolescents
Resumen
Objetivo. Evaluar la asociación de patrones dietarios (PD)
con síndrome metabólico (SM) y marcadores metabólicos.
Material y métodos. Estudio transversal con 654
adoles-centes. Dieta evaluada con el cuestionario “frecuencia de
con-sumos de alimentos”; se identificaron 24 grupos de alimentos,
para obtener PD mediante análisis de conglomerados. SM se
definió según los criterios: Federación de Diabetes
Interna-cional (IDF), Cook y colaboradores, Ford y colaboradores y
Ferranti y colaboradores.
Resultados. Se identificaron tres
PD: “PD1”, “PD2” y “PD3”. En hombres, “PD3” se asoció con
SM (Cook y colaboradores) (RM, 12.14; IC95%, 1.66-89.05),
hipertrigliceridemia (RM, 3.89; IC95%, 1.01-15.07) y
resisten-cia a insulina (RM, 6.66; IC95%, 1.12-39.70). El patrón “PD2”
se asoció con obesidad abdominal (RM, 5.11; IC95%,
1.57-16.66).
Conclusiones. El patrón “PD3” aumenta el riesgo
de SM, hipertrigliceridemia y resistencia a insulina y el “PD2”
el riesgo de obesidad abdominal en adolescentes hombres.
T
he prevalence of metabolic syndrome (MetS) in
Mexican adolescents is higher (6.5-19.2%)
1,2than in
other ethnic groups (4.5%).
3Diet and physical activity
play a role in the development of MetS.
4Dietary patterns (DP) are defined as “nutritional
variables grouped according to some nutritional criteria,
in which variables are reduced into a smaller number
of variables through statistical manipulation”.
5DP have
the advantage of evaluating the potential synergistic
effects of foods and nutrients and of reducing
epide-miological limitations in comparison with single-food
or nutrient approaches. Dietary guidelines might be
focused on a food-based approach and not only on a
nutrient-based approach that is unclear and favors the
consumption of industrialized products designed to
meet individual nutrient goals rather than achieving a
healthy diet.
6In adults, DP predict obesity, MetS, and other
chronic diseases; nevertheless, some inconsistencies
exist.
5,7,8In adolescents, some reports suggest that a
“Western” or “obesogenic” DP is positively associated
with overweight.
9Others failed to detect such
associa-tion
10or with MetS.
11Moreover, an inverse association
between the “fast food and sweet” DP and obesity was
reported.
12More studies are needed in adolescents
be-cause they have unique nutritional needs and cultural
particularities and the still existing inconsistencies
re-quire further evaluation. We evaluated the association of
DP with MetS and metabolic markers (insulin resistance
[IR] and lipids) in adolescents.
Materials and methods
We conducted a cross-sectional study in public high
schools in Guadalajara, Jalisco, Mexico. Adolescents
who were willing to participate were included in the
study (
n
= 681). Participation rate was 89.3%.
Partici-pants with incomplete data (
n
= 9), or with implausible
total energy intake (<800 kcal/day or >6 000 kcal/
day) (
n
= 18) were excluded from analysis. Finally, 654
participants were included. Previous studies including
some of these participants have been reported.
13The
Institutional Review Board of the Mexican Institute of
Social Security approved the protocol. Written informed
consent was obtained from all the participants and their
parents.
Questionnaires and anthropometric measurements
were performed by nutritionists. After five minutes of
rest, two systolic blood pressure (SBP) and diastolic blood
pressure (DBP) readings were taken with a digital
bau-manometer (Omron
HEM–751; Vernon Hills, IL, USA).
A venipuncture blood sample was collected after a
12-h fast. Serum samples were centrifuged and stored
at –80
oC until analysis. Glucose levels were determined
with the hexokinase method in an automated system
(Synchron CX4; Beckman Coulter, Inc., Brea, CA, USA)
and insulin with an immunometric method
utiliz-ing an Immulite 2000 analyzer (Diagnostic Products
Co., Los Angeles CA, USA). IR was estimated with
HOMA-IR= fasting insulin (μU/ml) × fasting glucose
(mmol/l)/22.5. Total cholesterol and triglycerides were
estimated by conventional enzymatic procedures.
High-density lipoprotein-cholesterol (HDL-C) and
low-den-sity lipoprotein-cholesterol (LDL-C) were determined
directly by immunochemical methods utilizing an ILab
300 Plus analyzer (Instrumentation Laboratory, Ltd.,
Birchwood, Warrington, UK).
Assessment of exposure variables
Diet was assessed using a semi-quantitative
food-frequency questionnaire (FFQ).
14The questionnaire
included 116 food items with eight options of frequency
consumption (ranging from never to four or more times
per day) in the previous year. For each food item, a
com-monly used portion was used. Food or beverage intake
was computed multiplying food frequency
consump-tion by the specific porconsump-tion size of each food item. Food
and beverages were converted into total daily energy,
macro and micronutrient intake with the Evaluation
System of Nutritional Habits and Nutrient Intake.
15In order to identify the DP, foods were first
integrat-ed into 24 mutually exclusive food groups; the criteria
for integrating a food group was based on macronutrient
composition, as well as on other components (dietary
fiber, sucrose content, culinary aspects, or traditional
foods). The food groups employed are listed in table I.
DP were derived using cluster analysis, which allows
reducing data into patterns according to individual
dif-ferences in mean intakes.
5Energy percent values were
obtained for each food group as follows: percentage
of energy intake for a food group = � (energy intake
of each food in a food group X 100/daily total energy
intake).
7The percentage of energy intake value for
each food group was standardized (z-scores) for their
entry into cluster analysis. We used a k-means method,
which partitions subjects into clusters that maximize
the Euclidian distance among clusters. We selected a
three-cluster solution based on its size, ease of dietary
interpretation, and according to our knowledge of the
Mexican diet.
often did you eat away from home last year? (<1 a week,
1-3 times a week, 4-6 times a week, daily). During the
last year, did you take vitamins? (yes/no). Where did
you more frequently eat hamburgers, hot dogs, pizza?
(home, fast-food restaurant, school, another place).
When you eat chicken, do you remove its skin? (yes/
no). When you eat meat, do you remove its fat? (yes/
no). How many teaspoons of sugar do you add to your
drinks to sweeten them?
Assessment of covariates
Smoking was defined as at least one cigarette/day
during the past month.
16Pubertal development was
defined according to Tanner stages.
17Overweight and
obesity were defined according to International Obesity
Task Force criteria and body fat percentage, with the
Slaughter equation.
18Physical activity was evaluated
with a Questionnaire on Physical Activity and Inactivity
in Mexican Children.
19Assessment of outcome variables
MetS was defined according to International Diabetes
Federation (IDF) criteria. For adolescents aged 10-15
years, abdominal obesity (AO) (waist circumference
[WC] ≥90
thpercentile for age and sex), and two or more
of the following: glucose ≥100 mg/dl; triglycerides ≥150
mg/dl; HDL-C <40 mg/dl, and SBP >130 mmHg or
DBP >85 mmHg. For adolescents aged ≥16 years, AO
Table I
F
oodgroupsusedindietarypatternanalysis. g
uadalajara, j
alisco, 2003
Food group Food ítems
Fast food Hamburger, hot dog, pizza, sandwich, torta
Mexican food Hot maize beverage (atole), quesadilla, pozole, tacos, tamal, tostada Whole-fat dairy product Whole-fat cheese, whole-fat milk, whole-fat yoghurt
Meat Beef, ham, lamb, liver, pork, sausage, shrimp Sweetened beverages Soda, sweetened beverages, sweetened juice Sweet baked goods Cake, cookie, french toast, hot cake, pastry
Tortilla Maize tortilla
Fruits Apple, banana, grapes, guava, jicama, lime, mandarine, mango, melon, orange, orange juice, papaya, peach, pear, pineapple, plum, prickly pear, strawberry, watermelon
Legumes and seeds Beans, chickpea, lentils, peanuts
Refined grains Breakfast cereal, pasta, potato, rice, wheat tortilla, white bread Milk beverages Biónico, milkshake
Sweets with fat Chocolate bar, powder chocolate, ice cream
Snacks Chips, potato chips
Sweets Candy, cajeta, jam, jelly
Vegetables Beetroot, broccoli, carrot, cauliflower, chilli, courgette, cucumber, lettuce, nopal, onion, pea, spinach, string bean, tomato, zucchini
Wholegrains Corn, high-fibre ready-to-eat cereal, oat, wholemeal bread, wholemeal tortilla
Egg Eggs
Fish Canned tuna, sardine, other fish
Butter Bacon, butter, cream, cream cheese, margarine
Poultry Chicken
Low-fat dairy product Low-fat cheese, low-fat milk Alcohol Beer, wine, spirits
Avocado Avocado
(WC ≥90 cm [males] and ≥80 cm [females]), and two or
more of the following: glucose ≥100 mg/dl; triglycerides
≥150 mg/dl; HDL-C <40 mg/dl (males) or <50 mg/dl
(females), and SBP >130 mmHg or DBP >85 mmHg.
20Other MetS definitions for adolescents were used;
these include three or more of the following criteria.
Cook and collaborators definition: WC ≥90
thpercen-tile for age and sex; glucose ≥110 mg/dl; triglycerides
≥110 mg/dl; HDL-C ≥40 mg/dl, and SBP or DBP, ≥90
thpercentile for age, sex, and height.
21De Ferranti and
collaborators definition: WC >75th percentile for age
and sex; glucose ≥110 mg/dl; triglycerides ≥100 mg/dl;
HDL-C <45 mg/dl (15-19 years, males) and <50 mg/
dl (everyone else), and SBP or DBP >90th percentile
for age, sex, and height.
22Ford and collaborators
defi-nition: WC ≥90th percentile for age and sex; glucose
≥100 mg/dl; triglycerides ≥110 mg/dl; HDL-C ≤40 mg/
dl, and SBP or DBP, ≥90th percentile for age, sex and
height.
23Metabolic markers. High total cholesterol was
de-fined as ≥200 mg/dl, high LDL-C as ≥130 mg/dl,
24high
insulin as ≥15.05
m
U/ml, and HOMA-IR as ≥3.43.
25Statistical analysis
Descriptive analysis included means (SD), medians (25
thpercentile, 75
thpercentile) and percentages. Student’s
t
test to evaluate mean differences, Kruskal-Wallis to
evaluate median differences and Dunn´s test for
multi-ple comparisons. Chi-squared test or Fisher exact test to
evaluate differences in percentages. The associations of
DP with MetS and with metabolic markers were
evalu-ated using crude and multivariate logistic regression
analyses. First, interactions of DP with covariates were
evaluated using logistic regression models. If an effect
modifier was identified, multiple logistic regressions
were run after stratifying by the specific effect modifier.
Adjustments were performed by sexual development,
smoking, body fat, total physical activity, and energy
consumption. Statistical analyses were realized with
STATA v9.2 (Stata Corp., TX, USA) and SigmaSTAT 4.0
(Systat Software Inc., CA, USA). A
p
value of <0.05 was
considered as statistically significant.
Results
Mean age of the participants was 15.8 ± 1.0 years, 51.7%
were women, 28.8% were overweight or obese. MetS
prevalence according to different definitions was: 5.1%
(IDF); 7.2% (Cook and collaborators); 8.1% (Ford and
collaborators), and 16.4% (Ferranti and collaborators).
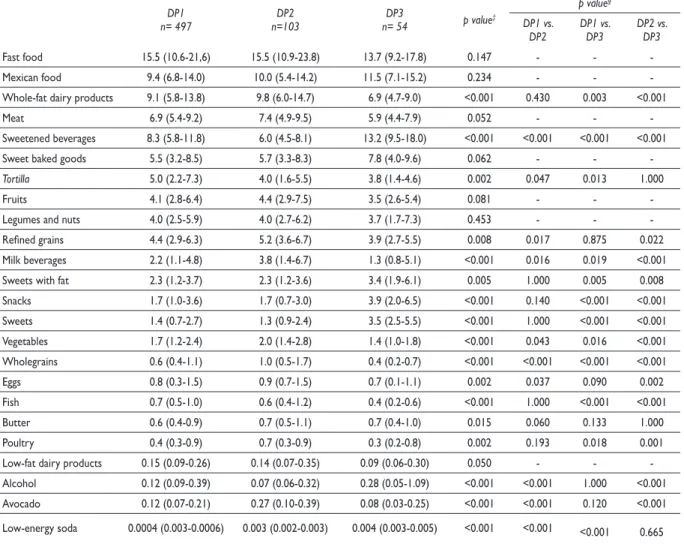
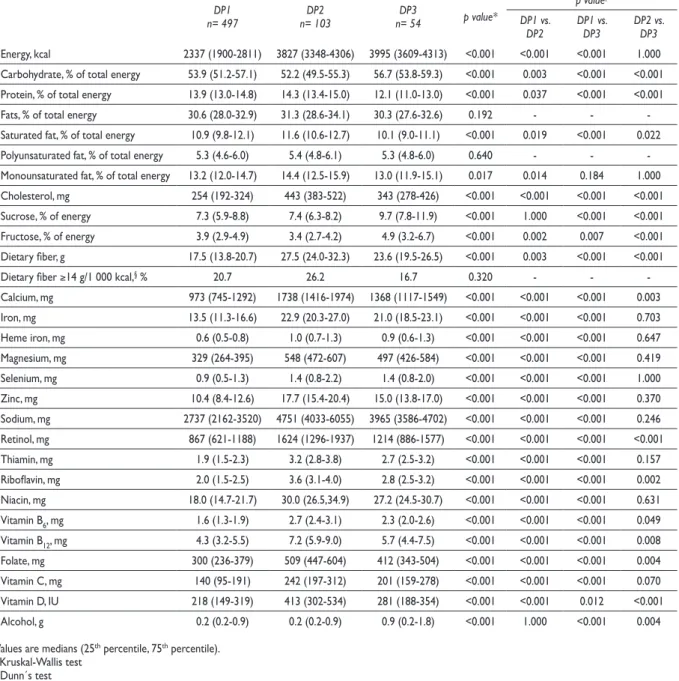
Three DP were identified (table II): 1) “DP1”,
charac-terized by lower energy intake and lower consumption
of cholesterol; 2) “DP2”, characterized by higher intake
of protein, cholesterol, saturated fats, sodium, dietary
fiber, vitamins, and minerals, and 3) “DP3”,
character-ized by higher energy, carbohydrate, sucrose, fructose,
and alcohol intake and lower protein intake (table III).
Regarding food composition, the “DP1” was
character-ized by
tortilla
, the “DP2” by whole fat dairy products,
meat, refined grains, fruits, and milk beverages, and, the
“DP3”, by Mexican food, sweetened beverages, sweet
baked goods, sweets with fat, snacks, sweets, and
alco-hol. It is noteworthy that the energy intake of unhealthy
foods (fast foods, sweetened beverages, sweet baked
goods, sweets with fat, snacks, sweets, and alcohol) was
high in the three DP, being highest in the “DP3” (49.3%),
then the “DP1” (40.2%), and finally, the “DP2” (36.9%).
Contrariwise, the energy intake of healthy foods (legumes
and nuts, fruits, vegetables, wholegrains,
tortilla
, eggs,
fish, poultry, low-fat dairy products, and avocado) was
low in the three DP: 17.1% in the “DP3”, 21.2% in the
“DP1”, and finally, 20.1% in the “DP2”.
Adolescents consuming mainly the “DP3” were
older, mainly female, smokers and physically active
(
p
<0.05 for all, data not shown).
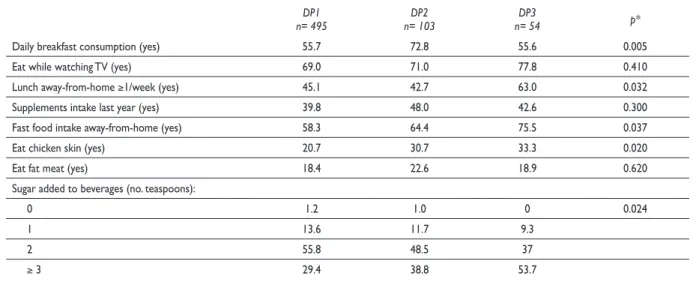
Unhealthy eating habits were different according
to DP; more than one half of adolescents who skipped
breakfast were in the “DP1” or in the “DP3”.
More-over, lunch away-from-home, fast food consumption
away-from-home, eating chicken skin and adding ≥3
teaspoons of sugar to beverages was higher in the “DP3”
(
p
<0.05 for all) (table IV). The remaining eating habits
did not differ among dietary groups.
Finally, interactions between sex and DP were
found (
p
<0.05); therefore, multiple logistic regression
analyses were performed after stratifying by sex. Among
males, the “DP3” was associated with MetS (Cook and
colleagues OR, 12.14; 95%CI, 1.66-89.05; de Ferranti and
colleagues OR, 5.10; 95%CI, 1.20-21.72, and Ford and
col-leagues OR, 9.29; 95%CI, 1.44-59.73), high triglycerides
(OR, 3.89; 95%CI, 1.01-15.07), and HOMA-IR (OR, 6.66;
95%CI, 1.12-39.70). Also, the “DP2” was associated with
AO (OR, 5.11; 95%CI, 1.57-16.66). Females showed no
statistically significant association (table V).
Discussion
Our results suggest that DP are associated in different
ways with obesity and MetS, and the “DP3” has the
greatest risk of MetS, hypertriglyceridemia, and IR,
while the “DP2” exhibits a greater risk of AO among
adolescent males, but not among females.
Table II
p
ercentageoFenergycontributionoFFoodgroupsbydietary patterns.* g
uadalajara, j
alisco, 2003
DP1
n= 497 n=103DP2 n= 54DP3 p value‡
p value§ DP1 vs.
DP2 DP1 vs. DP3 DP2 vs. DP3
Fast food 15.5 (10.6-21,6) 15.5 (10.9-23.8) 13.7 (9.2-17.8) 0.147 - -
-Mexican food 9.4 (6.8-14.0) 10.0 (5.4-14.2) 11.5 (7.1-15.2) 0.234 - -
-Whole-fat dairy products 9.1 (5.8-13.8) 9.8 (6.0-14.7) 6.9 (4.7-9.0) <0.001 0.430 0.003 <0.001
Meat 6.9 (5.4-9.2) 7.4 (4.9-9.5) 5.9 (4.4-7.9) 0.052 - -
-Sweetened beverages 8.3 (5.8-11.8) 6.0 (4.5-8.1) 13.2 (9.5-18.0) <0.001 <0.001 <0.001 <0.001
Sweet baked goods 5.5 (3.2-8.5) 5.7 (3.3-8.3) 7.8 (4.0-9.6) 0.062 - -
-Tortilla 5.0 (2.2-7.3) 4.0 (1.6-5.5) 3.8 (1.4-4.6) 0.002 0.047 0.013 1.000
Fruits 4.1 (2.8-6.4) 4.4 (2.9-7.5) 3.5 (2.6-5.4) 0.081 - -
-Legumes and nuts 4.0 (2.5-5.9) 4.0 (2.7-6.2) 3.7 (1.7-7.3) 0.453 - -
-Refined grains 4.4 (2.9-6.3) 5.2 (3.6-6.7) 3.9 (2.7-5.5) 0.008 0.017 0.875 0.022 Milk beverages 2.2 (1.1-4.8) 3.8 (1.4-6.7) 1.3 (0.8-5.1) <0.001 0.016 0.019 <0.001 Sweets with fat 2.3 (1.2-3.7) 2.3 (1.2-3.6) 3.4 (1.9-6.1) 0.005 1.000 0.005 0.008 Snacks 1.7 (1.0-3.6) 1.7 (0.7-3.0) 3.9 (2.0-6.5) <0.001 0.140 <0.001 <0.001 Sweets 1.4 (0.7-2.7) 1.3 (0.9-2.4) 3.5 (2.5-5.5) <0.001 1.000 <0.001 <0.001 Vegetables 1.7 (1.2-2.4) 2.0 (1.4-2.8) 1.4 (1.0-1.8) <0.001 0.043 0.016 <0.001 Wholegrains 0.6 (0.4-1.1) 1.0 (0.5-1.7) 0.4 (0.2-0.7) <0.001 <0.001 <0.001 <0.001
Eggs 0.8 (0.3-1.5) 0.9 (0.7-1.5) 0.7 (0.1-1.1) 0.002 0.037 0.090 0.002
Fish 0.7 (0.5-1.0) 0.6 (0.4-1.2) 0.4 (0.2-0.6) <0.001 1.000 <0.001 <0.001
Butter 0.6 (0.4-0.9) 0.7 (0.5-1.1) 0.7 (0.4-1.0) 0.015 0.060 0.133 1.000
Poultry 0.4 (0.3-0.9) 0.7 (0.3-0.9) 0.3 (0.2-0.8) 0.002 0.193 0.018 0.001
Low-fat dairy products 0.15 (0.09-0.26) 0.14 (0.07-0.35) 0.09 (0.06-0.30) 0.050 - - -Alcohol 0.12 (0.09-0.39) 0.07 (0.06-0.32) 0.28 (0.05-1.09) <0.001 <0.001 1.000 <0.001 Avocado 0.12 (0.07-0.21) 0.27 (0.10-0.39) 0.08 (0.03-0.25) <0.001 <0.001 0.120 <0.001
Low-energy soda 0.0004 (0.003-0.0006) 0.003 (0.002-0.003) 0.004 (0.003-0.005) <0.001 <0.001 <0.001 0.665
Values are medians (25th percentile, 75th percentile).
* Dietary patterns were derived using cluster analysis. DP1: lower in energy and cholesterol. DP2: higher in protein, cholesterol, saturated fat, sodium, dietary
fiber, vitamins and minerals. DP3: higher in energy, carbohydrate, sucrose, fructose, alcohol and lower in protein intake.
‡ Kruskal-Wallis test § Dunn´s test.
this study. Sucrose consumption was higher in the 75
thpercentile (11.9% of total energy). In this DP, compared
with the other two, sucrose consumption exceeds the
World Health Organization recommendation (≤10%
of total energy intake).
26In the Mexican adolescents
studied in Ensanut 2006, high-energy beverages (soft
drinks, sweetened juices,
aguas frescas
) accounted for
12.7% of the total kcal/day,
27a figure lower than in our
findings (13.2%) in the “DP3”. In Mexican adolescents
studied in the Health Workers Cohort Study, a Western
DP (characterized by soft drinks, snacks, and corn
tor-tillas) was found to be associated with IR.
28Some
stud-ies in adult populations suggest that unfavorable diets
(rich in sugar-sweetened beverages, fried potatoes, and
red and processed meats) are associated with glucose
and insulin;
29the consumption of fructose-sweetened
beverages decreases insulin sensitivity and increases
postprandial hypertriglyceridemia.
30In addition, one
or two servings/day of sugar-sweetened beverages
increase the risk for diabetes and MetS.
31We do not
Table III
e
nergyandnutrientsdailyintakeaccordingtodietarypatterns. g
uadalajara, j
alisco, 2003
DP1
n= 497 n= 103DP2 n= 54DP3 p value*
p value‡ DP1 vs.
DP2 DP1 vs. DP3 DP2 vs. DP3
Energy, kcal 2337 (1900-2811) 3827 (3348-4306) 3995 (3609-4313) <0.001 <0.001 <0.001 1.000 Carbohydrate, % of total energy 53.9 (51.2-57.1) 52.2 (49.5-55.3) 56.7 (53.8-59.3) <0.001 0.003 <0.001 <0.001 Protein, % of total energy 13.9 (13.0-14.8) 14.3 (13.4-15.0) 12.1 (11.0-13.0) <0.001 0.037 <0.001 <0.001 Fats, % of total energy 30.6 (28.0-32.9) 31.3 (28.6-34.1) 30.3 (27.6-32.6) 0.192 - - -Saturated fat, % of total energy 10.9 (9.8-12.1) 11.6 (10.6-12.7) 10.1 (9.0-11.1) <0.001 0.019 <0.001 0.022 Polyunsaturated fat, % of total energy 5.3 (4.6-6.0) 5.4 (4.8-6.1) 5.3 (4.8-6.0) 0.640 - - -Monounsaturated fat, % of total energy 13.2 (12.0-14.7) 14.4 (12.5-15.9) 13.0 (11.9-15.1) 0.017 0.014 0.184 1.000 Cholesterol, mg 254 (192-324) 443 (383-522) 343 (278-426) <0.001 <0.001 <0.001 <0.001 Sucrose, % of energy 7.3 (5.9-8.8) 7.4 (6.3-8.2) 9.7 (7.8-11.9) <0.001 1.000 <0.001 <0.001 Fructose, % of energy 3.9 (2.9-4.9) 3.4 (2.7-4.2) 4.9 (3.2-6.7) <0.001 0.002 0.007 <0.001 Dietary fiber, g 17.5 (13.8-20.7) 27.5 (24.0-32.3) 23.6 (19.5-26.5) <0.001 0.003 <0.001 <0.001
Dietary fiber ≥14 g/1 000 kcal,§ % 20.7 26.2 16.7 0.320 - -
-Calcium, mg 973 (745-1292) 1738 (1416-1974) 1368 (1117-1549) <0.001 <0.001 <0.001 0.003 Iron, mg 13.5 (11.3-16.6) 22.9 (20.3-27.0) 21.0 (18.5-23.1) <0.001 <0.001 <0.001 0.703 Heme iron, mg 0.6 (0.5-0.8) 1.0 (0.7-1.3) 0.9 (0.6-1.3) <0.001 <0.001 <0.001 0.647 Magnesium, mg 329 (264-395) 548 (472-607) 497 (426-584) <0.001 <0.001 <0.001 0.419 Selenium, mg 0.9 (0.5-1.3) 1.4 (0.8-2.2) 1.4 (0.8-2.0) <0.001 <0.001 <0.001 1.000 Zinc, mg 10.4 (8.4-12.6) 17.7 (15.4-20.4) 15.0 (13.8-17.0) <0.001 <0.001 <0.001 0.370 Sodium, mg 2737 (2162-3520) 4751 (4033-6055) 3965 (3586-4702) <0.001 <0.001 <0.001 0.246 Retinol, mg 867 (621-1188) 1624 (1296-1937) 1214 (886-1577) <0.001 <0.001 <0.001 <0.001 Thiamin, mg 1.9 (1.5-2.3) 3.2 (2.8-3.8) 2.7 (2.5-3.2) <0.001 <0.001 <0.001 0.157 Riboflavin, mg 2.0 (1.5-2.5) 3.6 (3.1-4.0) 2.8 (2.5-3.2) <0.001 <0.001 <0.001 0.002 Niacin, mg 18.0 (14.7-21.7) 30.0 (26.5,34.9) 27.2 (24.5-30.7) <0.001 <0.001 <0.001 0.631 Vitamin B6, mg 1.6 (1.3-1.9) 2.7 (2.4-3.1) 2.3 (2.0-2.6) <0.001 <0.001 <0.001 0.049 Vitamin B12, mg 4.3 (3.2-5.5) 7.2 (5.9-9.0) 5.7 (4.4-7.5) <0.001 <0.001 <0.001 0.008 Folate, mg 300 (236-379) 509 (447-604) 412 (343-504) <0.001 <0.001 <0.001 0.004 Vitamin C, mg 140 (95-191) 242 (197-312) 201 (159-278) <0.001 <0.001 <0.001 0.070 Vitamin D, IU 218 (149-319) 413 (302-534) 281 (188-354) <0.001 <0.001 0.012 <0.001 Alcohol, g 0.2 (0.2-0.9) 0.2 (0.2-0.9) 0.9 (0.2-1.8) <0.001 1.000 <0.001 0.004
Values are medians (25th percentile, 75th percentile). * Kruskal-Wallis test
‡ Dunn´s test § Chi square test
might play a key role in hepatic IR through activation
of the carbohydrate-responsive element-binding
pro-tein which prevents insulin from suppressing glucose
production and stimulates
de novo
lipogenesis.
32Furthermore, in our study, only 21.3% of
adoles-cents consumed the dietary fiber recommendation of at
least 14 g /1 000 kcal
33and no differences were found
between dietary patterns (“DP1”= 20.7%, “DP2” = 26.2%
and “DP3”= 16.7%;
p
= 0.320). These results are similar
to a study in Mexican adolescents in which almost 80%
did not consume the recommended dietary fiber.
28Table IV
e
atinghabitsbydietarypattern. g
uadalajara, j
alisco, 2003
DP1
n= 495 n= 103DP2 n= 54DP3 p*
Daily breakfast consumption (yes) 55.7 72.8 55.6 0.005
Eat while watching TV (yes) 69.0 71.0 77.8 0.410
Lunch away-from-home ≥1/week (yes) 45.1 42.7 63.0 0.032
Supplements intake last year (yes) 39.8 48.0 42.6 0.300
Fast food intake away-from-home (yes) 58.3 64.4 75.5 0.037
Eat chicken skin (yes) 20.7 30.7 33.3 0.020
Eat fat meat (yes) 18.4 22.6 18.9 0.620
Sugar added to beverages (no. teaspoons):
0 1.2 1.0 0 0.024
1 13.6 11.7 9.3
2 55.8 48.5 37
≥ 3 29.4 38.8 53.7
Values are percentages.
*Chi square test or Fisher´s exact test
NHANES 2011-2012 study was 16.9% and increased to
18.6% in obese.
34A study in Iranian adolescents found
that fast food consumption in the highest vs. the lowest
quartile increased the incidence of AO.
35On the other hand, we found that sodium and
sucrose intakes in the “DP3” were higher than in the
“DP1”. Previously, a three-times higher risk of
de-veloping MetS in the highest vs. the lowest quartile
of sweet and salty snacks was found in children and
adolescents.
36Additionally, Mexican school-children,
consuming a Western DP (high in sweetened beverages,
salty snacks, cakes, and sweets) had more overweight.
37Moreover, in USA adolescents, sweetened beverage
consumption increased 74 g/day per each additional
1g/salt/day.
38In a study in children from Mexico City,
salty-food consumption was mentioned as one of the
reasons for drinking soft sweetened drinks.
39Unfortu-nately energy-dense food consumption has increased in
children and adolescents; not only because these foods
are inexpensive, good-tasting, and available,
40but
be-cause of their ability to exert an effect on hedonic and
motivational processes.
41Additionally, unhealthy eating habits (skipping
breakfast, eating away-from-home, fast food
consump-tion away-from-home, eating chicken skin, and sugar
added to beverages) were higher in the “DP3” in our
study. An increase in the consumption of calories in
USA children and adolescents was found between 1977
and 2006: consumption away-from-home increased
255% during this period and fast foods contributed to
the largest energy intake from foods prepared
away-from-home.
42In Mexican children, the availability of
unhealthy foods (snacks, chocolates, sweets, sugary
drinks, and
antojitos
) on the way to school ranged from
22-31%, and foods and beverages eaten
away-from-home contributed to obesity increase.
43On the other
hand, Lebanese adolescents consuming a Western DP
were more likely to eat away-from-home and to skip
breakfast than the traditional DP.
44In our study, such
behaviors were more frequent in the “DP3”.
Sample size was higher in females than in males,
nevertheless, only significant associations were found in
males. We cannot establish a biological reason for this,
but in our adolescents
MetS prevalence according to
Cook and colleagues, was higher in males than females
(12.1 vs. 7.6%;
p
= 0.090), as well as according to Ford
and colleagues (11.1 vs. 5.3%;
p
= 0.007) and de Ferranti
and colleagues (19.7 vs. 14.2%;
p
= 0.061). Energy intake
was also higher among males than females (2 795 vs.
2 464 kcal/day;
p
<0.001). Others have found that, only
among males, an increase in the percentage of energy
from fat was associated with AO, and a Western DP
was associated with a higher risk of overweight and
hypertriglyceridemia.
9To the contrary, among Korean
prepubertal girls, a balanced DP was negatively
associ-ated with triglycerides and a Western DP was positively
associated with MetS.
45More studies evaluating these
associations according to sex are needed.
analy-Table V
a
djustedassociationbetweenmetabolicsyndromeanddietarypatternsbysex.
g
uadalajara, j
alisco, 2003
DP1 DP2 DP3
Reference ORadjusted 95%CI ORadjusted 95%CI
Males (n= 315) MetS components, IDF:
Abdominal obesity* 1.00 5.11 1.57-16.66‡ 3.33 0.50-22.13
High glucose§ 1.00 0.65 0.08-5.57 3.61 0.42-31.30
High triglycerides# 1.00 1.31 0.47-3.67 3.89 1.01-15.0&
Low HDL-C# 1.00 0.61 0.25-1.47 1.04 0.32-3.43
High blood pressure# 1.00 1.63 0.58-4.57 3.58 0.88-14.62
MetS definition:
IDF# 1.00 2.94 0.72-12.02 5.99 0.42-84.87
Cook et al.§ 1.00 0.81 0.16-4.16 12.14 1.66-89.0&
de Ferranti et al.∞ 1.00 1.22 0.47-3.18 5.10 1.20-21.7&
Ford et al.§ 1.00 0.81 0.17-3.79 9.29 1.44-59.7&
Other metabolic markers:
HOMA-IR# 1.00 1.60 0.43-5.93 6.66 1.12-39.70&
High insulin# 1.00 1.48 0.40-5.48 3.12 0.44-21.84
High total cholesterol# 1.00 0.50 0.13-1.88 0.71 0.12-4.29
High LDL-C# 1.00 0.60 0.17-2.08 0.26 0.03-2.53
Females (n= 334) MetS components, IDF:
Abdominal obesity# 1.00 0.97 0.16-5.67 2.06 0.37-11.65
High glucose# 1.00 Ø Ø 5.48 0.27-113
High triglycerides# 1.00 0.33 0.08-1.28 0.22 0.04-1.18
Low HDL-C# 1.00 0.90 0.36-2.24 1.50 0.58-3.92
High blood pressure# 1.00 0.53 0.11-2.47 0.23 0.02-2.13
MetS definition:
IDF# 1.00 0.50 0.03-9.32 2.24 0.14-34.70
Cook et al. 1.00 Ø Ø Ø Ø
de Ferranti et al.# 1.00 0.39 0.06-2.43 Ø Ø
Ford et al. 1.00 Ø Ø Ø Ø
Other metabolic markers:
HOMA-IR# 1.00 0.27 0.06-1.21 1.52 0.46-5.05
High insulin# 1.00 0.30 0.07-1.16 1.25 0.38-4.05
High total cholesterol∞ 1.00 0.60 0.24-1.50 0.34 0.10-1.18
High LDL-C# 1.00 0.36 0.12-1.13 0.36 0.11-1.21
MetS: metabolic syndrome; IDF: International Diabetes Federation; HDL-C: high density lipoprotein cholesterol; HOMA-IR: homeostatic model assessment index of insulin resistance; LDL-C: low density lipoprotein cholesterol.
*Adjusted by sexual development (II-IV/V), total physical activity (h/day), energy intake (kcal/day), and smoking (one or more cigarettes/day).
‡ p<0.01.
§ Adjusted by sexual development (II-IV/V), body fat (%), total physical activity (h/day), and energy intake (kcal/day).
#Adjusted by sexual development (II-IV/V), body fat (%), total physical activity (h/day), energy intake (kcal/day), and smoking (one or more cigarettes/day). & p<0.05
∞Adjusted by sexual development (II-IV/V), body fat (%), total physical activity (h/day), and smoking (one or more cigarettes/day).
sis cannot establish causal relationships. Thus, future
studies are required to answer this question. The FFQ
is widely used in epidemiological studies due to its
advantages; however, it overestimates consumption;
therefore, interpretation of results should be conducted
with caution. Although food groups were formed
ac-cording to their nutritional value, it is possible that
complete objectivity might not been achieved. Despite
such limitations, we found associations between obesity
(and MetS) and DP that are similar to those of previous
studies. On the other hand, the strengths of the study are
that confounders were controlled with multiple logistic
regressions.
In conclusion, we found that the “DP3” increased
the risk of MetS, hypertriglyceridemia, and IR, and that
the “DP2” increased the risk of AO in male adolescents.
Moreover, unhealthy eating habits were higher among
“DP3” consumers. Promotion of a healthy DP is needed
in order to reduce obesity and MetS in adolescents.
Acknowledgments
We thank students, parents, school authorities, and
those who participated in data collection. This study
was supported by Conacyt, grant 37951-M.
Declaration of conflict of interests. The authors declare that they have no conflict of interests.
References
1. Rodríguez-Morán M, Salazar-Vázquez B, Violante R, Guerrero-Romero F. Metabolic syndrome among children and adolescents aged 10-18 years. Diabetes Care. 2004;27(10):2516-17. https://doi.org/10.2337/diaca-re.27.10.2516
2. Halley-Castillo E, Borges G, Talavera JO, Orozco R, Vargas-Alemán C, Huitrón-Bravo G, et al. Body mass index and the prevalence of metabolic syndrome among children and adolescents in two Mexican populations. J Adolesc Health. 2007;40(6):521-6. https://doi.org/10.1016/j.jado-health.2006.12.015
3. Ford ES, Li C, Pearson WS, Mokdad AH. Prevalence of the metabolic syndrome among U.S. adolescents using the definition from the Interna-tional Diabetes Federation. Diabetes Care. 2008;31(3):587-9. https://doi. org/10.2337/dc07-1030
4. Pitsavos C, Panagiotakos D, Weinem M, Stefanadis C. Diet, exercise and the metabolic syndrome. Rev Diabet Stud. 2006;3(3):118-26. https://doi. org/10.1900/RDS.2006.3.118
5. Newby PK, Tucker KL. Empirically derived eating patterns using factor or cluster analysis: a review. Nutr Rev. 2004;62(5):177-203. https://doi. org/10.1111/j.1753-4887.2004.tb00040.x
6. Mozaffarian D, Ludwig DS. Dietary guidelines in the 21st century-a time for food. JAMA. 2010;304(6):681-2. https://doi.org/10.1001/ jama.2010.1116
7. Flores M, Macias N, Rivera M, Lozada A, Barquera S, Rivera-Dommarco J, et al. Dietary patterns in Mexican adults are associated with risk of
being overweight or obese. J Nutr. 2010;140(10):1869-73. https://doi. org/10.3945/jn.110.121533
8. Denova-Gutiérrez E, Castañón S, Talavera JO, Flores M, Macías N, Rodríguez-Ramírez S, et al. Dietary patterns are associated with different indexes of adiposity and obesity in an urban Mexican population. J Nutr. 2011;141(5):921-7. https://doi.org/10.3945/jn.110.132332
9. Song Y, Park MJ, Paik HY, Joung H. Secular trends in dietary patterns and obesity-related risk factors in Korean adolescents aged 10-19 years. Int J Obes (Lond). 2010;34(1):48-56. https://doi.org/10.1038/ijo.2009.203 10. Pérez-Rodrigo C, Gil Á, González-Gross M, Ortega RM, Serra-Majem L, Varela-Moreiras G, et al. Clustering of dietary patterns, lifestyles, and overweight among Spanish children and adolescents in the ANIBES Study. Nutrients. 2015;8(1):E11. https://doi.org/10.3390/nu8010011
11. Shang X, Li Y, Liu A, Zhang Q, Hu X, Du S, et al. Dietary pattern and its association with the prevalence of obesity and related cardiometabolic risk factors among Chinese children. PLoS One. 2012;7(8):e43183. https:// doi.org/10.1371/journal.pone.0043183
12. Araújo J, Teixeira J, Gaio AR, Lopes C, Ramos E. Dietary patterns among 13-y-old Portuguese adolescents. Nutrition. 2015;31(1):148-54. https://doi.org/10.1016/j.nut.2014.06.007
13. Ramírez-López G, Morán-Villota S, Mendoza-Carrera F, Portilla-de Buen E, Valles-Sánchez V, Castro-Martínez XH, et al. Metabolic and genetic markers’ associations with elevated levels of alanine aminotransferase in adolescents. J Pediatr Endocrinol Metab. 2018;31(4):407-14. https://doi. org/10.1515/jpem-2017-0217
14. Hernández-Avila M, Romieu I, Parra S, Hernández-Avila J, Madrigal H, Willett W. Validity and reproducibility of a food frequency questionnaire to assess dietary intake of women living in Mexico City. Salud Publica Mex. 1998;40(2):133-40.
15. Hernández-Ávila M, Resoles M, Parra S. Sistema de evaluación de hábitos nutricionales y consumo de nutrimentos (SNUT). Cuernavaca: Instituto Nacional de Salud Pública, 2000.
16. Marcus SE, Giovino GA, Pierce JP, Harel Y. Measuring tobacco use among adolescents. Public Health Rep. 1993;108(suppl 1):20-24. 17. Schlossberger NM, Turner RA, Irwin CE. Validity of self-report of pubertal maturation in early adolescents. J Adolesc Health. 1992;13(2):109-13.
18. Slaughter MH, Lohman TG, Boileau RA, Horswill CA, Stillman RJ, Van Loan MD, et al. Skinfold equations for estimation of body fatness in children and youth. Hum Biol. 1988;60(5):709-23.
19. Hernández B, Gortmaker SL, Laird NM, Colditz GA, Parra-Cabrera S, Peterson KE. Validez y reproducibilidad de un cuestionario de actividad e inactividad física para escolares de la ciudad de México. Salud Publica Mex. 2000;42(4):315-23.
20. Zimmet P, Alberti KG, Kaufman F, Tajima N, Silink M, Arslanian S, et al. IDF Consensus Group. The metabolic syndrome in children and ado-lescents -an IDF consensus report. Pediatr Diabetes. 2007;8(5):299-306. https://doi.org/10.1111/j.1399-5448.2007.00271.x
21. Cook S, Weitzman M, Auinger P, Nguyen M, Dietz WH. Prevalence of a metabolic syndrome phenotype in adolescents: findings from the third National Health and Nutrition Examination Survey, 1988-1994. Arch Pediatr Adolesc Med. 2003;157(8):821-27. https://doi.org/10.1001/archpe-di.157.8.821
22. De Ferranti SD, Gauvreau K, Ludwig DS, Neufeld EJ, Newburger JW, Rifai N. Prevalence of the metabolic syndrome in American adolescents: findings from the Third National Health and Nutrition Examination Survey. Circulation. 2004;110(16):2494-7. https://doi.org/10.1161/01. CIR.0000145117.40114.C7
23. Ford ES, Ajani UA, Mokdad AH. The metabolic syndrome and concentrations of C-reactive protein among U.S. youth. Diabetes Care. 2005;28(4):878-81. https://doi.org/10.2337/diacare.28.4.878
25. García-Cuartero B, García-Lacalle C, Jiménez-Lobo C, González-Vergaz A, Calvo-Rey C, Alcázar-Villar MJ, et al. Índice HOMA y QUICKI, insulina y péptido C en niños sanos. Puntos de corte de riesgo cardio-vascular. An Pediatr. 2007;66(5):481-90. https://doi.org/10.1157/13102513 26. World Health Organization. Guideline: Sugars intake for adults and children. Geneva: WHO, 2015.
27. Barquera S, Hernandez-Barrera L, Tolentino ML, Espinosa J, Ng SW, Rivera JA, et al. Energy intake from beverages is increasing among Mexican adolescents and adults. J Nutr. 2008;138(12):2454-61. https://doi. org/10.3945/jn.108.092163
28. Romero-Polvo A, Denova-Gutiérrez E, Rivera-Paredez B, Castañón S, Gallegos-Carrillo K, Halley-Castillo E, et al. Association between dietary patterns and insulin resistance in Mexican children and adolescents. Ann NutrMetab. 2012;61(2):142-50. https://doi.org/10.1159/000341493 29. Nettleton JA, Hivert MF, Lemaitre RN, McKeown NM, Mozaffarian D, Tanaka T, et al. Meta-analysis investigating associations between healthy diet and fasting glucose and insulin levels and modification by loci asso-ciated with glucose homeostasis in data from 15 cohorts. Am J Epidemiol. 2013;15(2):103-15. https://doi.org/10.1093/aje/kws297
30. Stanhope KL, Schwarz JM, Keim NL, Griffen SC, Bremer AA, Graham JL, et al. Consuming fructose-sweetened, not glucose-sweetened, bevera-ges increases visceral adiposity and lipids and decreases insulin sensitivity in overweight/obese humans. J Clin Invest. 2009;119(5):1322-34. https:// doi.org/10.1172/JCI37385
31. Malik VS, Popkin BM, Bray GA, Després JP, Willett WC, Hu FB. Sugar-sweetened beverages and risk of metabolic syndrome and type 2 diabetes: a meta-analysis. Diabetes Care. 2010;33(11):2477-83. https://doi. org/10.2337/dc10-1079
32. Kim MS, Krawczyk SA, Doridot L, Fowler AJ, Wang JX, Trauger SA,
et al. ChREBP regulates fructose-induced glucose production
indepen-dently of insulin signaling. J Clin Invest. 2016;126(11):4372-86. https://doi. org/10.1172/JCI81993
33. Institute of Medicine (U.S.). Standing Committee on the Scientific Eva-luation of Dietary Reference Intakes. Dietary reference intakes for energy, carbohydrate, fiber, fat, fatty acids, cholesterol, protein, and amino acids. Washington DC: National Academies Press, 2005 [cited March 5, 2019]. Available from: https://www.nap.edu/download/10490
34. Vikraman S, Fryar CD, Ogden CL. Caloric intake from fast food among children and adolescents in the United States, 2011–2012. NCHS data brief, no 213. Hyattsville, MD: National Center for Health Statistics, 2015.
35. Asghari G, Yuzbashian E, Mirmiran P, Mahmoodi B, Azizi F. Fast food intake increases the incidence of metabolic syndrome in chil-dren and adolescents: Tehran Lipid and Glucose Study. PLoSOne. 12015;10(10):e0139641. https://doi.org/10.1371/journal.pone.0139641 36. Asghari G, Yuzbashian E, Mirmiran P, Bahadoran Z, Azizi F. Prediction of metabolic syndrome by a high intake of energy-dense nutrient-poor snacks in Iranian children and adolescents. Pediatr Res. 2016;79(5):697-704. https://doi.org/10.1038/pr.2015.270
37. Rodríguez-Ramírez S, Mundo-Rosas V, García-Guerra A, Shamah-Levy T. Dietary patterns are associated with overweight and obesity in Mexican school-age children. Arch Latinoam Nutr. 2011;61(3):270-8.
38. Grimes CA, Wright JD, Liu K, Nowson CA, Loria CM. Dietary sodium intake is associated with total fluid and sugar-sweetened beverage consumption in US children and adolescents aged 2–18 y: NHANES 2005–2008. Am J ClinNutr. 2013;98(1):189-96. https://doi.org/10.3945/ ajcn.112.051508
39. Théodore F, Bonvecchio A, Blanco I, Irizarry L, Nava A, Carriedo A. Significados culturalmente construidos para el consumo de bebidas azu-caradas entre escolares de la Ciudad de México. Rev Panam Salud Publica. 2011;30(4):327-34.
40. Drewnowski A. Obesity, diets, and social inequalities. Nutr Rev. 2009;67(suppl 1):S36-9. https://doi.org/10.1111/j.1753-4887.2009.00157.x 41. Berthoud HR. The neurobiology of food intake in an obesogenic environment. Proc Nutr Soc. 2012;71(4):478-87. https://doi.org/10.1017/ S0029665112000602
42. Poti JM, Popkin BM. Trends in energy intake among US children by eating location and food source, 1977-2006. J Am Diet Assoc. 2011;111(8):1156-64. https://doi.org/10.1016/j.jada.2011.05.007 43. Shamah-Levy T, Cuevas-Nasu L, Méndez-Gómez-Humarán I, Jimenez-Aguilar A, Mendoza-Ramirez AJ, Villalpando S. Obesity in Mexican school age children is associated with out-of-home food consumption: in the journey from home to school. Arch Latinoam Nutr. 2011;61(3):288-95. 44. Naja F, Hwalla N, Itani L, Karam S, Sibai AM, Nasreddine L. A Western dietary pattern is associated with overweight and obesity in a national sample of Lebanese adolescents (13-19 years): a cross-sectional study. Br J Nutr. 2015;114(11):1909-19. https://doi.org/10.1017/ S0007114515003657