!
"
An approximation to the digital divide among Low Income People in
Colombia, Mexico and Perú: two composite indexes
*Luis Hernando Gutierrez Universidad del Rosario
Bogotá- Colombia
Luis Fernando Gamboa Universidad del Rosario [email protected]
Bogotá- Colombia
.
Abstract
This study examines the determinants of information and communications technology (ICT) use and access of low-income people in three developing countries: Colombia, Mexico and Peru. We focus on cross-country differences and similarities in ICTs use across gender, age, education and income, using two composite indicators of ICT. The main similarity across the countries is that education is by far the single most important factor limiting the digitalization of low-income people. The impact of income was low although positive. There is not apparently a gender gap in Colombia and Mexico but one in Peru. Our findings also suggest that when using a composite indicator that only include the ‘advanced ICTs’, disadvantage people among the low-income people can be more constrained in the use and access of more advanced information and communications technologies.
Resumen
El estudio analiza los determinantes de uso y acceso a las tecnologías de información y comunicación en personas de bajos ingresos en pasases como Colombia, México y Perú. El punto central esta en analizar las diferencias entre países de acuerdo a diferentes variables socioeconómicas. Se encuentra que la variable que más explica el nivel de acceso digital es la escolaridad. De otro lado no se encuentra una brecha por género sino en Perú. Los resultados también indican que cuando solo se tienen en cuenta las tecnologías más ‘avanzadas’, las diferencias entre la población son más notorias
JEL classification: O30; O10;P59; L86; C24; O52
Introduction
New information and communication technologies (ICTs hereafter) have generated a
relatively new concept, which is digital divide. This term is related to the socioeconomic
differences in the access and use of ICTs and it first appeared about 1995, in documents
such as ‘Falling through the net”. The digital divide has been studied at micro-levels, using
surveys, and at macro-levels using cross-country data from international agencies like ITU,
UNCTAD and others. Some studies have stressed that the access and use of ICTs, despite
their positive effects, could increase the gap between developed and developing countries
(See ITU, 2006; Ono and Zavodny, 2007).
The purpose of this paper is to assess the relationship between indices of
“digitalization” and main socioeconomic indicators for poor people within and across in
Colombia, Mexico and Peru. We focus on urban low-income people due to data availability
that comes from over 3200 personal surveys. We hypothesize that even for poor people
groups the inequalities they face are reflected in the access and use of ICTs.
The main contribution of this study to the line of research in ICTs is twofold. First,
it does the first empirical evaluation of the digital level of use and access of ICTs in
developing countries, and for the very low-income people in those countries. To that extent
we explore the factors that explain the access and use of ICTs in Colombia, Mexico and
Peru. Second, to undertake such empirical exercise, we follow the methodology of the
digital opportunity index (DOI) calculated by the ITU and construct two related composite
indices that try to overcome the limitations of simple measures of ‘haves’ and ‘not haves’
of ICTs and these indices let us to undertake basic access and more advanced ICTs.
We find that education becomes the single most important factor determining the
level of digitalization of very low-income people living in urban cities in Colombia,
Mexico and Peru. Income, directly, or proxied by the level of average overcrowding in a
bedroom also was found to be important. There is a gender gap in Peru but neither in
Colombia nor in Mexico. Living in the capital city seems to increase the probability of
being (more) digitalized.
One important additional result is the relatively differential increasing impact of
ICTs in our indicator. It suggests that diffusion of advanced ICTs is more limited for the
less educated, poorer and aged people which imply that public and private institutions must
reduce those disadvantages first in order to close the digital gap then.
In the next section, a review of some literature on digital literature is done. Section 3
presents the background of the development of ICT’s use and access in the three countries,
the data sources, we describe the methodology used in each ICT index that we construct.
Section 4 presents main econometric results for the three countries when using the two
indicators. Major findings and analysis are summarized in the last section, which also
includes suggestions for further research.
2. Literature of Measurement Approaches to Digital Divide.
Since it was first described in 1995, the term digital divide has been approached in many
ways. There are many definitions of Digital Divide in the literature and the main
differences are in the concept of Information and communications technologies they
include. For instance, Hargittai (2003) defines it as “the gap between those who have access
to digital technologies and those who do not; or the gap between those who use digital
technologies and those who do not understood in binary terms distinguishing the “have”
from the ‘have-nots’”. Barzilai-Nahon (2006, p 269) argues that digital divide was first
approached “on insfrastructural access” and now “the focus is moving beyond technology
to the users” Other international agencies like the OECD define the divide as the “gap
between individuals, households, business and geographic areas at different
socio-economic levels with regards to their opportunities to access information and
communications technologies and to their use for a wide variety of countries” (OECD,
2001, p.p.8-9). More definitions can be provided but as Hargittai (2003), Barzilai-Nahon
(2006), Bertot (2002) and Vehovar, et al. (2006) argue, the digital divide should not be seen
only in binary terms: i.e., someone either has access to an ICT or not, someone either uses
it or not1. The bottom line is that the digital gap or digital inequality has almost always
1
been measured taking into account a single ICT and the wider dimensions of the concept
have been ignored.
Researchers have made use of data available that unfortunately only give the
“haves” and the “have nots” of ICTs. Academic research on digital divide have either
utilized a micro-sample of individuals in a given country, micro-samples of individuals for
a group of advanced countries or have looked at large and mixed, in terms of development,
macro-samples of countries. Furthermore, researcher have mostly used single measures as
proxy of the digital level of countries, such as computer per 1000 inhabitants or Internet
users, and only a few have made use or have constructed composite measures or indices to
proxy digital level and so the digital gap (See for instance, Hüsing and Selhofer, 2002).
Among the papers that use single measures and a micro-sample of individuals in
developed countries are Demoussis and Giannakopoulos (2006) who made use of the
European Social Survey (ESS) and took 14 countries that belong to the European Union
with about 15554 people. Their main indicator for ICT is: use of Internet services given
network access at home or at work. One important objective of the paper was to see
whether there were differences in use of Internet among southern and northern European
countries. Their findings in a ordered Probit regression are that Internet use is primarily
influenced by gender, age, education, family size, income, cost of Internet access among
other. Using a decomposition scheme proposed by Gomulka and Stern they found that the
differences between those two European zones are explained by unobserved factors not
taken into account in the regressions. Vicente and López (2006) also used a micro-sample
data from a survey conducted in 15 European countries in 2002 with 10306 interviews.
They took the responses for three different single and separate ICTs measures: Internet use,
computer use and mobile use. They use a weighted logit model and found that the level of
income, education and age, impact positively the likelihood of using any of the three ICTs.
Gender variable was found negatively related (female use is lower than male use). They
also found that countries above the European average have higher rates of use than
countries below that average what resembles the findings by Demoussis and
Ono (2006) studied the digital inequality (computer ownership and Internet use)
among three Asian countries, Japan, South Korea and Singapore using individual-level
micro-data for the period 1997-2000. Observations range from almost seven thousand in
Japan to about 950 in South Korea and Singapore. On one hand, he found that Internet use
from any location was driven by age, education, income. In Japan and South Korea women
were less likely to be Internet’s users. Clearly there is a gender divide in those countries.
On the other hand, the determinants of computer ownership at home for Japan were
education and income that relates positively and gender, being a female, and age in a
negative manner. For South Korea and Singapore, age, education and income were the most
important factors. In a similar fashion, Ono and Zavodny (2007) examined usage of ICTs in
five countries: the U.S., Sweden, Japan, South Korea and Singapore. They replicated the
exercises done in Ono (2006) since both ICT measures are ownership of a computer at
home and Internet use. Findings are also alike. In general for the Western countries there is
no a gender divide. Income is the main factor that drives the five countries computer
ownership. Not surprisingly, getting a college degree is also a factor in all countries that
explains computer ownership. With regard to Internet use from any location, it is evident
that for all the countries, mature people use less Internet. College education level and
income are key factors in influencing Internet use. There was no gender gap regarding
Internet for the U.S. and Sweden women.
Micro databases are very rare to find but that is not the case for the United States.
We like to highlight two papers2. The first one by Rice and Katz (2003) who used a
telephone survey conducted in 2002 for about 1,800 people. Among several results, they
find that the gap between users and not-users of Internet is associated with income and age
but not with gender or race. Meanwhile, the gap between mobile users and non users was
also associated with income, work and marital status.
The second paper is by Fairlie (2004) who used micro-level data from the Computer
and Internet Usage Supplement to the 2000 Current Population Survey in which about
2
50,000 households were interviewed. The sample was censored to working-age (25-55)
civilian adults. The statistics, representative of the U.S. population, show some striking
differences among races. For instance, about 70.4 percent of white Americans had
computers while the proportion of Mexican-Americans who had one was less than half (33
percent). The difference was also high regarding either black or latinos (41.3 percent and 39
percent respectively). The racial gap was also high when using the percent of adults who
had access to Internet at home (59% for whites, and 22.1% for Mexican). His econometric
findings using logit procedures showed no gender gap as in the Ono’s studies. Black,
latinos, Mexican and Asian-American were less likely to have computer at home.
Unsurprisingly education and family income were very decisive factors to have a computer
at home. Internet use was also determined by the same factors as ownership computer.
Minority groups but Asians were less likely to have computers. However, in this case there
was a bit of evidence of a gender gap since the coefficients turned to be negative but not
statistically significant. Once more, education and income happen to be determinant factors
in having Internet access at home.
On the other hand, researchers have also made use of macro databases as, ITU or
UNCTAD and the World Bank and they have proceeded to see under different approaches
what factors determine the access or use of some ICTs. Among others is the paper by
Guillen and Suárez (2005) who from a political science perspective studied how regulatory,
socio-political and economics characteristics might have affected Internet use. For that
purpose they used ITU database for a large sample of 118 countries over the period
1997-2001. They hypothesized that world-system status, privatization of incumbent
telecommunications providers, competition in the telecom sector, the degree of
cosmopolitanism, and the existence of democracy tend to increase Internet use. Their
results, using panel data techniques, were mixed since in effect core and peripheral
countries and countries that privatized former public state provider experienced greater
Internet use. However, their indices of democracy, privatization, and tourism expenditure
(cosmopolitanism) were not statistically significant. Per capita income and the number of
phones lines, as expected, were also positively associated. Chinn and Fairlie (2007) used a
the main determinants of computer ownership and Internet penetration. Their model is a
macro that also used the ITU database on two ICTs: computer ownership and Internet users
per 100 inhabitants. In both specifications, they introduce the same basic set of (macro)
regressors like GDP per capita, trade in goods, network telephone density, urban
population, illiteracy rate and one variable proxying regulatory quality. Income, level of
education, age, telephone line density, and regulatory quality were factors (among others)
explaining positively the computer ownership. On the other hand, Internet use was affected
also positively by income, age and regulatory quality. However, two shocking results were
that telephone density had an opposite sign while education was not statistically significant
at standard levels. Again urban population was found to be negatively related to the ICT.
In the same way, Quibria, et al. (2003) used a small sample of Asian countries for
the period that seems to be 2000-2001 and tried to determine the factors that explain the use
of three broad concepts of ICTs: computing, communication, and Internet. To that effect
they ran regression where the dependent variable was the use of: cellular phone, fax
machine, Internet, personal computer, telephone mainline and television. They proceeded to
run each of these six ICTs against couples of explanatory variables like: population and
income; income, education; income and telephones. They found that income was always
significantly and positively related to all six ICT proxies. Number of phones was also
significant when paired with income only for Internet use and personal computer.
Most research that study the digital gap at micro-levels has been done only for
developed countries or at least for high middle-income countries. Some papers do provide
accounts about the digital divide or inequality in developing countries (See Fuchs and
Horak, (2008), Gebremichael and Jackson, (2006), Cedrós and Ugas, (2007), and Mariscal
(2005) among others). However to our knowledge, first, there are no papers using
micro-level data about the access or use of ICTs for any developing countries to try to see how the
digital divide is within and across, and second, there are not papers building ICT composite
3. Background of the Three Countries and Data 3.1 Background
Colombia, Mexico and Peru share many aspects in common given their Spaniard heritage.
However there are some differences in their economic development, and more importantly
to our paper in their current ICT environment. Table 1 presents the macro level of
development in the main ICTs in each country clustered first by types of ICT and then by
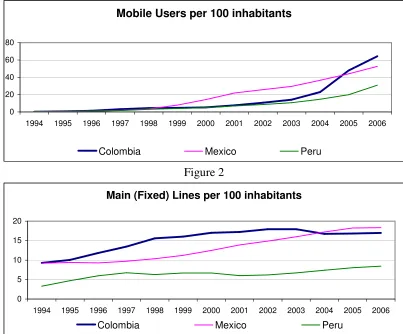
some international indices. It can be seen that Colombia and Mexico have, on average, a
similar wide telephone network while Peru lags well behind them (See also Figure 1 and 2
for a long run trend). However, with data from the World Bank Development Indicators, if
one looks at what the table names as “advanced ICTs”, it is clear that Mexico leads the
[image:9.612.102.505.330.664.2]pack followed by Peru while Colombia is now backwardness, at least until 2005-06.
Figure 1
Mobile Users per 100 inhabitants
0 20 40 60 80
1994 1995 1996 1997 1998 1999 2000 2001 2002 2003 2004 2005 2006
Colombia Mexico Peru
Figure 2
Main (Fixed) Lines per 100 inhabitants
0 5 10 15 20
1994 1995 1996 1997 1998 1999 2000 2001 2002 2003 2004 2005 2006
Colombia Mexico Peru
On the other hand, International agencies like the ITU, the UNCTAD and the World
Economic Forum have calculated some (composite) indices that try to capture the state of
ICTs development around the World. The ITU and the UNCTAD elaborated the “World
Information Society Report 2007 and there, they present some of the (composite) indices
we show in the table 1. First, the DOI, “digital opportunity index” which is composed of
eleven separate indicators in three clusters of opportunity, infrastructure and utilization, is
the reference of the indices we built since the DOI sums up the eleven indicators and then
makes a simple average (See details in ITU-UNCTAD 2007). The DOI index ranges
between a maximum of one (for full access) to a minimum of zero (for null access), and the
results are similar to the last figure (Mexico obtained 0.47 in 2006, Colombia 0.45 and Peru
0.40). All the three countries increased their DOI indices in twelve points between 2001
[image:10.612.123.489.355.688.2]and 2006.
Table 1
Information and Communications Technologies Environment
Information and Communications
Technologies Colombia Mexico Peru
Basic ICT
Telephone mainlines per 1000 people a
2000 173 126 66
2006 171 189 80
Mobiles per 1000 people a
2000 54 144 49
2006 643 526 309
Advanced ICT
Internet Users per 1,000 people a
2000 21 52 31
2006 d 145 203 215
Broadband subscribers per 1,000 people a
2000 0,2 0,2 0,0
2006 d 14,0 34,0 17,0
Personal computers per 1,000 people a
2000 36 58 40
International Indices (relative to top country)
Evolution of Networks b
2000 11,86% 19,01% 8,16%
2003 14,14% 21,74% 10,48%
Evolution of Info-density b
2000 37,26% 29,63% 25,26%
2003 40,23% 32,30% 28,77%
Evolution of Info-use b
2000 21,59% 29,44% 22,41%
2003 30,08% 34,16% 26,14%
Digital Opportunity Index c
2001 0,33 0,35 0,28
2005/06 0,45 0,47 0,40
ICT-OI Value c
2001 26,78% 33,45% 27,20%
2005 27,89% 33,01% 27,67%
Network Readiness Index d
2002 56,25% 61,32% 52,36%
2006/07 62,87% 68,48% 60,07%
2007/08 64,19% 67,47% 59,86%
a. World Bank Development Indicators.
b. ORBICOM-ITU 2005.
c. ITU & World Economic Forum and INSEAD 2008 d. UNCTAD 2007
The ITU and other organizations devised another analytical indicator, the ICT-OI
value. This tool “relies on ten indicators that capture elements of ICT network, education
and skills, uptake and intensity of the use of ICT” and pretends to measure the relative
difference in ICT opportunity levels among economies. With respect to the ICT-OI value,
the table shows the relative percentage of the three countries to the top country (in each
year). Once more, realize that Mexico relative position was better than Colombia and Peru
but has tended to worsen contrary to the small gains of Colombia and Peru. In general, the
three countries are, on average, well lagged with respect to the top countries.
The World Economic Forum and the Insead, in 2002, launched the Network
data. “The Networked Readiness Index Framework represents an effort to untangle the
underlying complexity behind the role of ICT in a nation's development. As the Insead
website states “The framework and its components not only provides a model for
computing the relative development and use of ICT in countries, but also allows for a better
understanding of a nation's strength and weaknesses wit respect to ICT.” In the bottom of
Table 1, we found the ratio of each country index relative to the top country in the ranking.
Once more, Mexico leads the pack but Colombia is closing the gap while Peru is a bit
lagged.
On the other hand, Table 2 shows some economic and demographic indicators for
the three countries. Mexico has greater income per capita and lower inequality in income
distribution than Colombia and Peru. Literacy rate is higher in Colombia though. In Peru,
more than one third of the population lives in the capital while the percentage is the lowest
[image:12.612.139.474.369.665.2]for Colombia. As shown, there has been a steady process of urbanization.
Table 2
Economic and Demographic Environment
Colombia Mexico Peru
Economic Development
GDP per capita, PPP (constant 2000 international $)
2000 5.974 9.262 4.724
2006 6.886 9.967 5.725
Income share held by lowest 10%
5,90 3,99 3,66
GINI index
58,6 46,1 52,0
Demographics
Literacy rate, adult total (% of people ages 15 and above)
2005 92,8 91,6 87,9
Population in the largest city (% of urban population)
2005 23,7 24,8 35,4
Urban population (% of total)
2000 71,2 74,7 71,6
2006 73,0 76,3 72,8
3.1 Data
Data for this paper was taken completely from the micro-data of the project “Mobile
Opportunities: Poverty and Telephony Access in Latin American and the Caribbean”
carried out by DIRSI (the Regional Dialogue on the Information Society) in 2007 in seven
countries: two Caribbean countries, Jamaica and Trinidad and Tobago and five Latin
American countries, Argentina, Brazil, Colombia, Mexico and Peru. We chose Colombia,
Mexico and Peru because as was shown above, their economic and digital developments
are relatively similar. The project consisted of personal interviews to a sample of urban low
income people as follows: eight hundred in Colombia, one thousand in Mexico, and around
one thousand and two hundred in Peru3. A complete questionnaire was designed with
questions on socio- demographic factors, family composition, housing data, and most
importantly questions regarding use, access and patterns of use, patterns of expenditure in:
mobile, fixed, SMS, Internet and public telephony.4 We extracted for each respondent,
information on age, gender, family income, education level, labor status and his or her
patterns of use and access to ICTs. We proceed then to build the two indicators that
measure the digital level of every respondent.
3.3 The ICT Indicators
This study uses the ‘haves’ and ‘have nots’ of ICTs of every respondent to build two
ICT indicators. We are aware of the methodological implications of using this approach but
think that as a first step, our procedure is good enough to try to see how the digital levels of
low income people are and what explains them.
We construct two different indexes that aim at measuring different but related
aspects. Those indices attempt to measure current access to communication technologies
including mobile and fixed telephony, short message service (SMS), and Internet. We
employ composite indices because as DiMaggio and Hargittai (2004) say, binary divide
3
The country reports of the project can be downloaded at http://www.dirsi.net/espanol/content/view/181/71. En each country report, the reader can find the explanations of how the sample and survey were done.
4
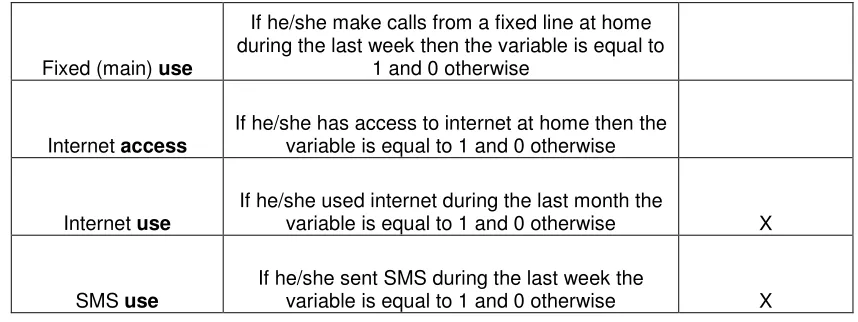
fails to value the social resources of diverse groups in many fields. The answers were
operationalized as shown in Table 3.
Hüsing and Selhofer (2002, 1276) call the attention to one important factor when
constructing a digital divide index. They state that “the selection of indicators necessarily
reflects what is conceived as state-of-the-art technology in the research context. If, for
example the digital divide in developing countries is analyzed, it probably makes sense to
include more traditional telecommunications indicators (e.g. access to a telephone at
home).” To that effect, our first index, that we call the Digital Index, includes both use of
and access to four types ICTs: fixed and mobile phone, Internet and SMS. To
operationalize the index, we follow the way the ITU did to construct the Digital
Opportunity Index (DOI). That is for each respondent we add his/her response in each ICT
and normalize it to one as follows:
(
)
7 Index
Digital
7 1
, = j=
j K
i
ICT
, where i = 1…N,
represents the number of respondent in country K. To illustrate the reader, a respondent
who had access to and used all the ICTs presented in Table 3 would get a “digital index” of
[image:14.612.91.519.435.589.2]one5.
Table 3
Operationalization of the Indices
Variables Index 1 Index 2
Personal Mobile
Access
If he/she owns the mobile phone then the variable is equal to 1 and 0 otherwise
Mobile use
If he/she used the mobile phone in the last three
months the variable is equal to 1 and 0 otherwise X
Personal Fixed (main)
access
If he/she have any fixed line at home the variable is equal to 1 and 0 otherwise
5
Fixed (main) use
If he/she make calls from a fixed line at home during the last week then the variable is equal to
1 and 0 otherwise
Internet access
If he/she has access to internet at home then the variable is equal to 1 and 0 otherwise
Internet use
If he/she used internet during the last month the
variable is equal to 1 and 0 otherwise X
SMS use
If he/she sent SMS during the last week the
variable is equal to 1 and 0 otherwise X
Researchers in the field of ICTs argue that some information and communications
technologies do not need any kind of literacy such as using TVs, radio and making or
receiving a call in a mainline fixed phone. Therefore, people with low levels of education,
low income and aged are expected to use them easily. But, recent and more advanced
technologies like mobile telephony and Internet are, par excellence, interactive technologies
that demand not only standard literacy but also digital literacy, in particular, Internet that
require the know-how of using a computer, and it also probably requires knowing a second
language. Therefore, to see whether digital literacy is or not a more or differential
determinant factor, the second index (Interactive Index) only includes those ICTs which
require more skills such as mobile, Internet and sending SMS.
The InteractiveIndex
(
)
33 1
, = j=
j K
i
ICT
, for i = 1…N, represent the number of
respondent in country K.
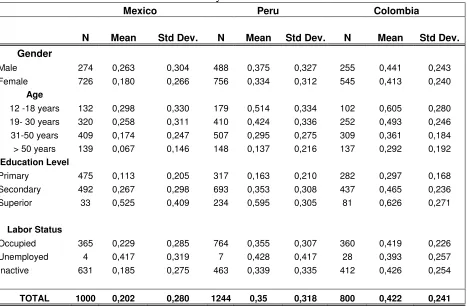
Table 4 summarizes the distribution of the sample for the Interactive Index. For
simplicity, the column named “mean” under the heading of country, shows the average
level reached by the complete group of respondents. We can see that in the three countries
men had, on average, greater level of digitalization than women. So a gender gap exists in
the three countries. But one realizes that the gender gap is relatively greater in Mexico than
Peru and Colombia. Unsurprisingly, we notice that for the three countries as older the
respondent is, the lower his or her level of digitalization is. As the papers we quoted above
[image:15.612.90.519.84.245.2]Again, the three countries show the same pattern. It is interesting to note that young people
exhibit more homogeneity than the elder as seen by a less standard deviation. Lastly, the
digitalization levels of unemployed people were higher in Mexico and Peru, but in
Colombia were the inactive people (students, housewives and people not searching jobs).
Hence, it is apparent that even among low income people socio-demographic factors
determine their access to ICTs. In the next section, we conduct some empirical econometric
[image:16.612.75.542.255.562.2]exercises.
Table 4
Interactive Index by Socioeconomic Factors
Mexico Peru Colombia
N Mean Std Dev. N Mean Std Dev. N Mean Std Dev.
Gender
Male 274 0,263 0,304 488 0,375 0,327 255 0,441 0,243
Female 726 0,180 0,266 756 0,334 0,312 545 0,413 0,240
Age
12 -18 years 132 0,298 0,330 179 0,514 0,334 102 0,605 0,280
19- 30 years 320 0,258 0,311 410 0,424 0,336 252 0,493 0,246
31-50 years 409 0,174 0,247 507 0,295 0,275 309 0,361 0,184
> 50 years 139 0,067 0,146 148 0,137 0,216 137 0,292 0,192
Education Level
Primary 475 0,113 0,205 317 0,163 0,210 282 0,297 0,168
Secondary 492 0,267 0,298 693 0,353 0,308 437 0,465 0,236
Superior 33 0,525 0,409 234 0,595 0,305 81 0,626 0,271
Labor Status
Occupied 365 0,229 0,285 764 0,355 0,307 360 0,419 0,226
Unemployed 4 0,417 0,319 7 0,428 0,417 28 0,393 0,257
Inactive 631 0,185 0,275 463 0,339 0,335 412 0,426 0,254
TOTAL 1000 0,202 0,280 1244 0,35 0,318 800 0,422 0,241
Besides those two key indicators, we tabulated information of some factors that
have been determinants of use and access of ICTs in other studies (See Hüsing and
Selhofer, 2002): Family income, education, age, gender, labor status and size of the
household. Since the survey in each country was carried out in the country capital and in
other smaller cities, we include a dummy variable that takes the value of one if the
behind this is that the population of the country’s capital in developing countries, has much
better quality life in the sense it has (more) points of access to all public and private
services of ICTs and so access and use should be greater. In the case of Peru, it was not
possible to get reliable data on family or personal income of the respondents, so we proxy
the family income using the variable “overcrowding” or average number of people living in
a bedroom. Lastly, some researchers argue that the process of learning and use advanced
ICTs by people is smoother and faster when they have relatives or friends who use those
ICTs. Dirsi’s country reports also found that mobile telephony was mainly used to be in
contact with relatives and friends. It was also found in that project that low income
households are large in numbers and so there might be greater needs to use ICTs. Therefore
[image:17.612.87.528.337.672.2]we include the number of family members in the household where the respondent lived. 6
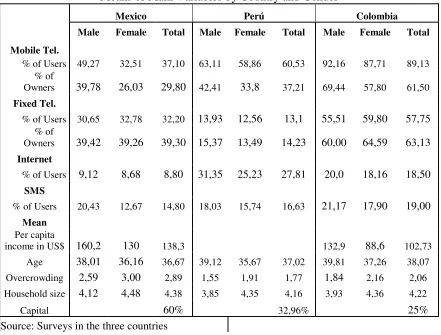
Table 5
Means of Main Variables by Country and Gender
Mexico Perú Colombia
Male Female Total Male Female Total Male Female Total
Mobile Tel.
% of Users 49,27 32,51 37,10 63,11 58,86 60,53 92,16 87,71 89,13 % of
Owners 39,78 26,03 29,80 42,41 33,8 37,21 69,44 57,80 61,50
Fixed Tel.
% of Users 30,65 32,78 32,20 13,93 12,56 13,1 55,51 59,80 57,75
% of
Owners 39,42 39,26 39,30 15,37 13,49 14,23 60,00 64,59 63,13
Internet
% of Users 9,12 8,68 8,80 31,35 25,23 27,81 20,0 18,16 18,50
SMS
% of Users 20,43 12,67 14,80 18,03 15,74 16,63 21,17 17,90 19,00
Mean
Per capita
income in US$ 160,2 130 138,3 132,9 88,6 102,73 Age 38,01 36,16 36,67 39,12 35,67 37,02 39,81 37,26 38,07 Overcrowding 2,59 3,00 2,89 1,55 1,91 1,77 1,84 2,16 2,06 Household size 4,12 4,48 4,38 3,85 4,35 4,16 3,93 4,36 4,22 Capital 60% 32,96% 25% Source: Surveys in the three countries
6
Table 5 provides a picture of some stylized factors of the population surveyed. First,
the percentages of respondents who used fixed and mobile were higher in Colombia than in
Mexico with the lowest in Peru. Second, in the three countries, men were more prone to use
mobile, Internet and SMS than women. Average monthly incomes for Colombia and
Mexico were about US103 and US138. The number of family members was on average
similar among the three countries but the level of overcrowding was higher for Mexico,
followed by Colombia and then Peru. Although the range for selecting people was from 13
to 65, average age in the three countries was similar and about 37 years old.
4. Empirical Model, Result and Analysis 4.1. Model
We estimate pattern of ICTs with the two indices: the “digital” index and the
“interactive” index using separate logit regressions for each country.7 In our estimations we
are interested in assessing what determines that someone have an index above the average
in the population. In consequence, the dependent variable is equal to 1 if the index of the
respondent is above the mean in their country-sample, and zero otherwise. We also make
some estimation with age and age squared in order to test the no linearity in the relationship
but the results were similar
4.2. Results and Analysis
First, we examine patterns of use and access of ICTs with the ‘digital index’ that includes
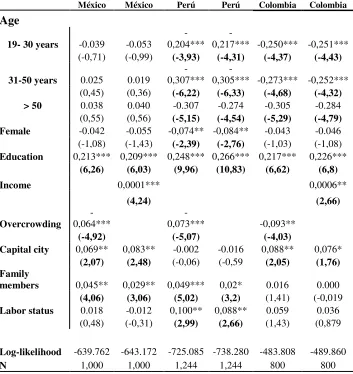
four ICTs. As we show in Table 6, the estimated marginal effects indicate some
commonalities and differences across the countries in the determinants of the ICT index. In
the three countries, education level and income happen to be positively associated with the
level of digitalization. Education, then, becomes by the size of the marginal effect and the
level of statistical significance, the single main factor determining the likelihood of
accessing and using ICTs in relation to the average of the population. The effect of income
on the ICT index was positive for Colombia and Mexico but its effect is almost negligible.
It could be a consequence of two factors: First, that income data were not enough reliable
7
and second, since the survey was focused on the low income households the income
variance tends to be small.
To overcome this and since in Peru, income data was not available, we use the level
of overcrowding as proxy of income. Clearly, as expected, the more crowded the living
conditions, the worse should be the degree of digitalization of the respondent. Indeed it was
the result we found for the three countries with high levels of statistical significance. In all
[image:19.612.131.484.272.646.2]cases, the highest and lowest marginal effects are in Colombia and Mexico, respectively.
Table 6
Marginal effects of the ‘Digital Index
México México Perú Perú Colombia Colombia
Age
19- 30 years -0.039 -0.053 -0,204***
-0,217*** -0,250*** -0,251***
(-0,71) (-0,99) (-3,93) (-4,31) (-4,37) (-4,43)
31-50 years 0.025 0.019
-0,307***
-0,305*** -0,273*** -0,252***
(0,45) (0,36) (-6,22) (-6,33) (-4,68) (-4,32)
> 50 0.038 0.040 -0.307 -0.274 -0.305 -0.284
(0,55) (0,56) (-5,15) (-4,54) (-5,29) (-4,79)
Female -0.042 -0.055 -0,074** -0,084** -0.043 -0.046
(-1,08) (-1,43) (-2,39) (-2,76) (-1,03) (-1,08)
Education 0,213*** 0,209*** 0,248*** 0,266*** 0,217*** 0,226***
(6,26) (6,03) (9,96) (10,83) (6,62) (6,8)
Income 0,0001*** 0,0006**
(4,24) (2,66)
Overcrowding
-0,064***
-0,073*** -0,093**
(-4,92) (-5,07) (-4,03)
Capital city 0,069** 0,083** -0.002 -0.016 0,088** 0,076*
(2,07) (2,48) (-0,06) (-0,59 (2,05) (1,76)
Family
members 0,045** 0,029** 0,049*** 0,02* 0.016 0.000
(4,06) (3,06) (5,02) (3,2) (1,41) (-0,019
Labor status 0.018 -0.012 0,100** 0,088** 0.059 0.036
(0,48) (-0,31) (2,99) (2,66) (1,43) (0,879
Log-likelihood -639.762 -643.172 -725.085 -738.280 -483.808 -489.860
N 1,000 1,000 1,244 1,244 800 800
The results for gender and age were mixed. All the regressions for gender that we
ran for Colombia and Mexico gave the expected negative signs but their statistical
significances were relatively below the standard ones (lower for Colombia than for
Mexico). In Peru, however, there is a gender gap since for all the regressions there was a
negative association. The marginal contribution is fairly low when compared to that of
education though. Age was negatively associated with the ICT index for almost all
regressions but was only statistically significant for Colombia and Peru. People who are
older than the group of 12 to 18 years have a less propensity of being above the digital
average in their country and as we expected adults are more prone to be less digitalized in
those countries. In Mexico, we find the same sign but it is not statistically significant.
On the other hand, the labor status variable did not have good results except for Peru
with the expected sign and highly significant. Low-income individuals living in Bogotá and
Mexico City are apparently more digitalized what means that disadvantaged population
within a country suffers also a geographical divide. But it was not the case for Peru (Lima).
More research must be done to disentangle the reasons of this result in Peru. Lastly, the
variable number of close relatives living with the respondent was positive for Mexico and
Peru but not for Colombia. We cannot say conclusively that there exists a spillover
knowledge effect since we do not have complete information on the degree of access and
use of all members within the family group. The result does indicate that more research has
to be done in this respect.
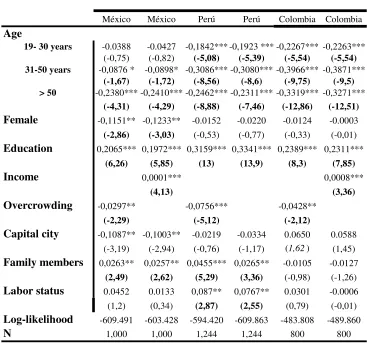
We next examine the results presented in Table 7 using what we call ‘the Interactive
Index’. We are interested in exploring how the size and the expected sign of the results are
compared with those of the ‘digital index’. We realize that there were slightly changes
across indicators and countries. For instance the coefficients of education are in most cases
higher, although in some are just lightly higher, than with the ‘digital index’ above.
Besides, the statistical significances of coefficients for age are higher in particular for
Mexico. Income effect tends to be also higher. There are some changes in the expected
signs for the dummy of living in the capital cities but the sign of the size of the household
Table 7
Marginal effects of the ‘Interactive Index
México México Perú Perú Colombia Colombia
Age
19- 30 years -0.0388 -0.0427 -0,1842*** -0,1923 *** -0,2267*** -0,2263***
(-0,75) (-0,82) (-5,08) (-5,39) (-5,54) (-5,54)
31-50 years -0,0876 * -0,0898* -0,3086*** -0,3080*** -0,3966*** -0,3871***
(-1,67) (-1,72) (-8,56) (-8,6) (-9,75) (-9,5)
> 50 -0,2380*** -0,2410*** -0,2462*** -0,2311*** -0,3319*** -0,3271***
(-4,31) (-4,29) (-8,88) (-7,46) (-12,86) (-12,51)
Female -0,1151** -0,1233** -0.0152 -0.0220 -0.0124 -0.0003
(-2,86) (-3,03) (-0,53) (-0,77) (-0,33) (-0,01)
Education 0,2065*** 0,1972*** 0,3159*** 0,3341*** 0,2389*** 0,2311***
(6,26) (5,85) (13) (13,9) (8,3) (7,85)
Income 0,0001*** 0,0008***
(4,13) (3,36)
Overcrowding -0,0297** -0,0756*** -0,0428**
(-2,29) (-5,12) (-2,12)
Capital city -0,1087** -0,1003** -0.0219 -0.0334 0.0650 0.0588
(-3,19) (-2,94) (-0,76) (-1,17) (1,62) (1,45)
Family members 0,0263** 0,0257** 0,0455*** 0,0265** -0.0105 -0.0127
(2,49) (2,62) (5,29) (3,36) (-0,98) (-1,26)
Labor status 0.0452 0.0133 0,087** 0,0767** 0.0301 -0.0006
(1,2) (0,34) (2,87) (2,55) (0,79) (-0,01)
Log-likelihood -609.491 -603.428 -594.420 -609.863 -483.808 -489.860
N 1,000 1,000 1,244 1,244 800 800
***p < .01 **p < .05 *p < .10. Shown are the marginal effects of the estimated coefficients from logit regressions.z values are in parentheses and are White-corrected for individual heteroscedasticity.
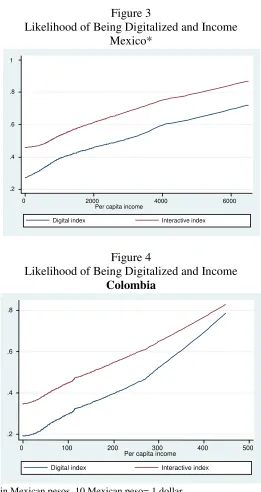
Some findings posed above can be better understood with figures 3 to 5. Figure 3 and 4,
shows how the likelihood of having more access to the ICTs relates with the level of
income for the cases of Mexico and Colombia. Two things can be noticed. First the greater
the income the greater is the digitalization level of people; and second, the probability is
greater for the “interactive index” than for the “digital index” that could be a consequence
Figure 3
[image:22.612.178.436.89.323.2]Likelihood of Being Digitalized and Income Mexico*
Figure 4
Likelihood of Being Digitalized and Income
Colombia
* Income is measured in Mexican pesos. 10 Mexican peso= 1 dollar
The next three figures show, for the three countries, the probability of accessing and
using ICTs given the age of the respondents. Clearly, for every country one observes that as
the respondent ages the lowest his or her probability of using ICTs. The probability is lower
when we use the ‘interactive index’ what supports our conjecture that more ‘advanced’
.2 .4 .6 .8
0 100 200 300 400 500
Per capita income
Digital index Interactive index .2
.4 .6 .8 1
0 2000 4000 6000
Per capita income
ICTs tend to be less used by more aged people. Last, the probability seems to decrease
[image:23.612.172.442.144.638.2]faster when people are over 40 years old.
Figure 5
Likelihood of Being Digitalized and Age Mexico
Figure 6
Likelihood of Being Digitalized and Age
Colombia
.1 .2 .3 .4 .5
20 40 60 80 100
Age
Digital index Interactive index .1
.2 .3 .4 .5 . 6
20 40 60 80
Age
Figure 7
Likelihood of Being Digitalized and Age
Perú
In summary, it all can suggest that the more disadvantaged people among the poor
are more limited in the use of advanced ICTs. If so, the policy implication is that
governments must close the socioeconomic gaps of low-income people, or provide training
courses to empowered people with the tools of ICTs. On the other hand, the finding,
although preliminary suggests that researchers should be careful in defining their metric
when studying the ICT gap in developing countries. Comprehensive measures that mix
standard ICTs with very advanced ones can be misleading. However, we think that more
micro-level research in developing country should be conducted in this regard.
Concluding Remarks
The objective of this paper was to identify the factors that shape the decisions of
low-income people for personal use of various ICTs in three developing countries. It uncovered
several findings. First, perhaps unsurprisingly, we confirm the importance of education and
income in explaining the gap in the access and use of four main ICTs: fixed phone and
mobile telephony, Internet and SMS. Second, we find that in Peru there is a digital gender
gap but not in Colombia and Mexico, at least for the population surveyed. More research
has to be done to see whether this is due to the specific data. Low-income people who live
in capital cities of Bogotá, and Mexico City apparently fare better than low-income people .2
.3 .4 .5 .6
20 30 40 50 60 70
Age
who live in intermediate cities. It implies that a geographical digital gap can be emerging
what reproduces the pre-existing socioeconomic inequalities among cities, and also can be
explained by the lower competition by operators for users with those inequalities. Again,
more research has to be done.
Last, from a methodological perspective, we tried to see whether including different
types of ICTs in our composite indicators had any differential on the size of the
coefficients’ main factors. The findings confirm that when using only the more advanced
ICTs, factors already identified as important, become, in general, more relevant.
In conclusion and from a policy perspective, the results of the present study suggest
that governments in developing countries must try to reduce the socio-economic
inequalities and by implementing ICT access programs can generate new opportunities for
the low income people. The findings also means that government programs in educating
and training low-income people in ICTs tools are of greater importance since they empower
individuals. The role of non-government organizations (NGOs) in training low-income
people is also very important and must be encouraged and supported.
Lastly, in a companion paper we intend to refine our indices and include the
frequency of use and pattern of expenditure in fixed and mobile telephony, Internet use and
SMS that we hope will allow us to see whether more refined measures of ICT usage and
access are more useful in explaining the patterns of usage of low income people, or if new
relationship between socioeconomic variables and ICT indicators emerge. Also, as data
available allows it, we intend to find indicators of the relative digital poverty like those
proposed for Barrantes (2007). Our preliminary results do suggests that more research is
warranted.
References
Barrantes, Roxana (2007) “Analysis of ICT Demand: What is Digital Poverty and How to Measure it?” in Digital Poverty: Latin American and Caribbean Perspectives. Edited by Kathryn Neckerman. International Development Centre, Practical Action Publishing, Otawa.
Bertot, John Carlo (2003) “The Multiple Dimensions of the Digital Divide: More than the Technology ‘Haves’ and ‘Have Nots’”, Government Information Quarterly, 20: 185-191.
Cendrós G, Jesús, and Luis Ugas (2007) “The Digital Gap in Maracaibo City in Venezuela” Telematics and Informatics, 24: 41-47.
Chinn, Menzie D., and Robert W. Fairlie (2007) “The Determinants of the Global Digital Divide: a Cross-Country Analysis of Computer and Internet Penetration”, Oxford Economic Papers, 59: 16-44.
Corrocher, Nicoletta, and Andrea Ordanini (2006) “Measuring the Digital Divide: A Framework for the Analysis of Cross-Country Differences”, Journal of Information Technology, 17: 9-19.
Demoussis, Michael, and Nichola Giannakopoulos (2006) “Facets of the Digital Divide in Europe: Determination and Extent of Internet Use” Economic Innovation and New Technology, 15: 235-246.
DiMaggio, P. and Hargittai E. (2004) “From the ‘Digital Divide’ to digital inequality: Studying Internet use as penetration increases”. Working Paper 15. Princeton, NJ. Center for Arts and Cultural Policy Studies. Princeton University.
DiMaggio, Paul, Eszter Hargittai, Coral Celeste and Steven Shafer (2004) “Digital Inequality: From Unequal Access to Differentiated Use” in Social Inequality. Edited by Kathryn Neckerman. New York: Russell Sage Foundation.
Fairlie, Robert W. (2004) “Race and the Digital Divide” Contributions to Economic Analysis & Policy, 3, article 15.
Fuchs, Christian, and Eva Horak (2008) “Africa and the Digital Divide” Telematics and Informatics, 25: 99-116.
Gebremichael, Meseret D., and Jason W. Jackson (2006) “Bridging the Gap in Sub-Saharan Africa: A Holistic Look at Information Poverty and the Region’s Digital Divide” Government Information Quarterly, 23: 267-280.
Gomulka, J., and Jon Stern (1990) “The Employment of Married Women in the United Kingdom 1970-1983” Economica, 57: 171-199.
Guillen, Mauro F., and Sandra L. Suárez (2005) “Explaining the Global Digital Divide: Economic, Political and Sociological Drivers of Cross-National Internet Use” Social Forces, 84:681-708.
Hargittai, Eszter, “The Digital Divide and What to do About it” (2003) in New Economy Handbook, Edited by C. Jones. Elsevier Academic Press, NY, pp. 821-839.
Hüsing, Tobias, and Hannes Selhofer (2002) “The Digital Divide Index – A Measure of Social Inequalities in the Adoption of ICT” ECIS, June: 1273-1286.
International Telecommunications Union (ITU) (2006) World Telecommunications/ICT Development Report 2006: Measuring ICT for Social and Economic Development. ITU, Geneva.
International Telecommunications Union (ITU)/UNCTAD (2007) World Information Society Report 2007. Beyond WSIS. Geneva.
Mariscal, Judith (2005) “Digital Divide in a Developing Country” Telecommunications Policy, 29: 409-428.
OECD (2001) Understanding the Digital Divide. OECD, Paris
Ono, Hiroshi. (2006). Digital inequality in East Asia: Evidence from Japan, South Korea, and Singapore”. Asian Economic Papers 4: 116-142.
Ono, Hiroshi, and Zavodny M. (2007) Digital inequality: a five comparison using microdata. Social Science Research 36: 1135-1155.
Quibria, M.G., Shamsun N. Ahmed, Ted Tschang, and Mari-Len Reyes-Macasaquit (2003) “Digital Divide: Determinants and Policies with Special Reference to Asia” Journal of Asian Economics, 13: 811-825.
Rice, Ronald E., and James E. Katz (2003) “Comparing Internet and Mobile Phone Usage: Digital Divides of Usage, Adoption, and Dropouts” Telecommunications Policy, 27: 597-623.
Venovar V., Sicherl P., Hüsing T., Dolnicar V. (2006) Methodological Challenges of Digital Divide Measurements The Information Society. 22: 279-290.
Vicente, María Rosalía and Ana Jesús López (2006) “Patterns of ICT Diffusion across the European Union” Economics Letters, 93: 45-51.
Vicente, María Rosalía and Ana Jesús López (2006) “A Multivariate Framework for the Analysis of the Digital Divide: Evidence for the European Union-15” Information and Management, 43: 756-766.
Appendix
Questions used from the Questionnaires
For the purpose of this study, we use the answers given to:
a. TM3. Do you currently have a mobile phone?
b. TM1. During the past three months have you used a mobile phone to make or
receive calls?
c. TM33. During the last month, did you send any text messages from any mobile
phone?
d. TF1. Do you have a fixed phone line (landline) at home?
e. TF3. During the last week, have you used the fixed phone line phone (landline) in your
home to make or receive calls?
f. INT1. Approximately how many days have you used the Internet during the past