ABSTRACT
The relationships between various shapes in a Buddhist temple bell and the corresponding acoustic characteristics are clarified mainly by Finite Element Method (FEM) analysis.
First, it is shown that the cross-sectional shapes of the “Komazume” (lower part that is slightly thicker than the rest of the bell) have high correlations to the vibration modes as well as the vibration positions. As a result, the Komazume has a large influence on the bell’s acoustic characteristics. Second, it is shown that the “Doza” (part where the bell is struck), which functions as an formal asymmetrical factor when the bell vibrates, is highly related to beat characteristics.
1. ANALYSIS MODEL
The FEM analysis model of the bell was structured as follows. First, its two dimensional FEM cross sectional shape was made. The full model was configured so that its cross sectional shape was rotated by 360 degrees. The actual bell shape of the Hojobo Temple (in Isehara, Kanagawa Prefecture, Japan) was utilized as the analysis model[1][2].
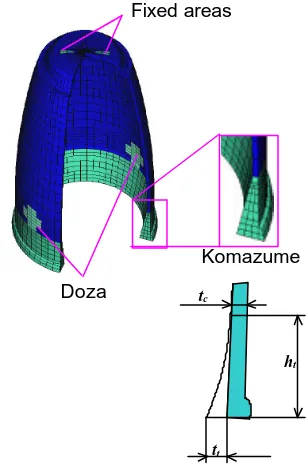
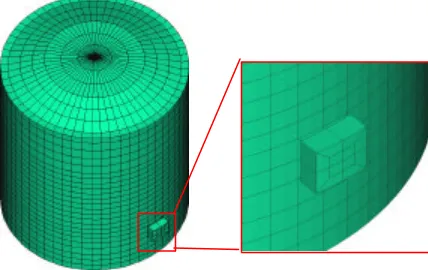
Figure 1 shows the analysis model. Each
element was composed of 20 contact points. The elements of the Komazume and Doza parts were made smaller than the other parts. The number of circumferential divisions was 60, and the upper two small areas were selected as fixed areas, as shown in the figure. The analysis software is Marc K7.3.
Table 1 shows the bronze material constants related to the bell.
43.75.Kk
T.Nakanishi;T.Miura;T.Masaeda;A.Yarai
Department of Electrical and Electric Engineering,Faculty of Engineering,
Osaka Sangyo University,
3-1-1 Nakagaito, Daito Osaka, 574-8530, Japan
Phone +81 (72)-875-3001, FAX +81 (72)-870-8189
Email [email protected]
Vibration analysis of a temple bell by Finite Element Method
Komazume Fixed areas
tt
[image:1.596.335.489.454.688.2]ht
Fig.1 The FEM analysis model of the bell
Table 2 compares the measured and FEM analyzed vibration frequencies of each mode for the Hojobo Temple bell. As shown in the table, the differences between them are around 3-5%. The reason for this can be considered due to the differences in each material constants and in the details of the partial shapes. Such differences, however, are not important in understanding the bell’s acoustics.
2. INFLUENCE OF KOMAZUME SHAPE ON BELL SOUND
The influence of the cross-sectional shape of the Komazume on the acoustic characteristics was investigated in detail by FEM analysis. The bottom width of the Komazume tt (Fig.1) was varied on condition that its cross-sectional area was always kept constant. Table 3 shows pairs of analyzed bottom widths tt and heights ht of the Komazume.
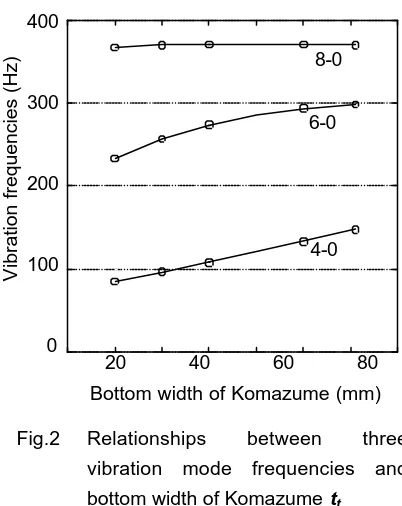
Figure 2 shows the relationships between three vibration mode frequencies and the bottom width of the Komazume tt. From the figure, it can be seen that each vibration mode
frequency increases as tt increases (i.e., as ht decreases).
Each mode’s tendency of increasing, however, has its own characteristics. While the 4-0 mode curve increases linearly with the increase in tt, the 6-0 mode curve saturates with the increase. The 8-0 mode curve, however, is nearly independent of tt. The reason for the differences in these tendencies can be explained by considering each mode’s vibration position[3].
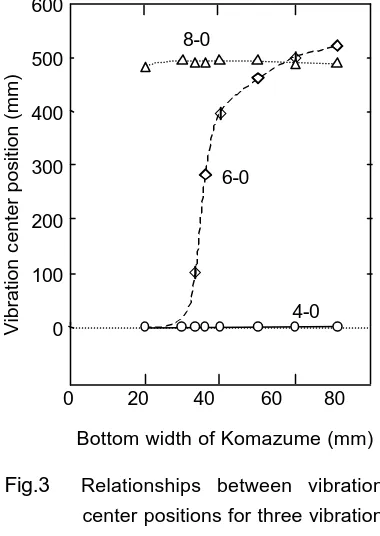
Figure 3 shows the relationships between vibration center positions (defined by the height from the bottom of the bell) for the three vibration modes and the bottom width of Komazume tt.
As shown in the figure, the vibration center positions of the 4-0 mode and 8-0 mode hardly change as tt values increase, being fixed at the Komazume and at around 500 mm from the bottom of the bell, respectively. Otherwise, only that of 6-0 mode steeply changes as tt increase. As explained, the 4-0 mode vibration center position is located almost at the Komazume, and so its vibration frequency is directly influenced by changes in the Komazume’s shape. As for the 8-0 mode, its Mode FEM analyzed Measured
4-0 143.0 137.8
6-0 319.0 301.8
8-0 395.4 378.6
(Hz) Table 2 Vibration frequencies Young's Modulus 8.08×10¹⁰ N/m2
Poisson's ratio 0.358
[image:2.596.86.283.86.135.2]Mass density 8.60×10³ kg/m3 Table 1 Bronze material constants of bell
width tt 20 30 40 50 60 71
height ht 149 98 73 58 48 40
(mm) Table 3 Analyzed bottom widths and heights of Komazume
20 40 60 80 Bottom width of Komazume (mm) 400
300
200
100
0
V
ibration frequencies (Hz)
Fig.2 Relationships between three vibration mode frequencies and bottom width of Komazume tt
[image:2.596.306.507.252.505.2]vibration center position remains independently distant from the Komazume as tt increase, and so its vibration frequency is hardly influenced by the increase in tt. As for the 6-0 mode, its vibration frequency is directly influenced by the increase in tt when tt is relatively small because then its vibration center position is located at around the Komazume. However, as the position steeply moves far from the Komazume position when tt exceed a certain value (around 35 mm), its vibration frequency becomes only slightly influenced by the increase in tt.
The reason for the 6-0 mode vibration center position movement can be considered as follows. Since the stiffness of the Komazume becomes too strong for the 6-0 mode to vibrate at the Komazume position for over certain values of tt, the 6-0 mode vibration center position moves to positions of weaker stiffness. On the other hand, for the 4-0 and 8-0 mode vibration, the Komazume position and the higher position are their proper vibration center positions, respectively,
because the stiffness of each position, when the tt values are those shown in Table 3, fits each vibration.
Figure 4 shows 6-0 mode vibration patterns of several tt values obtained by FEM simulation. As shown in the figure, the change in vibration center position with the change in the bottom width of the Komazume can be clearly seen.
Figure 5 shows the relationships between tt values and the ratios of the 6-0 and 8-0 vibration mode frequencies to that of the 4-0 mode. From these figures, it can be concluded that the “tone” of the bell sound can be controlled by adjusting the Komazume’s shape.
To confirm the above assumption, the
30 mm 40 mm 71 mm
[image:3.596.308.509.225.323.2]tt =20 mm
Fig.4 6-0 mode vibration patterns at several tt
values 600
500
400
300
200
100
000
0 20 40 60 80 4-0 6-0
8-0
Bottom width of Komazume (mm)
Vibration
c
[image:3.596.87.277.282.550.2]enter position (mm)
Fig.3 Relationships between vibration
center positions for three vibration modes and bottom width of Komazume tt
5
4
3
2
1
0
0 20 40 60 80 Bottom width Komazume (mm)
Ratio of
frequencies
(8-0/4-0)
[image:3.596.319.499.459.690.2](6-0/4-0)
Fig. 5 Relationships between tt values
influence of the thickness of higher positions of the bell tc (Fig.1) on each vibration mode frequency was analyzed. The thickness tc, except at the Komazume, was changed from 8 mm to 32 mm, under the condition that tt value of the Komazume is fixed to be the value of the Hojobo bell (46.2 mm).
[image:4.596.326.485.257.509.2]Figure 6 shows the results. As shown in the figure, while the 6-0 and 8-0 vibration mode frequencies change with the increase in tc, that of the 4-0 mode hardly changes because the main vibration positions remain at around the Komazume. Therefore, the change in thickness tc can be considered another method of changing the bell tone.
3. INFLUENCE OF DOZA THICKNESS ON THE BELL BEAT SOUND
Though the beat sound is another important factor for the Bell sound, its origin has not yet been fully clarified. Fundamentally, the beat is considered to generate due to formal or material asymmetrical factors of the bell. Since the Doza, which is the portion where the bell is struck by a pole, can be regarded as one of the main formal asymmetrical factors of the bell, we investigated its influence on the bell beat[4].
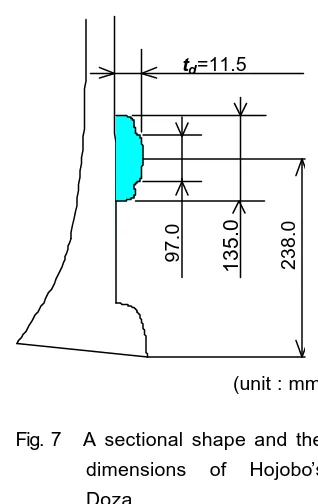
Figure 7 shows the sectional shape and dimensions of Hojobo’s Doza. Though the real Doza shape is circular, the FEM-simulated shape was configured with quadrilateral factors (See Fig. 1) on condition that the area of each Doza is the same. This is due to the limit of the shape of the minimum finite element for FEM analysis. Although Hojobo’s bell has two Dozas placed 180 degrees opposite each other on the circumference, we investigated three cases in which the numbers of Dozas are 1, 2 and 4.
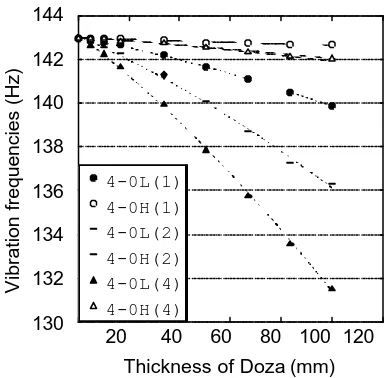
Figure 8 shows the relationships between 4-0H and 4-0L vibration mode frequencies and the thickness of Doza td, where the number of Dozas are 1, 2 and 4.
Here, 4-0H and 4-0L modes are defined as follows. When a bell has formal asymmetrical factors on its circumference, each vibration mode splits into two modes whose vibration frequencies are slightly different from each other. Here, using 4-0 mode vibration as an example, a little bit higher vibration frequency is defined as the 4-0H mode, as well as the 4-0L mode for a little bit lower frequency. The reason for the split can be explained as follows.
8 16 24 32 400
300
200
100
000
V
ibration frequencies (Hz)
Thickness of the bell (mm) 4-0 6-0 8-0
Fig.6 Influence of thickness tc of higher
bell positions on each vibration mode frequency
td=11.5
97.0 135.0 238.0
(unit : mm)
[image:4.596.87.276.314.501.2]Figure 9 shows vibration aspects for both 4-0H and 4-0L modes when the number of Dozas is 1. As shown in the figure, in the case of the 4-0 mode, two vibration modes coexist whose mutual vibration directions differ by 45 degrees of each other. Although for the 4-0L mode, the Doza is located at the position where the vibration amplitude shows maximum value, the Doza is located at the position where vibration scarcely occurs for the 4-0H mode.
Therefore, since the Doza functions as added mass for 4-0L vibration mode when the bell vibrates, the 4-0L mode’s vibration frequency is slightly lower than that of the 4-0H mode, for which the Doza does not function as added mass when the bell vibrates. The beat frequencies can be calculated as the difference between 4-0H and 4-0L vibration mode frequencies. From figure 8, we obtain figure 10 to show the relationships between td (11.5 mm for Hojobo’s Doza) and the beat frequencies of the bell.
From the figure, it can be seen that in relation to the number of Dozas as well as their thicknesses, the beat frequencies increase almost proportionally. The reasons for these results can also be explained by principles similar to those shown in figure 9. These results show that the beat frequency of bells can be controlled artificially by choosing the proper number as well as thicknesses of Dozas.
Moreover, to confirm the influence of the Doza on bell beat frequency, a miniaturized bell was made of brass material. Its height, inner diameter, and the thickness are 176 mm,
[image:5.596.319.503.422.602.2]4-0L 4-0H
Fig. 9 Vibration aspects for 4-0H and 4-0L modes when number of Dozas is 1
45°
Doza Doza
12
10
08
06
04
02
00
0 20 400 600 80 100 120
Beat frequencies (Hz)
Thickness of Doza (mm) (1) (2) (4)
Fig. 10 Relationships between thickness of Doza td and bell’s beat
frequencies, where numbers of Dozas are 1, 2 and 4
144
142
140
138
136
134
132
130
0 20 0 400 600 80 100 120
V
ibrati
on frequencies (Hz)
Thickness of Doza (mm)
Fig.8 Relationships between 4-0H and 4-0L mode vibration frequencies and the thickness of Doza td, where number
of Doza’s are 1, 2 and 4
4-0L(1)
4-0H(1)
4-0L(2)
4-0H(2)
4-0L(4)
[image:5.596.66.299.539.752.2]69 mm, and 6 mm, respectively. A 16 mm diameter Doza was attached to this miniaturized bell.
Figure 11 shows an FEM model of the miniaturized bell. As is shown, although the real Doza shape is circular, the FEM simulated shape of this miniaturized bell was also configured with quadrilateral shape on condition that the area of each Doza is the same.
Figure 12 shows experimental and
simulated results for the relationships between the thickness of the Doza td and the beat frequencies of the miniaturized bell. As shown in the figure, the experimental and simulated results closely coincide with each other, which confirmed the simulation results.
4. CONCLUSIONS
The relationships between various shapes in a Buddhist temple bell and the corresponding acoustic characteristics were clarified mainly by Finite Element Method analysis.
Through the analysis, it was clarified that the cross-sectional shapes of the Komazume had high correlations to each mode vibration frequency according to its particular vibration position. As a result, the Komazume has a major influence on acoustic characteristics.
It was also clarified that both Doza mass and the number of Dozas are highly related to beat characteristics.
REFERENCES
[1] T. Miura et al., 2000 Spring Meet. Acoust.
Soc. Jpn, 1-9-1 (2000)
[2] I. Nishiguchi et al., J. Acoust. Soc. Jpn (J), 53-11, 844 (1997)
[3] Y. Takazawa, Tech. Commit. M. Mus.
Acoust., Jpn, MA95-10 (1995)
[4] T. Miura et al., Rec. 2000 Kansai-section
Joint Conv. Inst. of Elec. and Info. Eng., Jpn,
[image:6.596.81.295.244.379.2]G19-2 (2000) Fig. 11 FEM model of miniaturized bell
bell
0 5 10 15 20 Thickness of Doza (mm)
Beat
frequencies (Hz) Measured value
[image:6.596.93.270.444.622.2]Analyzed value
Fig.12 Experimental and simulated results showing the relationships between the thickness of Doza td and