A METHOD FOR THE ASSESSMENT OF SOUNDS AS PERCEIVED
SEPARATELY FROM THEIR BACKGROUND
PACS 43.50.+y Noise: its effects and control ; 43.58.+z Acoustical measurements and instrumentation ;
M. Boubezari; J. L. Bento Coelho
CAPS - Instituto Supérior Técnico, Universidade Técnica de Lisboa Av. Rovisco Pais, 1
P-1049-001 Lisbon, Portugal
m.boubezari@ist.utl.pt, bcoelho@ist.utl.pt
ABSTRACT
This paper presents an interdisciplinary method for sound space representation that takes into account human perception, language and acoustical values of noise in a synergetic protocol of measurements. A qualitative sound map will result that describes the sound topologies corresponding to differentiated sound sources. Every sound topology is a spatial distribution of a sound (traffic, water, music …) distinguished from its background.
By using this method, one can know exactly the composition of the soundscape in each point of listening, from the louder (nearer) to the unheard sound.
INTRODUCTION
There could be an easy way to produce qualitative maps with the existing methods and tools of mapping: one type of source in each layer for the same site can be simulated and calculated. However, the masking effects that happens between the sources would not be taken in account. And the final representation will not be faithful to the way the soundscape is heard on site.
For this reason, one chooses an in situ method based on recorded samples so that to guarantee the fidelity with the natural soundscape composition.
METHOD
The methodological question in this work is: how to separate the sources that are already mixed when samples are recorded? The hypothesis is to consider the human ear as a semantic filter and to introduce it in the analysis process because until now, a similar filter or measurement device does not exist.
The Group of Acoustics of CAPS-IST has drawn the noise map of Lisbon [1]. This map cannot translate particular influences of local sound sources in areas where they can be well perceived by the users at public spaces. That is the case of Rossio Square in Lisbon. This urban area was chosen for tests in the present work, since its soundscape is quite varied and the human occupation is always diversified.
thirty seconds were taken at 10 meters intervals approximately. The complete sound recording was taken during one hour, between 12h00 and 13h00 at Rossio Square in Lisbon.
Following the observation of the relevant sound rhythms on the spot, like that of traffic determined by traffic lights, all the recorded sound fragments were assured to be in phase with these rhythms. In this way, the fragments are similar in their sound composition.
By listening and while paying attention (cocktail effect) to only one type of sound beforehand (traffic noise, music and the water fountain), a masking white noise was gradually introduced, until the limit of audibility for the selected sound was reached. The white noise corresponds to the measure of the designated sound as described below. The principle is to measure noise with noise.
Musical composition software was used to mix up each fragment with the white noise.
Each sound fragment underwent three steps of analysis, for the water fountain, for the ambiance music and for the traffic noise. Horns were excluded because they are rare and not easily maskable.
MASKING WHITE NOISE TESTS
[image:2.595.187.389.316.448.2]The ratio between a masker white noise and any other sound had to be defined. Tests were performed by using professional headphones and a computer in a quite room. Music composition software was used for mixing. The masking white noise of 60dB was generated by the computer.
Figure 1 – Masking white noise measured at 60 dB (SPL)
Various sounds were tested in a mono format presented binaurally: • Recorded human voice reading text in a quiet room
• Synthetic orchestral strings playing A4 (440Hz) with reverberation • Synthetic cathedral organ playing A4 with added reverberation
When mixing the white noise with these sounds separately, the level of each sound was lowered until it is totally masked by the white noise. The white noise and all the tested sounds were fixed and recorded to disc with the obtained level into digital audio format. Spectral analysis was applied to each sample.
The listening level did not need to be fixed. It was increased in the beginning of the test until a comfortable level of listening was reached. However, it was important to focus on the difference between the masker and masked sound levels.
The results correspond to one listener with normal hearing. Other listeners have obtained the same results with only 3dB of difference. As the aim of this method is to measure objectively, but using the perception ability of only one subject as the measuring apparatus, therefore, it was not considered necessary to perform tests on a large panel of subjects. The results from one subject were seen to be sufficient. In fact, a better or a worst human quality of listening applied in this method of assessment corresponds to a high or low quality sound level meter used in classical measurements. Human sensitivity and perception are used instead of microphone sensitivity and high precision of signal processing of sound level meter.
results
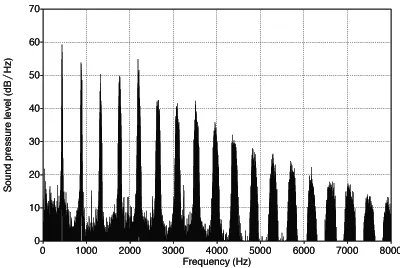
Figure 2 – Cathedral Organ (A4)
[image:3.595.189.390.281.412.2]In the case of the cathedral organ, the louder frequency reaches 59dB at 1320 Hz.
Figure 3 – Human voice reading a text
The louder frequency of the human voice reaches 59dB.
Figure 4 – Orchestral strings (A4)
The louder frequency of orchestral strings was measured at 60dB.
DISCUSSION OF “PERCEIVED SOUND SIZES”
[image:3.595.189.389.479.613.2]known loudness level, the “sound size” is in fact an objective measure whereas loudness is subjective. “Sound size is obtained directly from the masking level of the controlled white noise. For this reason, one can say that all the sounds measured in this experiment, (voice, organ, ring phone etc.) have the same size for the listener, albeit sound level. All these sounds need the same level of white noise to be completely masked.
RESULTS
[image:4.595.213.382.223.391.2]The masking method described above was applied to the recorded samples. By reporting the resulting values of the mask to the map, one obtains the qualitative maps shown in Figure.5 and Figure.6. They reveal the sound topologies [3] of the designated sounding objects. That means the limits where the walkers are in contact with the sound or not.
[image:4.595.232.364.430.602.2]Figure 5 – Fountain water sound limits of audibility
figure 6 – Ambient music limits of audibility
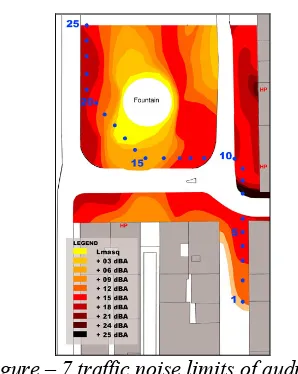
The traffic noise, Figure.7, is really dominant in the overall ambient noise because it needs more masking noise. In the interaction between the three measured sources, one can observe the areas where the noise traffic eliminates completely the two others in the white areas.
This masking effect becomes obvious in this type of maps. One can observe the contractions of the sound topologies of the two sources: ambient electro-acoustic music and fountain’s water. One can define exactly at which place each source becomes inaudible depending on the level of the masking background (uncoloured areas). In these deaf zones, the walkers are out of “contact” with the water and music sound topologies.
Figure – 7 traffic noise limits of audibility
Contrary to solid topologies, sound topologies are very fluctuating. They reflect the internal fluctuations of the sound space even if the total level does not change.
Figure – 8 linear representation of soundscape in a potential course
Starting from localised information, one can describe the composition of the soundscape that is potentially heard by some walkers, see Figure-8. In this way, one can observe with more acuity the critical points on the plan where annoying or dominant sources are actives (point 7.). And where this dominant noise becomes itself masked (point 17.) for example.
CONCLUSION
The results showed that the introduction of human perception during the process of analysis and of treatment of the signal makes it possible to target measurements on one or more noise sources selected separately from their background noise. Contrary to conventional measurements, which yield overall values of LAeq, without distinguishing sources, the method presented here allows a space description of a soundscape by standing out each sound form from its context. It can measure the range of a noisy source in a given place, test the range or the masking of an urban device (fountain) or contribute to the decision and the design of a specific architectural project, for example.
[image:5.595.151.446.333.514.2]One hopes that more acuity in the visual representation of sound makes the action on the urban sound environment more precise both in terms of the results to be achieved and of the cost-benefit ratios of the possible solutions.
A new technique has been presented that lead to the production of qualitative sound maps. These can be powerful tools for the urban technicians and architects working with noise in the urban areas.
AKNOWLEADGEMENTS
This work was developed under a grant from the Portuguese Science and Technology Foundation.
REFERENCES
[1] J.L. Bento Coelho and M.J. Palma, 2000, “Lisbon Noise Map”, Proc. Inter-noise 2000, The 29th International Congress on Noise Control Engineering, Nice, France, 6-3968.
[2] E. Zwicker, B. Scharf, “Model of loudness summation.” Psychological review, 72, 3-26, (1965)
[3] M.Boubezari and J.L. Bento Coelho, Sound topology as an architectural element of design. ICSV12, Twelfth International Congress on Sound and Vibration, Lisbon, 2005
SHORT BIBLIOGRAPHY
A. Berthoz , Le sens du mouvement, (Odile Jcobe, Paris, 1998)
V. Bruce & P. Green , la perception visuelle. Physiologie, Psychologie et Écologie (PUG, Grenoble, 1993)
M. Boubezari, J. L. Bento Coelho, Towards Qualitative Sound Maps With Differentiated Sources, The 18th International Congress on Acoustics, ICA 2004, "Acoustic Science and Technology for Quality of Life", Kyoto, April 4 to 9, 2004 Kyoto, Japan
M. Boubezari, J. L. Bento Coelho, Sound topologies as a spatial description of the soundscape, the qualitative sound map of Rossio square in Lisbon , Congrès commun CFA/DAGA '04, StrasbourgFrance, 22.-25.mars.2004
M. Boubezari, méthode exploratoire sur les pratiques intuitives de maitrise du confort acoustique en milieu habité, P.H.D. Cresson, Grenoble 2001