G
Guuiimmaarrããeess--PPoorrttuuggaall
paper ID: 116 /p.1
USING STATED PREFERENCE METHODS TO
VALUE NOISE FROM TRANSPORTATION SOURCES
A.L. Bristow and M. Wardman
Institute for Transport Studies, Univeristy of Leeds, Leeds LS2 9JT, United Kingdom abristow@its.leeds.ac.uk
ABSTRACT: This paper provides an overview of experience thus far in the use of stated preference methods to value noise nuisance from transport sources. The paper firstly examines the arguments for using stated preference and the challenges inherent in the approach before moving on to describe a study in Edinburgh of road traffic noise. This study identified plausible values and provided some valuable insight into the influences of the size and sign of the environmental change and socio-economic factors. Finally we compare these results with those from other studies and conclude on the potential of stated preference methods in this context.
1. INTRODUCTION
The most commonly used stated preference method in environmental economics has been Contingent Valuation (CVM) and a reasonable number of studies now exist in the context of transport noise [1 and 2]. However, we would contend that Stated Preference paired comparison experiments (hereafter termed SP) have advantages.
In this paper we firstly compare the CVM and SP approaches, and then move on to consider critical issues in applying SP in the context of transportation noise. We then consider an SP experiment in Edinburgh and evidence from other SP studies in this context.
2. WHY STATED PREFERENCE?
SP examines several attributes simultaneously whilst CVM tends to look at attributes in isolation. SP therefore has an important advantage since the purpose of the study will be less obvious and a lesser incentive to strategic bias can be expected [3]. Zero willingness to pay ‘protest’ responses are common in CVM whilst values based on willingness to accept compensation tend to be far higher than willingness to pay values. In addition, SP can examine interaction effects and is also more useful when the scenario under consideration is multi-dimensional. SP examines different levels of attributes, whereas CVM generally does not, and hence the SP approach supports detailed analysis of the relationship between the valuation of an attribute and its level as well as sign and size effects.
G
Guuiimmaarrããeess--PPoorrttuuggaall
paper ID: 116 /p.2
information content of the single response is in principle high, SP responses can be expected to be more reliable for two key reasons. Firstly, it is simpler to indicate the order than the strength of preference. Secondly, individuals routinely make choices but are rarely required to establish the strength of preference in real life decision making.
SP is a behavioural model from which values are implied, whereas CVM is a direct valuation model. Whilst SP is more suited to forecasting applications, CVM can avoid the problems involved in the development of choice models and is generally easier to analyse. CVM is relatively straightforward to design. In contrast, there is no unique SP experimental design and the design process is somewhat more complicated and surrounded by greater uncertainty.
Although SP does not dominate CVM from a theoretical perspective, we regard the former to be, on balance, preferable. In this paper we provide some evidence to support the ability of SP to identify values of noise.
3. CRITICAL ISSUES
In this section we consider two of the challenges in applying SP methods in this context.
3.1 Presentational Issues
In any SP or CVM exercise, the attributes to be valued must exhibit variation, and it is important that the respondent has a good understanding and experience of the attribute variation they are being asked to evaluate and that there is a precise measure of this variation. There are several means which can and have been used to represent attributes in the case of noise where there is no straightforward and easily understood objective measure.
Scales: The simplest way forward is to use a scale, such as the categories of ‘very noisy’,
‘noisy’, ‘quite noisy’ which is a common approach in measuring annoyance from noise [4]. The main problem is to relate these scales to actual levels of the variables in question and in particular at the evaluation stage to be able to know when a change causes an individual to experience one level of the variable instead of another.
Proportionate Change: A common approach in valuing traffic noise is to specify a
proportionate change from the current situation [5, 6, 7 and 8]. The key disadvantages are respondents’ difficulties in understanding percentage changes and, since the impact of a given percentage change will depend upon the base to which it applies, relating changes to an objective measure.
Pictures/photographs/verbal description: This method is fairly common in valuing
landscape features and visibility, but of limited use in the context of intangible attributes.
Simulation: Respondents can experience the environmental impact at different levels under
G
Guuiimmaarrããeess--PPoorrttuuggaall
paper ID: 116 /p.3
and sound recordings in a hall test setting to communicate the intrusiveness of road and rail. It is possible to simulate a wide range of situations and to be certain that the physical stimulus is the same and measurable for each respondent. Disadvantages are the expense, whether respondents are affected by the artificial and usually limited exposure and how the laboratory stimuli relate to respondents’ actual experiences.
Location: This can take a spatial dimension, whereby the respondent is asked to compare
different locations with different exposures to noise levels [5 and 10], or a temporal dimension, where at the same location there is variation in exposure over time [11]. Ideally, the respondent would be familiar with the different levels of the attribute. The location approach offers the potential to maximise familiarity with a change in an environmental attribute and it is possible to take an objective measure of the environmental change. The main drawback is that suitable locations are not always readily available to provide an experienced variation.
Proxy: A proxy measure must correlate well with the impact to be valued yet also be
meaningful to respondents. An example in the case of aircraft noise is the number of aircraft movements per hour during a specified time period [12 and 13]. This approach is easily understood, allows values to be derived for a range of time periods and can be linked directly to an objective measure of noise.
There is no clearly superior approach. The location approach is attractive in using situations that respondents have experienced and where the noise levels can be objectively measured. We used this approach with respect to air pollution where it yielded better results than a proportionate change [2] and it has since been developed further in the context of noise and residential choice [10].
3.2 Bias
It has long been recognised that some individuals will not reveal their true preferences when there is a benefit to be gained from not doing so. The classic free-rider problem arises where payment is expected and the reverse incentive to overstate values where payment is not expected. The risk of strategic bias is clearly present in CVM questions where the object of the exercise is clear. In SP experiments it is possible to mask the purpose of the exercise through the use of a number of attributes in an experiment. Evidence from SP applications in transport suggests that where the objective of the exercise is obvious, especially where the issue is contentious, strategic bias is likely to occur [3]. Thus in order for SP to retain an advantage over CVM the purpose of the experiment should be masked as far as possible.
4. VALUATION OF ROAD TRAFFIC NOISE IN EDINBURGH
G
Guuiimmaarrããeess--PPoorrttuuggaall
paper ID: 116 /p.4
choice between two houses (A and B) which differed in terms of traffic related noise and air quality, travel times around Edinburgh by car and bus and council tax. Other attributes were specified to be the same for the two alternatives. Noise and air pollution were presented in terms of a percentage change from current levels. A location method was also used for air pollution, using known locations, half with good air quality and half with poor air quality, in Edinburgh and comparing them with the current situation. An open ended CVM question was also asked, again in terms of percentage change.
Key findings only are reported here. On average households were willing to pay 9.3 pence per week to avoid a 1% increase in noise and 6.3 pence to achieve a 1% reduction, indicating that losses are valued more highly than gains. Thus a 50% change in noise levels is valued at between £3.15 and £4.65 per week per household. The unit value of a percentage change in noise levels did not vary significantly with the size of the change, as the size of the change increases, so does the total value of that change in an almost linear fashion. Socio-economic variables that influenced noise values positively include: the size of the household, the presence of children, noise alleviation measures and income, these are discussed in section 5.2. Table 1 indicates variations by size of household, presence of children and income groups (where Inc1 = low and Inc 3 = high). The estimated income elasticity is 0.7.
Table 1: Household Values of a 1% Change in Noise Levels (pence per week) Noise Increase Noise Decrease
Inc1 Inc2 Inc3 Inc1 Inc2 Inc3
One Adult and No Children 4.1 6.6 10.7 0.0 0.0 0.0 One Adult and Children 7.3 11.8 19.1 3.2 5.2 8.4 Two Adults and No Children 6.9 11.1 18.0 6.0 9.7 15.7 Two Adults and Children 10.1 16.3 26.4 9.2 14.9 24.2 Source: Wardman and Bristow 2004 [2]
The weekly household noise valuations for a 50% change and 95% confidence intervals are as follows. £1.48 (±0.34) for CVM1 which excludes respondents who stated that noise could not be reduced in this way. This increases to £2.55 (±0.54) in CVM2 which additionally excludes those who were unwilling to pay more council tax. The SP value is higher at £3.17 (±1.94) though not significantly so.
5. EVIDENCE FROM OTHER STUDIES
[image:4.595.219.375.44.125.2]5.1 Comparison of Values
G
Guuiimmaarrããeess--PPoorrttuuggaall
[image:5.595.67.527.162.412.2]
paper ID: 116 /p.5
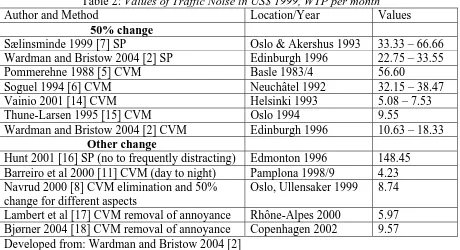
Table 2: Values of Traffic Noise in US$ 1999, WTP per month
Author and Method Location/Year Values
50% change
Sælinsminde 1999 [7] SP Oslo & Akershus 1993 33.33 – 66.66 Wardman and Bristow 2004 [2] SP Edinburgh 1996 22.75 – 33.55
Pommerehne 1988 [5] CVM Basle 1983/4 56.60
Soguel 1994 [6] CVM Neuchâtel 1992 32.15 – 38.47
Vainio 2001 [14] CVM Helsinki 1993 5.08 – 7.53
Thune-Larsen 1995 [15] CVM Oslo 1994 9.55
Wardman and Bristow 2004 [2] CVM Edinburgh 1996 10.63 – 18.33
Other change
Hunt 2001 [16] SP (no to frequently distracting) Edmonton 1996 148.45 Barreiro et al 2000 [11] CVM (day to night) Pamplona 1998/9 4.23 Navrud 2000 [8] CVM elimination and 50%
change for different aspects
Oslo, Ullensaker 1999 8.74
Lambert et al [17] CVM removal of annoyance Rhône-Alpes 2000 5.97 Bjørner 2004 [18] CVM removal of annoyance Copenhagen 2002 9.57 Developed from: Wardman and Bristow 2004 [2]
There is a fairly high degree of correspondence between the noise valuations derived in different locations. The values for traffic noise are broadly consistent with our findings that SP values exceed those obtained using CVM. However, some CVM noise values [5 and 6] are more in line with SP studies. In the case of [6] an iterative CVM was applied and so the values might be expected to be higher. Pommerehene’s survey [5] offered a move to a neighbouring street where noise levels were halved in a realistic scenario. Also this study is the oldest in the table, and the assumption that the elasticity of the values to GDP is one may have inflated the values from early studies. CVM studies not included in the tables because they valued a reduction in traffic nuisance overall [19 and 20] also yielded lower values than those in SP studies for noise and air pollution effects. Three of these studies [5, 14 and 18] found CVM values to be lower than those estimated from hedonic pricing methods. While Eliasson et al [9] found SP values for intrusion to be around twice as high as HP values. There is as yet insufficient evidence comparing the results of SP, CVM and revealed preference methods in this context to reach a clear conclusion as to the preferred method. Evidence from environmental valuation in other areas suggest that CVM values are commonly less than revealed values and that SP values have compared favourably with revealed preference results [2] supporting our contention that SP is preferred.
5.2 Influences on valuations
G
Guuiimmaarrããeess--PPoorrttuuggaall
paper ID: 116 /p.6
We have not discerned any effect from length of residency on noise and air quality valuations, and are aware of only one study [10] which has. We found that those who had undertaken noise alleviation measures had higher values, which is presumably a self selectivity effect similar to that apparent in Arsenio et al. [10] and Eliasson et al. [9] whereby those with higher values tend to choose less noisy home locations. However, Vainio [14] and Pommerehne [5] both find that the installation of insulation depresses the willingness to pay for further noise reductions.
There will be a tendency for larger households to have larger valuations simply because they have higher incomes. We would also expect a household with a given income to have higher values where it contains more members. We have identified relatively strong effects from household size. We also found that the presence of children increases the valuation as did others [5, 6 and 18] while Vainio [14] found the opposite.
In general, studies valuing noise find that there are only a limited number of socio-economic variables which have a significant influence on values, with income being the key variable, followed by household size and composition and factors related to self-selectivity. This is broadly in line with our findings.
6. CONCLUSIONS
In general SP appears to yield plausible values of noise and gives critical insight into influences on values. Presenting changes in noise levels in terms of percentage change does yield plausible results, however, given the possible different interpretations of say a 50% change and the lack of experience of such levels by respondents we would recommend approaches based on location and hence experience, this approach yielded better results in the context of air pollution than a percentage change [2]. In comparing CVM and SP we conclude that the reduced emphasis on cost and the lesser transparency of the purpose of the study means that the incentive to bias responses is reduced in SP studies. However, where the SP is transparent this advantage is lost [21]. Additional advantages of SP are the ability to identify a greater range of influencing variables and as recent studies on aircraft noise valuation have shown values can be obtained for different times of the day and between weekdays and weekends [3 and 13]. We would therefore favour SP over CVM. There is a clear need for further research comparing SP, CVM and RP approaches.
REFERENCES
G
Guuiimmaarrããeess--PPoorrttuuggaall
paper ID: 116 /p.7
[2] Wardman M. and Bristow A.L (2004) Noise and Air Quality Valuations: Evidence from Stated Preference Residential Choice Models, Transportation Research D, 9(1) 1-27.
[3] Bristow A.L. and Wardman M. (2004) Using Stated Preference to Value Annoyance from Aircraft: A Comparison of Approaches, paper to envecon 2004 Applied Environmental Economics Conference 26th March 2004 Royal Society London
http://www.eftec.co.uk/TESTING%20-%20Bristow%20and%20Wardman.pdf
[4] Fields J.M., De Jong R.G., Gjestland T., Flindell I.H., Job R.F.S., Kurra S., Lercher P., Vallet M., Yano T., Guski R., Felscher-Suhr U. and Schumer R. (2001) Standardized General-Purpose Noise Reaction Questions for Community Noise Surveys: Research and Recommendation, Journal of Sound and Vibration 242(4) 641-679
[5] Pommerehne W.W. (1988) Measuring the Environmental Benefits: A Comparison of Hedonic Technique and Contingent Valuation, in Bos D., Rose M. and Seidl C. (eds) Welfare and Efficiency in Public Economics Springer-Verlag, Berlin.
[6] Soguel N. (1994) Measuring Benefits from Traffic Noise Reduction Using a Contingent Market. CSERGE Working Paper GEC 94-03, University of East Anglia.
[7] Sælinsminde K. (1999) Stated choice valuation of urban traffic pollution and noise. Transportation Research Part D, 4 pp13-27
[8] Navrud S. (2000) Economic Benefits of a Program to Reduce Transportation and Community Noise: A Contingent Valuation Study. Internoise 2000, 29th International Congress and Exhibition on Noise Control Engineering, 27-28 August, Nice, France.
[9] Eliasson J., Lindqvist Dillen J. and Widell J. (2002) Measuring Intrusion Valuations Through Stated Preference and Hedonic Prices: A Comparative Study. Paper Presented to European Transport Conference, PTRC, London.
[10] Arsenio E., Bristow A.L and Wardman M. (2002) Marginal Values of Traffic Noise Externalities from Stated Preference Methods. Paper Presented at European Transport Conference, PTRC, London.
[11] Barreiro J., Sánchez M. and Viladrich-Grau M. (2000) How Much are People Willing to Pay for Silence? A One and One-Half-Bound DC CV Estimate. Depatamento Gestión de Empresas, Universidad Pública de Navarra.
G
Guuiimmaarrããeess--PPoorrttuuggaall
paper ID: 116 /p.8
France. http://www.eurocontrol.fr/ba_env/Documents/EEC_SEE_2003_002.pdf
(published July 2003).
[13] Carlsson F., Lampi E. and Martinsson (2004) Measuring marginal values of noise disturbance from air traffic: Does the time of the day matter? Working Papers in Economics no. 125, Department of Economics, Gothenburg University.
http://d.repec.org/n?u=RePEc:hhs:gunwpe:0125&r=res accessed 4/6/04
[14] Vainio M. (2001) Comparison of Hedonic Price and Contingent Valuation Methods in the Urban Traffic Noise Context. Inter-Noise 2001: Proceedings of the 2001 International Congress and Exhibition on Noise Control Engineering, The Hague, Netherlands.
[15] Thune-Larsen H. (1995) Flystøyavgifter basert på betalingsvillighet, TOI report 289/1995. (English language summary report: Charges on Air Traffic Noise by Means of Conjoint Analysis).
[16] Hunt J.D. (2001) A Stated Preference Analysis of Sensitivities to Elements of Transportation and Urban Form. Paper presented at 2001 TRB Conference, Washington.
[17] Lambert J., Poisson F. And Champelovier (2001) Valuing benefits of a road traffic noise abatement porgramme: a contingent valuation survey. Paper to the 17th International Congress on Acoustics, Rome 2001.
[18] Bjørner T.B. (2004) Comparing the Value of Quiet from Contingent Valuation and Hedonic Pricing Methods, paper to EAERE Conference 2004, Budapest.
[19] Walker R. (1997) Oxford City Transport Package: The Contingent Valuation Method. Paper to the Conference, Determining Monetary values of Environmental Impacts, London 1997.
[20] Bateman I.J., Langford I.H., Munro A., Starmer C. and Sugden R. (2000) Estimating Four Hicksian Welfare Measures for a Public Good: A Contingent Valuation Investigation. Land Economics 76 (3), pp.355-373